Full Version - Issue 7 | November 2011 - LTA Academy
Full Version - Issue 7 | November 2011 - LTA Academy
Full Version - Issue 7 | November 2011 - LTA Academy

You also want an ePaper? Increase the reach of your titles
YUMPU automatically turns print PDFs into web optimized ePapers that Google loves.
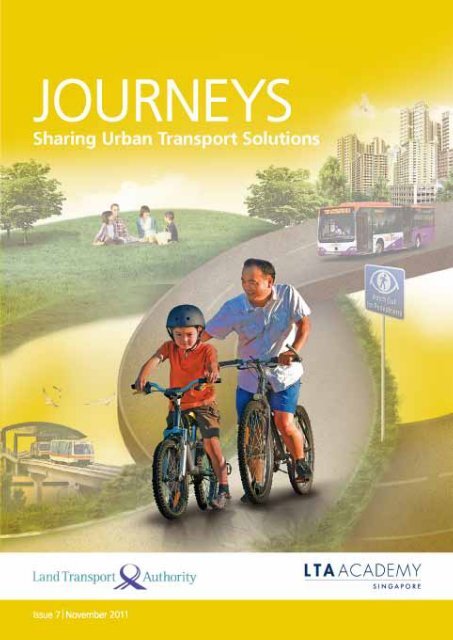
JOURNEYS<br />
Publisher<br />
<strong>LTA</strong> <strong>Academy</strong><br />
Land Transport Authority<br />
1 Hampshire Road<br />
Singapore 219428<br />
Editorial Team<br />
Naleeza Ebrahim<br />
George Sun<br />
Mageret Ely<br />
Foo Jong Ai<br />
All feedback, suggestions and contribution of papers for future issues are welcome.<br />
Please address all correspondence to:<br />
JOURNEYS<br />
<strong>LTA</strong> <strong>Academy</strong><br />
Land Transport Authority<br />
1 Hampshire Road<br />
Singapore 219428<br />
Fax: 65 6396 1890<br />
Email: JOURNEYS@lta.gov.sg<br />
JOURNEYS is also available online at www.<strong>LTA</strong>academy.gov.sg<br />
© <strong>2011</strong> <strong>LTA</strong> <strong>Academy</strong>, Land Transport Authority, Singapore<br />
All rights reserved. No part of this publication may be reproduced, stored or transmitted in any form or by<br />
any means without the prior written permission of the <strong>LTA</strong> <strong>Academy</strong>, Land Transport Authority, Singapore.<br />
The opinions and views expressed in this publication are those of the authors and do not necessarily reflect<br />
the views of the <strong>LTA</strong> <strong>Academy</strong> or the Land Transport Authority, Singapore.<br />
ISSN: 1793-494X
Contents<br />
Sustainable Urban Transport<br />
07. Urban Sustainability and<br />
Transportation: Research<br />
Framework for Medium and<br />
Long Term Transport Planning<br />
K.W. AXHAUSEN<br />
Alex ERATH<br />
20. Transport Mobility Management:<br />
Small Changes - Big Impacts<br />
Damian PRICE<br />
Amy LEATHER<br />
Best Practices<br />
31. Different Approaches to Public<br />
Transport Provision<br />
David A. HENSHER<br />
Gabriel WONG<br />
42. Recommendations for Improving<br />
Transportation Energy Efficiency<br />
in APEC Economies<br />
Laura VAN WIE MCGRORY<br />
52. Achieving Green Freight in Asia<br />
Sophia PUNTE<br />
Yan PENG<br />
References<br />
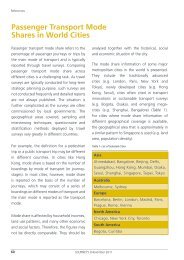
60. Passenger Transport Mode Shares<br />
in World Cities<br />
71. Comparison of Public Transport<br />
Operations
Mohinder Singh<br />
Dean<br />
<strong>LTA</strong> <strong>Academy</strong><br />
A<br />
s we publish yet another issue<br />
of JOURNEYS, the contributions<br />
of our authors attest to the<br />
fact that matters relating to urban and<br />
transport planning continue to challenge<br />
governments, policy makers and societies all<br />
over the world. It is clear that great minds<br />
are kept busy with ideas and concepts on<br />
how to move people, goods and services in<br />
the best possible way. The issue is getting<br />
more complex with greater urbanisation in<br />
every country, and as the global village gets<br />
smaller, as more people want or need to<br />
travel or transport things. Yet, rising to the<br />
challenge, urban and transport planners<br />
are unstinting in their efforts to make<br />
improvements and chart the way forward.<br />
Professor KW Axhausen and Alex Erath<br />
from ETH Zurich (Swiss Federal Institute of<br />
Technology Zurich) give a glimpse of the<br />
research on Mobility and Transportation at<br />
the Future Cities Laboratory. The goal is to<br />
derive tools to manage, plan and optimise<br />
the flow of people and goods at different<br />
Dean’s Words<br />
time scales and in their interactions with all<br />
elements of the future city. The project has<br />
both medium and long-term perspectives.<br />
The authors say that the integration of the<br />
medium and long term horizons in the<br />
research is a significant methodological<br />
innovation that will enable a global analysis<br />
of complex issues related to mobility in the<br />
future.<br />
From Mott MacDonald, Damian Price<br />
and Amy Leather explore what is still<br />
considered a relatively new element of the<br />
transport practitioner’s toolbox, Transport<br />
Mobility Management (TMM). They present<br />
examples of international best practices in<br />
TMM and examine the degrees of success.<br />
They have found that the more successful<br />
TMM initiatives are those embedded in the<br />
wider transport approach of a government,<br />
authority or service provider. The authors<br />
have even distilled the Top Ten Measures for<br />
success in TMM to share with our readers.<br />
Collaborating at the <strong>LTA</strong> <strong>Academy</strong>, Professor<br />
David Hensher and Gabriel Wong examine<br />
the different approaches to the provision<br />
of public transport in various cities around<br />
the world. These approaches include<br />
government operation, competition in the<br />
market, government regulation of fares<br />
and services, competitive tendering, and<br />
negotiated performance-based contracts.<br />
What emerges is that there is no one-size fits<br />
JOURNEYS | <strong>November</strong> <strong>2011</strong><br />
5
all approach. Cities, governments and policy<br />
makers have to test out and decide which<br />
model suits them, their ultimate aim being<br />
to develop integrated and accessible urban<br />
public transport systems with reasonable<br />
quality of services and at affordable fares.<br />
At the Alliance to Save Energy, Laura Van<br />
Wie McGrory puts together the consensus<br />
reached at the 2009 APEC Workshop on<br />
Policies that Promote Energy Efficiency<br />
in Transport (WPPEET). Specifically, the<br />
agreement was that APEC economies<br />
should aim to increase transit-oriented<br />
development and integrated land-use<br />
planning while minimising private motorised<br />
transport. It also proposes that APEC has<br />
a role in promoting energy efficiency in<br />
transportation, through projects and the<br />
coordination of bodies that advise leaders<br />
of the APEC economies. Furthermore,<br />
these measures in APEC may also be used<br />
to enhance other global transportation<br />
initiatives.<br />
Sophie Punte and Yan Peng, both from<br />
Clean Air Initiative Asia, raise the less<br />
common topic of freight’s contribution<br />
6 JOURNEYS | <strong>November</strong> <strong>2011</strong><br />
to air pollution and what can be done<br />
to reduce their emissions. The authors<br />
reveal how a small trucks pilot project in<br />
Guangzhou led to a larger freight project<br />
in Guangdong, which eventually paved the<br />
way for a national freight programme in<br />
China. According to them, these initiatives<br />
on greening the freight and logistics sector<br />
are expected to be replicated in other Asian<br />
countries, with strong support from private<br />
sector. These revelations should certainly<br />
spell good news across these societies as the<br />
movement of freight is a major component<br />
of their economic wealth, while conversely<br />
contributing to poor physical health due to<br />
their pollutant emissions.<br />
I would like to thank all the authors for<br />
their myriad of ideas and concepts, proving<br />
that transport planning continues to be<br />
an intriguing and exciting topic. I am sure<br />
readers will find it so. More than that,<br />
hopefully, their contributions help to bring<br />
us closer to solutions.
Urban Sustainability and Transportation: Research Framework for Medium and Long Term Transport Planning<br />
Urban Sustainability and Transportation:<br />
Research Framework for Medium and<br />
Long Term Transport Planning<br />
K.W. AXHAUSEN and Alex ERATH<br />
Abstract<br />
This paper presents an overview of the research of the module, Mobility and Transportation,<br />
one out of nine modules of the Future Cities Laboratory (FCL), the first interdisciplinary<br />
research group of the Singapore-ETH Centre for Global Environmental Sustainability<br />
(SEC). The aim of the module is to advance research into the complex arena of land<br />
transport, which derives from the demands of managing, planning and optimising the<br />
flow of people and goods at different time scales and the interaction of these aspects<br />
with all elements of the future city.<br />
Introduction<br />
This century will, for the first time, see over<br />
half the world’s population living in cities<br />
(UN 2007). Making these urban structures<br />
environmentally, economically and socially<br />
sustainable and liveable is one of today’s great<br />
challenges. Due to the central importance<br />
of cities’ infrastructure and performance,<br />
one key element to meet this challenge is<br />
transportation infrastructure. Embedded in<br />
the Singapore National Research Foundation’s<br />
initiative, Campus for Excellence and<br />
Technological Enterprise (CREATE), and with<br />
the objective to advance research into the<br />
complexity of land transport, the research<br />
outlined in this article addresses this challenge.<br />
The research is one of the nine modules of<br />
the Future Cities Laboratory, the first research<br />
programme of the Singapore-ETH Centre for<br />
Global Environmental Sustainability (SEC). The<br />
research is performed in close collaboration<br />
with the other FCL modules, the ETH Institute<br />
of Transport Planning and Systems based<br />
in Zurich, and the Interdisciplinary Research<br />
Groups of the SMART MIT Future Mobility and<br />
TUM CREATE initiatives based in Singapore.<br />
The goal of this research is to derive tools to<br />
manage, plan and optimise the flows of people<br />
and goods at different time scales and in their<br />
interactions with all elements of the future city.<br />
The project has two perspectives: medium- and<br />
long-term (Figure 1). The medium term refers<br />
to the change across all degrees of freedom<br />
of the system (population, infrastructure, land<br />
use, regulation and pricing), but still taking<br />
the given situation as the starting point. The<br />
long-term processes make it possible over time<br />
to consider the changes required to achieve<br />
overarching policy goals and to account for<br />
The goal of this research is to derive<br />
tools to manage, plan and optimise the<br />
flows of people and goods at different<br />
time scales and in their interactions<br />
with all elements of the future city.<br />
JOURNEYS | <strong>November</strong> <strong>2011</strong><br />
7
Urban Sustainability and Transportation: Research Framework for Medium and Long Term Transport Planning<br />
Figure 1: Research Framework<br />
Preparatory work<br />
Research<br />
Implementation of MATSim Singapore<br />
Medium Term<br />
Long Term<br />
their benefits and costs. Both perspectives will<br />
be developed in an integrated manner based<br />
on the same software framework and are<br />
presented in the following sections.<br />
Research Framework<br />
Basis: Large-scale,<br />
multi-agent,activity-based<br />
transport demand model<br />
The research framework is provided by the<br />
multi-agent-based travel demand simulation<br />
MATSim (MATSIM-T <strong>2011</strong>). Open-source<br />
MATSim is one of a group of agent-based<br />
models that have recently been developed<br />
to realise the potential of the activity-based<br />
approach in practice (Bradley and Bowman<br />
2006). In line with the activity-based approach<br />
(Jones et al. 1983), MATSim is based on the<br />
idea of the 24 hour daily activity schedule as<br />
the basic behavioural unit. In contrast to most<br />
other current agent-based models, it fully<br />
integrates traffic flow simulation to calculate<br />
the generalised costs of travel implied by the<br />
schedule. In addition, MATSim is designed for<br />
speed and scale, which allows it to address<br />
large-scale and finely detailed scenarios. For<br />
example, the Switzerland implementation has<br />
7.5 million agents, 1 million links and 1 million<br />
destinations (Figure 2), and is still able to<br />
8 JOURNEYS | <strong>November</strong> <strong>2011</strong><br />
find a steady state solution within acceptable<br />
computing time (Balmer et al. 2010). Besides<br />
Switzerland, MATSim has been successfully<br />
implemented in Toronto, Berlin and Tel-Aviv.<br />
Figure 2: MATSim model for Zurich morning peak traffic at<br />
7am. (Source : Visualisation courtesy of senozon AG Zurich)<br />
The research will be based on a calibrated<br />
and validated version of the multi-agentbased<br />
travel demand simulation MATSim<br />
for Singapore. This model will provide the<br />
simulation environment needed for both the<br />
medium-term and the long-term developments.<br />
Medium Term<br />
For the medium term time s c a l e , two<br />
subprojects are envisaged. The first will develop<br />
an approach to scheduling activities over the<br />
course of a week. The second is dedicated<br />
to the simulation-based optimisation of two<br />
aspects of urban transport systems: transport<br />
demand management and bus network<br />
optimisation.<br />
• Weekly Activity Scheduling<br />
Current activity-based models are generally<br />
one-day equilibrium-based models.<br />
This one-day restriction is becoming<br />
increasingly problematic, as many policies
Urban Sustainability and Transportation: Research Framework for Medium and Long Term Transport Planning<br />
aim to reshape demand across longer time<br />
horizons; taking peak-spreading beyond a<br />
single day. Furthermore, it has been long<br />
recognised that this time horizon is too<br />
short, as at least a weekly rhythm is natural<br />
for the choices of many recurring activities.<br />
...many policies aim to reshape demand<br />
across longer time horizons; taking<br />
peak-spreading beyond a single day.<br />
One way to overcome this constraint is to<br />
reformulate MATSim so that it can be run<br />
open-ended. This redesign has to consider<br />
factors such as the rhythms of the year, the<br />
rhythms of major events, the business cycle,<br />
and long-term changes in the population<br />
and in the facilities (see below for the work<br />
on the agents and modules addressing the<br />
choices implied here).<br />
The key design decision will be the choice<br />
of the learning mechanism with which the<br />
agents adapt their behaviour to the patterns<br />
they experience. While MATSim+ will not<br />
impose the strict maximiser implied by<br />
stochastic user equilibrium, it will still assume<br />
that the agents want to improve their daily<br />
experience.<br />
Based on the idea of an ‘activity calendar’<br />
of desired, but not yet undertaken activities,<br />
the project will develop an approach to<br />
schedule these activities over the course<br />
of a week (Axhausen 2006). The work of<br />
Feil (2010) will be the starting point for<br />
the development of the approach. It will<br />
integrate the idea of a committed core<br />
schedule around which the travellers build<br />
JOURNEYS | <strong>November</strong> <strong>2011</strong><br />
Based on the idea of an ‘activity<br />
calendar’ of desired, but not yet<br />
undertaken activities, the project will<br />
develop an approach to schedule these<br />
activities over the course of a week.<br />
their week. It will not adopt a fully continuous<br />
view of activity generation as arising out of<br />
an understanding of incremental need<br />
build-up. Still, the model will be rewritten<br />
to enable such an open architecture. This<br />
path-dependent MATSim will combine<br />
the weekly horizon with the ability to be<br />
integrated in the longer-term considerations<br />
of a year and their development over time.<br />
The new processes to be added in the next<br />
element of the project will therefore have<br />
a suitable environment for people to age,<br />
move house, change jobs, etc.<br />
• Simulation Based Optimisation<br />
In terms of transport demand management,<br />
an integration of an optimisation approach<br />
for ERP will be developed, which will be<br />
based on the information available from<br />
the simulation. In contrast to the agents<br />
added for the long-term horizon, this<br />
optimiser will have a definite time horizon<br />
of one day. Furthermore, and again based<br />
on information of the transport simulation,<br />
research on the optimisation of bus network<br />
design and operation will be conducted, a<br />
topic of special importance to Singapore<br />
with its large public bus network.<br />
i. Optimising Traffic And Transport<br />
Demand Management Strategies<br />
The derivation and evaluation of traffic and<br />
transport demand management strategies<br />
9
Urban Sustainability and Transportation: Research Framework for Medium and Long Term Transport Planning<br />
for urban road networks typically relies<br />
on the use of microscopic simulation<br />
tools that capture in detail the behaviour<br />
of drivers, as well as, their interaction<br />
with the network infrastructure.<br />
Unfortunately, this degree of detail and<br />
realism comes at the cost of non-linear<br />
objective functions with no available<br />
closed form and potentially containing<br />
several local minima. To integrate these<br />
non-linear, stochastic and evaluationexpensive<br />
simulation models within an<br />
optimisation framework is a difficult<br />
and intricate task. In order to perform<br />
both fast and reliable simulation<br />
optimisation for congested networks,<br />
information from the simulation tool<br />
should be combined with information<br />
from a network model that analytically<br />
captures the structure of the underlying<br />
problem. The objective of this subproject<br />
is to derive efficient simulation-based<br />
optimisation methods for traffic and<br />
transport demand management.<br />
New simulation-based optimisation<br />
algorithms for the generation of road<br />
pricing strategies and speed control will<br />
be developed, implemented, and tested.<br />
The algorithms are designed for offline<br />
operations on medium time scales. This<br />
work is likely to consist of the further<br />
development of research previously<br />
conducted at EPFL (Osorio 2010) and<br />
TU Berlin (Lämmel and Flötteröd 2009);<br />
and have been already successfully<br />
implemented for MATSim scenarios<br />
(Mezdani <strong>2011</strong>). Interfaces of the<br />
10 JOURNEYS | <strong>November</strong> <strong>2011</strong><br />
realised algorithms to the simulation system<br />
are implemented and tested.<br />
...to perform both fast and reliable<br />
simulation optimisation for<br />
congested networks, information<br />
from the simulation tool should<br />
be combined with information<br />
from a network model that<br />
analytically captures the structure<br />
of the underlying problem.<br />
ii. Optimising Bus Systems<br />
The optimisation of bus networks and<br />
its operation is a highly complex, multiattribute<br />
problem (Figure 3). Besides<br />
dynamic demand, it features a range of<br />
variables such as number and location of<br />
the bus stop, bus routes, service frequency,<br />
availability of bus lanes, integration with<br />
other modes of public transport and<br />
even fare collection methods. Due to the<br />
complexity of the system, the problem will<br />
be decomposed into sub problems but<br />
all results will be evaluated based on the<br />
MATSim framework.<br />
The network design problem will be based<br />
on earlier work by Daganzo (2010) which<br />
describe the network shapes and operating<br />
characteristics that allow an efficient transit<br />
system, and by Fletterman (2008) which<br />
applies metaheuristics for network design.<br />
Special attention will be paid to the impact<br />
of separate bus lanes (Daganzo 2006).<br />
Based on this research, the city of Barcelona<br />
reorganised its bus network (Institute of<br />
Transportation Studies 2010). However, it<br />
has not yet been tested within a multi-agent
Urban Sustainability and Transportation: Research Framework for Medium and Long Term Transport Planning<br />
Figure 3: Representation of the public transport supply in Singapore in first quarter of 2010.<br />
(Width indicates capacity, brown lines represent buses, and other colours represent various MRT/LRT lines)<br />
transport demand model, which allows<br />
further refinement of the approach.<br />
In terms of bus operations, the research will<br />
build on earlier work proposing an adaptive<br />
control scheme to mitigate the problem of<br />
bus bunching (Daganzo 2008). The MATSim<br />
simulation allows for integration of the<br />
proposed scheme which dynamically<br />
determines bus holding times at control<br />
points based on simulation-based, real-time<br />
headway information. Finally, the findings<br />
of Tirachini and Hensher (<strong>2011</strong>) on the<br />
influence of fare collection systems and<br />
optimal infrastructure investments will be<br />
incorporated and applied to the Singapore<br />
scenario.<br />
Long Term<br />
The urban system is constantly evolving. It<br />
is changing at different speeds and scales.<br />
Endogenous and exogenous agents and forces<br />
accelerate or delay these changes. Current<br />
urban land use and transport models focus<br />
their attention on the impact of accessibility<br />
changes arising from shifts, reductions or<br />
increases in the general transport cost surface.<br />
They do so by employing spatial aggregates<br />
or zones as their reference system. They<br />
assume many atomistic actors, who interact<br />
freely in an open land and housing market.<br />
So far, the first characteristic has been the<br />
result of data availability considerations and<br />
not of theoretical desirability. The second<br />
assumption reflects both American and<br />
European conditions, but is clearly untenable<br />
for other places such as China or Singapore,<br />
where land availability, land use and household<br />
capital availability are jointly regulated by the<br />
government. In Singapore, for example, the<br />
government controls land use, a vast share<br />
of the property market and pensions through<br />
instruments, such as, government land sales,<br />
Housing and Development Board (HDB) or<br />
Central Provident Fund (CPF) and their various<br />
rules and regulations (Phang 2001).<br />
JOURNEYS | <strong>November</strong> <strong>2011</strong><br />
11
Urban Sustainability and Transportation: Research Framework for Medium and Long Term Transport Planning<br />
The microscopic adaptations of the residents<br />
and firms on exogenous planning scenarios<br />
will be the centre of the work in the longterm<br />
part of the project, as they are generic<br />
in their methodology and transferable to other<br />
locations. The research is organised based on<br />
three main pillars (Figure 4), namely, object fine<br />
location choice, service provider agents and<br />
social network geographies. The forecasting<br />
procedure is based on steps of one year. For<br />
each year, information on exogenous factors,<br />
such as, new property developments, is fed in<br />
the loop whereupon the different agents react.<br />
Based on their reactions, a new state for year<br />
n+1 is computed which serves as the basis for<br />
the next loop run.<br />
The microscopic adaptations of the<br />
residents and firms on exogenous<br />
planning scenarios will be the centre<br />
of the work in the long-term part<br />
of the project, as they are generic in<br />
their methodology and transferable<br />
to other locations.<br />
Figure 4: Overview of Long Term Framework<br />
Location choice<br />
-object-fine<br />
-social network informed<br />
-secondary location choice<br />
Hedonic regressions, facilities database<br />
12 JOURNEYS | <strong>November</strong> <strong>2011</strong><br />
• Advanced Location Choice<br />
Model<br />
Current software systems, such as, MATSim<br />
and UrbanSim (UrbanSim <strong>2011</strong>), and others<br />
as well, are moving from an aggregate<br />
description of the land use system to a<br />
parcel-based one. This has the advantage<br />
that all agents in the simulation correspond<br />
to individual entities: residents, their<br />
households and residences, firms and their<br />
branches, institutions and their locations,<br />
the associated vehicle fleets, transport firms<br />
and their services. This consistency in model<br />
resolution is not matched yet in some of<br />
the behavioural models, most importantly,<br />
residential location choice, activity location<br />
choice, location choice of firms and<br />
institutions.<br />
Service provider agent<br />
-location choice<br />
-choice of location size<br />
-regulations<br />
The current choice models cannot fully<br />
characterise the individual alternatives, as<br />
central variables are missing. The<br />
construction of the very large choice sets<br />
is still computationally very expensive and,<br />
therefore, often not properly addressed.<br />
Initial demand year n +1<br />
Information year n+2<br />
-new housing<br />
-new work places<br />
-new service locations<br />
Processing<br />
Social network<br />
-evolution<br />
-ageing<br />
Analysis,<br />
figures,<br />
evaluation
Urban Sustainability and Transportation: Research Framework for Medium and Long Term Transport Planning<br />
Previous work has served to highlight the<br />
shortcomings and issues, but has not yet<br />
integrated the proposed solutions into a<br />
working system, which is the only way to<br />
verify if the parts work together or if other<br />
solutions have to be found.<br />
The description of the alternatives will<br />
include the usual variables: attributes of<br />
the apartment, accessibility, etc., for the<br />
case of residential location choice, and<br />
generalised cost elements for the given<br />
schedule (including parking variables), store<br />
size brand name, etc., for the activity and<br />
firm location choice. However, to address<br />
the issues of choice set size but also to take<br />
advantage of new available data sources,<br />
the description of the alternatives will have<br />
to be enriched by further elements, such<br />
as, capacity effects, quality of service, price<br />
levels, target markets and brand visibility.<br />
A further strategy to control the size and<br />
actual relevance of the choice set will be<br />
based on existing approaches (Horni et al.<br />
2009, and Scott 2006), to incorporate the<br />
time-space constraints of the schedules<br />
(Hägerstrand 1970). Those approaches<br />
have improved the performance of the<br />
choice models. However, since they still lack<br />
a coherent way to estimate the appropriate<br />
endogenous size of the time-space prisms,<br />
the research will particularly focus on this<br />
problem.<br />
The incorporation of social networks and<br />
analysis of its impact to location choice<br />
problems is a further aspect of the research<br />
and described later in this article.<br />
JOURNEYS | <strong>November</strong> <strong>2011</strong><br />
The construction of the very large<br />
choice sets is still computationally<br />
very expensive and, therefore, often<br />
not properly addressed. Previous<br />
work has served to highlight the<br />
shortcomings and issues, but has not<br />
yet integrated the proposed solutions<br />
into a working system,<br />
• Service Provider Agents<br />
The agent-based models do not model the<br />
choices of the suppliers of these services,<br />
so-called service provider agents, i.e.,<br />
retailers, car sharing companies, restaurant<br />
chains, banks, etc. For a long-term model<br />
of land use and transport at the parcel level,<br />
it is not possible to ignore the moves of the<br />
firms in response to transport and land use<br />
policies.<br />
The design of the agents will be developed<br />
based on a review of the existing<br />
literature about the strategies of the<br />
service providers, so that the scope of the<br />
capabilities is both realistic and appropriate.<br />
In case of retailers, the project can draw<br />
on initial work undertaken at ETH, where<br />
detailed interviews of retailers (Löchl<br />
2010) were undertaken (Arentze and<br />
Timmermans 2007). The design phase will<br />
specify the internal model of agents, which<br />
will be used to adapt their network of<br />
locations, capacities and service/price levels.<br />
While formal optimisation techniques are a<br />
possibility, the preferred approach at this<br />
time is, for example, a guided adaptation<br />
(Ciardi et al. 2008).<br />
13
Urban Sustainability and Transportation: Research Framework for Medium and Long Term Transport Planning<br />
...the design phase needs to be<br />
complemented with local information.<br />
A series of qualitative interviews will<br />
be undertaken with service providers in<br />
the industries of interest. The interview<br />
results will detail the software design<br />
and provide initial estimates for the<br />
necessary parameters...<br />
In addition to the literature review, the<br />
design phase needs to be complemented<br />
with local information. A series of qualitative<br />
interviews will be undertaken with service<br />
providers in the industries of interest. The<br />
interview results will detail the software<br />
design and provide initial estimates for the<br />
necessary parameters (e.g., minimum store<br />
sizes, minimum-maximum catchment areas,<br />
investment costs, labour pool preferences,<br />
etc.).<br />
The software design of the service provider<br />
agent will be rather generic so that the<br />
concept can also be adapted for the medium<br />
term model. In that spirit, agents will be<br />
implemented to manage and optimise, for<br />
example, the taxi fleet.<br />
Following on the design phase, the agents<br />
will be implemented and tested in isolation<br />
to see that the code performs as designed.<br />
The capabilities will include the definition of<br />
chains, the addition and removal of locations,<br />
choice of service and price levels for each<br />
location of a chain. Once the software runs<br />
stable and delivers meaningful results, a joint<br />
test will be performed in order to understand<br />
the interactions better and various future<br />
scenarios will be tested.<br />
14 JOURNEYS | <strong>November</strong> <strong>2011</strong><br />
• Social Networks<br />
As pointed out above, the second element<br />
missing for a destination choice at the<br />
parcel level is the understanding of the<br />
social network structures influencing these<br />
choices. In this context, an original survey<br />
will be undertaken in Singapore to capture<br />
the structure of local social networks and<br />
investigate the impact of social networks in<br />
joint decision-making.<br />
The survey will feature a name generator,<br />
as this methodology has a long history in<br />
sociology (Marsden 1990). However, so far<br />
the geographic spread of the contacts has<br />
normally been omitted or downplayed (Frei<br />
and Axhausen 2007) in such surveys. Recent<br />
work in transportation has three directions:<br />
building models of the dynamics of social<br />
networks, generating spatially distributed<br />
social networks in agent-based simulations<br />
(Hackney 2009) and, finally, capturing the<br />
geography of the social networks (Mok and<br />
Wellman 2007), (Carrasco 2006), (Carrasco<br />
et al. 2008), (van den Berg et al. 2009),<br />
(Frei and Axhausen <strong>2011</strong>b) (Figure 5). While<br />
Axhausen et al. (2006) had focussed on the<br />
interaction with the mobility biography<br />
Most work so far has centred the<br />
social networks on the contacts,<br />
which are relevant for joint leisure,<br />
but has omitted the fact that people<br />
also have attachments to particular<br />
places and firms.<br />
(Lanzendorf 2003), the survey planned<br />
here will combine the capture of the
Urban Sustainability and Transportation: Research Framework for Medium and Long Term Transport Planning<br />
social network with the network of links<br />
and preferences to particular places and<br />
brands. Most work so far has centred the<br />
social networks on the contacts, which are<br />
relevant for joint leisure, but has omitted<br />
the fact that people also have attachments<br />
to particular places and firms.<br />
The survey will be conducted as an egocentric<br />
survey of contacts with whom the<br />
respondents spend their leisure time and<br />
fulfil the priority of obtaining a general<br />
and broad understanding of the network<br />
geographies. Special care will be taken to<br />
involve both citizens and foreign residents<br />
to get as complete an overview as possible.<br />
The survey will give insights, as discussed<br />
above, in the number and geography of<br />
social networks of the Singapore residents<br />
and of the frequency of their interactions.<br />
The uses of ‘clique’, an item tested in<br />
the current work at ETH Zurich (Kowald<br />
and Axhausen 2010), will allow us to<br />
characterise the internal structure of the<br />
Figure 5: Residential locations of the respondents (Zurich only)<br />
and acquaintances, as reported in Frei and Axhausen (<strong>2011</strong>b)<br />
JOURNEYS | <strong>November</strong> <strong>2011</strong><br />
networks in a first approximation. The<br />
information about the place and<br />
firm attachments complements the social<br />
geography. Information about the mobility<br />
biography will place the current situation<br />
into the biographical context of the<br />
respondents.<br />
Implication Of Social Network<br />
On Location Choice<br />
The survey results will allow to do two<br />
things, firstly, generalise the social networks<br />
to the population as a whole (Arentze and<br />
Timmermans 2006), (Hackney and Marchal<br />
2008), (Frei and Axhausen <strong>2011</strong>b), (Arentze,<br />
Kowald and Axhausen <strong>2011</strong>) by linking the<br />
agents via a probabilistic model, and secondly,<br />
establish new model structures to capture joint<br />
decision-making in destination choice (Frei and<br />
Axhausen <strong>2011</strong>a).<br />
Based on the substantial literature on joint<br />
household decision-making in transport<br />
(Zhang et al. 2007) and on-going work within<br />
the SustainCity project (SustainCity <strong>2011</strong>),<br />
suitable model structures will be developed<br />
to capture the joint choice of locations within<br />
social networks, in particular, for leisure<br />
The survey will be conducted as an<br />
ego-centric survey of contacts with<br />
whom the respondents spend their<br />
leisure time and fulfil the priority<br />
of obtaining a general and broad<br />
understanding of the network<br />
geographies. Special care will be<br />
taken to involve both citizens and<br />
foreign residents to get as complete<br />
an overview as possible.<br />
15
Urban Sustainability and Transportation: Research Framework for Medium and Long Term Transport Planning<br />
activities. The challenge will be to integrate this<br />
within the MATSim approach of modelling the<br />
whole daily schedule. The interaction of the<br />
joint choice on the then partially coordinated<br />
schedules will be the focus of the work. It is<br />
open at this point whether the most productive<br />
path will be a joint optimisation/satisfaction<br />
approach or an explicit discrete choice model.<br />
Both options will have to be explored and<br />
tested.<br />
Key Impacts And Outlook<br />
The integration of the two time horizons,<br />
m e d i u m a n d l o n g , is a s i g n i f i c a n t<br />
methodological innovation that will enable<br />
a global analysis of complex issues related to<br />
mobility in the future, as the various modules<br />
of the system can be integrated as the issue<br />
concerned requires. Hence, this framework<br />
allows large-scale policy tests for various<br />
temporal dimensions. However, the system<br />
will be first explicitly tested for stability of<br />
the simulation results, multiple equilibria and<br />
heterogeneous demand- and supply-side<br />
agents.<br />
The integration of the two time<br />
horizons, medium and long, is<br />
a significant methodological<br />
innovation that will enable a global<br />
analysis of complex issues related<br />
to mobility in the future, as the<br />
various modules of the system<br />
can be integrated as the issue<br />
concerned requires.<br />
16 JOURNEYS | <strong>November</strong> <strong>2011</strong><br />
From a medium-term horizon, the generalised<br />
costs of moving persons, goods and<br />
information can be derived from the new<br />
framework. Policymaking is interested in<br />
lowering these generalised costs of movement<br />
as these induce more efficient labour and<br />
goods markets. Policymaking also requires a<br />
detailed account of the winners and losers of<br />
any change in the supply, regulation and costs<br />
of transport infrastructure and services. The<br />
proposed framework targets in this direction<br />
and allows, due to the highly disaggregated<br />
approach, detailed analysis of winners and<br />
losers of change, either in infrastructure or<br />
policy.<br />
For policymaking over time horizons of several<br />
years, an account of the daily flows and the<br />
form and structure of the urban environment<br />
is needed. The development of a spatially<br />
detailed, path-oriented, land-use aware<br />
transport model for Singapore will provide<br />
new insight into the possible risks and benefits<br />
of different policies.<br />
The p r o j e c t will p u b l i s h its results<br />
t h r o u g h appropriate working papers<br />
on the Future Cities Laboratory website<br />
(www.futurecities.ethz.ch), peer-reviewed<br />
journals, and supplement this with papers and<br />
presentations at peer-reviewed, as well as,<br />
professional conferences. The code written will<br />
be licensed as GNU public licence and where<br />
appropriate, it will become part of the then<br />
current MATSim release.
References<br />
Urban Sustainability and Transportation: Research Framework for Medium and Long Term Transport Planning<br />
Acknowledgement<br />
The authors thank National Research Foundation of Singapore which is funding this research programme, and the Future<br />
Cities Laboratory as part of the CREATE initiative. Furthermore, we are grateful to the numerous data providers, especially<br />
Land Transport Authority of Singapore, Urban Redevelopment Authority, Singapore Land Authority, SingStat, and Housing<br />
Development Board, to name a few. Finally, we appreciate the collaboration with the colleagues from Future Urban<br />
Mobility, MIT SMART and from TUM CREATE.<br />
Arentze, T. A. and H. J. P. Timmermans. 2006. A new<br />
theory of dynamic activity generation. Paper presented at<br />
the 85th Annual Meeting of the Transportation Research<br />
Board. Washington, D.C., USA.<br />
Arentze, T. A. and H. J. P. Timmermans. 2007. A multiagent<br />
activity-based model of facility location choice and<br />
use. Transportation Research Record 43 (3): 33–44.<br />
Arentze, T.A., M. Kowald and K.W. Axhausen. <strong>2011</strong>. A<br />
Method to Model Population-Wide Social Networks for<br />
Large Scale Activity-Travel Micro-Simulation, Working<br />
Paper, 698, IVT, ETH Zurich, Zurich, Switzerland.<br />
Axhausen, K. W. 2006. Moving through nets: An<br />
introduction, ed. K. W. Axhausen. Moving Through Nets:<br />
The Physical and Social Dimensions of Travel: 1–7, Elsevier,<br />
Oxford, UK.<br />
Axhausen, K. W., A. Frei and T. Ohnmacht. 2006.<br />
Networks, biographies and travel: First empirical and<br />
methodological results. Paper presented at the 11th<br />
International Conference on Travel Behaviour Research<br />
(IATBR). Kyoto, Japan.<br />
Balmer, M., K. Meister, R. A.Waraich, A. Horni, F. Ciari<br />
and K.W. Axhausen. 2010. Agentenbasierte Simulation<br />
für location based services, Final Report, F&E Förderung:<br />
Science to Market: KTI 8443.1 ESPP-ES, Datapuls AG, IVT,<br />
ETH Zurich, Zurich, Switzerland.<br />
Bradley, M. A. and J. L. Bowman. 2006. Design features<br />
of activity-based microsimulation models for U.S.<br />
metropolitan planning organizations. Paper presented<br />
at the Innovations in Travel Demand Modeling (ITM’06).<br />
Austin, USA.<br />
Carrasco, J. A. 2006. Social activity-travel behaviour:<br />
A personal networks approach. Ph.D. Thesis, Toronto:<br />
University of Toronto, Canada.<br />
Carrasco, J. A., B. Hogan, B.Wellman and E. J. Miller.<br />
2008. Collecting social network data to study social<br />
activity-travel behavior: An ego-centered approach,<br />
Environment and Planning B 36 (6): 961–980.<br />
Ciari, F., M. Löchl and K.W. Axhausen. 2008. Location<br />
decisions of retailers: An agent-based approach. Paper<br />
presented at the International Conference on Recent<br />
Advances in Retailing and Services Science. Zagreb,<br />
Croatia.<br />
Daganzo, C. F. 2006. Bus lanes with intermittent priority:<br />
Strategy formulae and an evaluation, Transportation<br />
Research Part B 40 (9): 731–744.<br />
Daganzo, C. F. 2008. A headway-based approach<br />
to eliminate bus bunching: Systematic analysis and<br />
comparisons, Transportation Research Part B 43 (10):<br />
913–921.<br />
Daganzo, C. F. 2010. Struture of competitive transit<br />
networks, Transportation Research Part B 44 (4):<br />
434–446.<br />
Feil, M. 2010. Choosing the daily schedule: Expanding<br />
activity-based travel demand modeling. Ph.D. Thesis,<br />
Zurich: ETH Zurich, Switzerland.<br />
Fletterman, M. 2008. Designing Multimodal Public<br />
Transport Networks Using Metaheuristics, Master Thesis,<br />
Faculty of Engineering, Built Technology and Information<br />
Technology. University of Pretoria, Pretoria, South Africa.<br />
Frei, A. and K.W. Axhausen. 2007. Size and structure of<br />
social network geographies, Working Paper, 444, IVT, ETH<br />
Zurich, Zurich, Switzerland.<br />
Frei, A. and K. W. Axhausen. <strong>2011</strong>a. Collective location<br />
choice model, Working Paper, 686, IVT, ETH Zurich,<br />
Zurich, Switzerland.<br />
Frei, A. and K. W. Axhausen. <strong>2011</strong>b. Modeling spatial<br />
embedded social network, Working Paper, 685, IVT, ETH<br />
Zurich, Zurich, Switzerland.<br />
Hackney, J. K. (2009) Integration of social networks in a<br />
large-scale travel behavior microsimulation. Ph.D. Thesis,<br />
ETH Zurich, Zurich, Switzerland.<br />
Hackney, J. K. and F. Marchal. 2008. A model for coupling<br />
multi-agent social interactions and traffic simulation,<br />
Working Paper, 516, IVT, ETH Zurich, Zurich, Switzerland.<br />
JOURNEYS | <strong>November</strong> <strong>2011</strong><br />
17
Urban Sustainability and Transportation: Research Framework for Medium and Long Term Transport Planning<br />
References<br />
Hägerstrand, T. 1970. What about people in regional<br />
science?, Papers of the Regional Science Association 24<br />
(1): 7–21.<br />
Horni, A., D. M. Scott, M. Balmer and K. W. Axhausen.<br />
2009. Location choice modeling for shopping and leisure<br />
activities with MATSim: Combining micro-simulation and<br />
time geography, Transportation Research Record, 2135:<br />
87–95.<br />
Institute of Transportation Studies (ITS). 2010. Using ITS<br />
research, Barcelona relaeses new BRT network, press<br />
release. http://its.berkeley.edu/btl/2010/spring/Barcelona-<br />
BRT.<br />
Jones, P. M., M. C. Dix, M. I. Clarke and I. G. Heggie.<br />
1983. Understanding Travel Behaviour, Gower, Aldershot.<br />
Kowald, M. and K. W. Axhausen. 2010. Spatial<br />
distribution of connected leisure networks: Selected<br />
results from a snowball sample, Working Paper, 614, IVT,<br />
ETH Zurich, Zurich, Switzerland.<br />
Lämmel, G. and G. Flötteröd. 2009. Towards system<br />
optimum: Time-dependent networks for large-scale<br />
evacuation problems, in B. Mertsching, M. Hund and<br />
Z. Aziz (eds.) KI 2009: Advances in Artificial Intelligence<br />
- 32nd Annual German Conference on AI, Paderborn,<br />
Germany, September 15-18, 2009, Proceedings,<br />
532–539, Springer, Berlin, Germany<br />
Lanzendorf, M. 2003. Mobility biographies: A new<br />
perspective for understanding travel behaviour. Paper<br />
presented at the 10th International Conference on Travel<br />
Behaviour Research (IATBR). Lucerne, Switzerland.<br />
Löchl, M. 2010. Application of spatial analysis methods<br />
for understanding geographic variation of prices. Ph.D.<br />
Thesis, ETH Zurich, Switzerland.<br />
Marsden, G. 1990. Networks: Data and measurement,<br />
Annual Review of Sociology 16: 435–463.<br />
MATSim-T .<strong>2011</strong>. Multi Agent Transportation Simulation<br />
Toolkit. http://www.matsim.org.<br />
Mezdani, Y. <strong>2011</strong>. Optimal tolls based on an agent-based<br />
model of travel demand. Master Thesis, TRANSP-OR, EPF<br />
Lausanne, Lausanne, Switzerland.<br />
Mok, D. and B. Wellman. 2007. Did distance matter<br />
before the internet?, Social Networks 29 (3): 430–461.<br />
Nagel, K., and Flötteröd, G. 2009. Agent-based traffic<br />
assignment: going from trips to behavioral travelers.<br />
Paper presented at the 12th International Conference on<br />
Travel Behaviour Research (IATBR), Jaipur, India.<br />
18 JOURNEYS | <strong>November</strong> <strong>2011</strong><br />
Osorio, C. 2010. Mitigating network congestion :<br />
analytical models, optimization methods and their<br />
applications. Ph.D. Thesis, EPF Lausanne, Lausanne,<br />
Switzerland.<br />
Phang, S.-Y. 2001. Housing policy, wealth formation<br />
and the Singapore economy, Housing Studies 16 (4):<br />
443–459.<br />
Scott, D. M. 2006. Constrained destination choice set<br />
generation: A comparison of GIS-based approaches.<br />
Paper presented at the 85th Annual Meeting of the<br />
Transportation Research Board. Washington, D.C., USA.<br />
Stadtbauswesen und Strassenverkehr (ISB) and University<br />
of Bamberg, Insitute for Theoretical Psychology and<br />
German Aerospace Center (DLR), German Aerospace<br />
Centre, Institute of Transport Research and University<br />
of Wuppertal, LUIS – Lehr- und Forschungsgebiet<br />
Umweltverträgliche Infrastrukturplanung, Berlin,<br />
Germany.<br />
SustainCity. <strong>2011</strong>. The SustainCity project.<br />
http://www.sustaincity.org.<br />
Tirachini, A. and D. A. Hensher. <strong>2011</strong>. The identification<br />
of factors influencing destination choice: An application<br />
of the repertory grid methodology, Transportation<br />
Research Part B: Methodological 45 (5): 828–844.<br />
UN. 2007. State of the world population 2007 -<br />
unleashing the potential of urban growth, Technical<br />
Report, United Nations Populations Funds, New York,<br />
USA.<br />
UrbanSim. <strong>2011</strong>. Open Platform for Urban Simulation.<br />
http://www. urbansim.org.<br />
Van den Berg, P., T. A. Arentze and H. J. P. Timmermans.<br />
2009. Size and composition of ego-centered social<br />
networks and their effect on travel distance and contact<br />
frequency. Paper presented at the 88th Annual Meeting<br />
of the Transportation Research Board. Washington, D.C.,<br />
USA.<br />
Zhang, J., H. J. P. Timmermans and A. W. J. Borgers.<br />
2007. Utility-maximizing model of household time<br />
use for independent, shared, and allocated activities<br />
incorporating group decision mechanisms, Transportation<br />
Research Record 1807: 1–8.
Urban Sustainability and Transportation: Research Framework for Medium and Long Term Transport Planning<br />
K.W. Axhausen is Professor of Transport Planning at the ETH Zürich.<br />
Prior to this, he worked at the Leopold-Franzens Universität, Innsbruck,<br />
Imperial College London, the University of Oxford and the Universität<br />
Karlsruhe. He has been involved in the measurement and modelling<br />
of travel behaviour for the last 25 years, contributing especially to the<br />
literature on stated preferences, micro-simulation of travel behaviour,<br />
valuation of travel time and its components, parking behaviour, activity<br />
scheduling and travel diary data collection. His current work focuses on<br />
the agent-based micro-simulation toolkit MATSim (see www.matsim.org) and on the land-use/<br />
transport interaction.<br />
Alex Erath is currently senior researcher and research module<br />
coordinator at the Future Cities Laboratory. He obtained his PhD<br />
from the Swiss Federal Institute of Technology ETH where he studied<br />
the vulnerability of transport infrastructure. He was also involved<br />
in various projects focusing on measuring and modelling transport<br />
related decision processes. His MSc. thesis in Civil Engineering at<br />
ETH on shopping location choice was awarded with the VSS price<br />
for the best thesis in Road and Transportation research.<br />
JOURNEYS | <strong>November</strong> <strong>2011</strong><br />
19
Transport Mobility Management: Small Changes - Big Impacts<br />
Transport Mobility Management: Small<br />
Changes - Big Impacts<br />
Understanding TMM in the Urban Context<br />
Damian PRICE and Amy LEATHER<br />
Abstract<br />
Although Transport Mobility Management (TMM) is still considered a relatively new<br />
element of the transport practitioner’s toolbox, it is increasingly being adopted by<br />
governments and city planners as a dynamic approach that can support a wide range<br />
of environmental, economic and social goals. This paper presents three examples of<br />
international best practices in TMM and examines their success in the implementation of<br />
a variety of measures and initiatives. It argues that the more successful TMM initiatives<br />
are those that are embedded in the wider transport approach of a government, authority<br />
or service provider. It goes on to identify the top ten factors for success that should be<br />
considered when taking forward TMM.<br />
What is Transport Mobility<br />
Management?<br />
Transport Mobility Management (also known<br />
as Transport or Travel Demand Management)<br />
has been a key tool in transport planning since<br />
the early 1990s. The idea that the demand<br />
for transport could and indeed should be<br />
managed marked a shift in attitude from the<br />
earlier ‘predict and provide’ approach, where<br />
future transport demand was predicted and<br />
the necessary infrastructure was provided.<br />
At the core of its definition is the ability to<br />
influence travel behaviour and shift travel<br />
activity to achieve a desired site or location<br />
specific objective. This could be a reduction<br />
in car use to ease congestion and improve<br />
journey times along a particular route, or an<br />
increase in the use of a particular mode of<br />
transport to support its operation. A study<br />
carried out by the European Union defines<br />
mobility management as follows:<br />
20 JOURNEYS | <strong>November</strong> <strong>2011</strong><br />
management is primarily a<br />
demand-oriented ‘‘Mobility approach to transport<br />
that involves new partnerships and a set of<br />
tools to support and encourage change of<br />
attitude and behaviour towards sustainable<br />
modes of transport. These tools are usually<br />
based on information and organisation,<br />
coordination and require promotion.<br />
Mobility management addresses specific<br />
target groups and has developed a range of<br />
instruments, best known are the mobility centre<br />
and the mobility plan. Mobility management is<br />
a constant process of development<br />
”<br />
Source: European projects,<br />
MOSAIC and MOMENTUM<br />
The phrases in bold are at the heart of the<br />
mobility management approach. The set of<br />
tools that can be used as part of an overall<br />
TMM strategy are wide-ranging. The crucial<br />
issue is that ‘hard’ infrastructure measures
The idea that the demand for transport<br />
could and indeed should be managed<br />
marked a shift in attitude from the<br />
earlier ‘predict and provide’ approach,<br />
where future transport demand<br />
was predictedand the necessary<br />
infrastructure was provided.<br />
are supported by ‘soft’ measures that include<br />
engagement, marketing, and information<br />
provision. These ‘soft’ measures are<br />
the elements that make TMM distinctive<br />
from traditional forms of transport planning;<br />
they complement and reinforce the ‘hard’<br />
infrastructure measures, thus maximising the<br />
potential impact. Table 1 shows the various<br />
TMM strategies that can be adopted and<br />
examples of corresponding hard and soft<br />
measures that can be implemented. Some of<br />
these measures can be adopted at the city<br />
level, for example, the provision of a new bus<br />
route; whilst others can be adopted at a site<br />
specific level, for example, limiting the car<br />
parking availability at a particular organisation.<br />
Today, an increasingly multi-disciplinary<br />
approach is being taken to transport planning,<br />
where it is recognised that the application<br />
of mobility management principles can<br />
successfully support not only environmental<br />
goals by encouraging the use of more<br />
sustainable goals of travel, but also a wide<br />
range of land use planning, economic and<br />
social goals.<br />
Mobility Management in Practice<br />
To date, governments in the UK, USA, Europe<br />
Transport Mobility Management: Small Changes - Big Impacts<br />
and Australia have been the most proactive<br />
in adopting and applying TMM tools and<br />
strategies. Generally, the key objectives<br />
have been to reduce traffic congestion and<br />
associated negative effects, such as increased<br />
journey times, and to achieve a shift in travel<br />
behaviour towards the use of more sustainable<br />
modes. Two established examples of best<br />
practices in TMM in the UK and Ireland are<br />
discussed below, followed by the example of<br />
Abu Dhabi, which is currently developing its<br />
own comprehensive TMM strategy.<br />
London Borough of Sutton, UK<br />
The application of TMM measures at a small<br />
scale can still be highly effective in achieving<br />
sustained changes to travel behaviour. The<br />
Smarter Travel Sutton project was launched<br />
in 2006 as a three year, £5m scheme, to<br />
introduce measures and initiatives that would<br />
encourage sustainable travel behaviour. The<br />
project focused on soft measures, such as,<br />
the provision of travel information, marketing<br />
and promotion, rather than installing new<br />
infrastructure. The key measures adopted and<br />
their achievements are shown in Table 2.<br />
JOURNEYS | <strong>November</strong> <strong>2011</strong><br />
The Smarter Travel Sutton project<br />
was launched in 2006 as a three year,<br />
£5m scheme, to introduce measures<br />
and initiatives that would encourage<br />
sustainable travel behaviour.<br />
Project planning took place as part of an annual<br />
cycle of activities, with a feedback loop built into<br />
the process to ensure that lessons were learnt and<br />
continual improvements were made. Figure 1<br />
illustrates the annual cycle of phased activity.<br />
21
Transport Mobility Management: Small Changes - Big Impacts<br />
Table 1: The Transport Mobility Management Toolkit<br />
TMM Tools Hard Measures Soft Measures<br />
Provision of improved<br />
travel options<br />
Incentives to use more<br />
sustainable modes /<br />
disincentives to travel<br />
by car<br />
Land use<br />
management<br />
Policy and institutional<br />
reform<br />
Marketing, awareness,<br />
promotion and<br />
engagement<br />
Travel reduction<br />
initiatives<br />
• New public transport routes /<br />
services<br />
• Private shuttle buses for<br />
employers<br />
• Dedicated cycle lanes and other<br />
cycling support facilities<br />
• Improved pedestrian footways<br />
and other walking support<br />
facilities<br />
• Reduce availability of car<br />
parking spaces<br />
• High Occupancy Vehicle priority<br />
• Provision of cycle parking<br />
• Transit Oriented Developments<br />
• Streetscape improvements, e.g.,<br />
pedestrianisation<br />
Implementation Tools • Workplace TMM plans<br />
• School TMM Plans<br />
• Visitor TMM Plans<br />
• Residential TMM Plans<br />
• Personal TMM Plans<br />
22 JOURNEYS | <strong>November</strong> <strong>2011</strong><br />
• Provision of travel information, e.g.,<br />
route maps which show safe walking<br />
and cycling routes<br />
• Implementation of a car sharing<br />
database<br />
• Cycle training<br />
• Cycle training<br />
• Discounted tickets for use on public<br />
transport services<br />
• Parking pricing strategies<br />
N.A. • Requirement for site specific<br />
TMM plans to be prepared and<br />
implemented for new developments<br />
• Policy changes to encourage<br />
transport service competition and<br />
efficiency<br />
• Integration of land use and transport<br />
planning agencies<br />
N.A. • Special events, e.g., ‘Walk to Work<br />
on Wednesday’ and ‘In Town<br />
Without My Car Day’<br />
• Branding, e.g., logos<br />
• Provision of travel information, e.g.,<br />
on company websites<br />
• Social marketing campaigns<br />
• Promotional initiatives to support<br />
new / existing specific elements of<br />
TMM<br />
N.A. • Flexible working, smarter working<br />
methods, e.g., working from home,<br />
compressed working hours<br />
N.A.
Table 2: Key Measures Adopted in the Smarter Travel Sutton Project<br />
Initiative Key Achievements<br />
Workplace travel planning – support and<br />
advice offered to larger employers to assist<br />
them in the development and implementation<br />
of their own travel plan<br />
School travel planning – each school<br />
was offered support and advice in the<br />
development and implementation of their<br />
own travel plan<br />
Personalised travel planning – every<br />
household was offered tailored travel<br />
information and incentives to use appropriate<br />
sustainable modes. Residents were also<br />
targeted through doctor referrals<br />
Car clubs – on-street vehicles that can be<br />
booked in advance and rented out by the<br />
hour by car club members<br />
Promotion of cycling – provision of cycle<br />
training, additional on-street cycle parking<br />
spaces, themed events<br />
Marketing, awareness and promotions –<br />
major festivals, events and roadshows, direct<br />
marketing campaigns, incentives and rewards<br />
The case study of Sutton offers some<br />
interesting and useful lessons in behaviour<br />
change that should be considered in the future<br />
application of TMM. Although the project has<br />
achieved measureable success, the adoption of<br />
some behavioural change theories could have<br />
increased the level of effectiveness of the overall<br />
approach taken. The Diffusion of Innovation<br />
Transport Mobility Management: Small Changes - Big Impacts<br />
• All major employers engaged; 16,000<br />
employees covered<br />
• Average 2% reduction in car use for work<br />
trips<br />
• First London Borough with 100% school<br />
travel plan coverage<br />
• Average 5% point reduction in car use<br />
for trips to school (some schools achieved<br />
reductions as high as 17%)<br />
• 52% of the participants who participated<br />
in the doctor referral scheme reported<br />
reducing their car use<br />
• 300 car club members and 16 vehicles in<br />
the scheme<br />
• Average utilisation equates to six hours per<br />
day per car<br />
• 50% increase in the number of recorded<br />
cycle trips compared to stable levels across<br />
other outer London Boroughs<br />
• Increase in awareness of available<br />
alternative travel modes<br />
• Contribution to mode shift results, e.g.,<br />
13% growth in the number of bus<br />
passengers in the borough compared to a<br />
9% increase in an adjoining borough<br />
model explains how a new technology or<br />
idea becomes adopted by a population.<br />
Those people who are first to adopt the new<br />
technology or idea are described as Innovators,<br />
followed by Early Adopters, Early Majority, Late<br />
Majority and Laggards. They can be arranged<br />
linearly on a bell curve as shown in Figure 2.<br />
JOURNEYS | <strong>November</strong> <strong>2011</strong><br />
23
Transport Mobility Management: Small Changes - Big Impacts<br />
Although the project has achieved<br />
measureable success, the adoption<br />
of some behavioural change<br />
theories could have increased the<br />
level of effectiveness of the overall<br />
approach taken.<br />
Although one of the key objectives of the<br />
project was to target the Early Adopters and<br />
the Early Majority through the initiatives set out<br />
in Figure 2, it may have been more effective<br />
if baseline consumer research was carried out<br />
into the characteristics of these Early Adopters.<br />
In addition, for some of the key measures,<br />
such as, the promotion of cycling and the<br />
introduction of car clubs, it may have been<br />
more effective to focus on the likely Innovators,<br />
given that relatively few people in Sutton were<br />
using these modes at the outset of the project.<br />
Smarter Travel Ireland<br />
In some cases, the move towards the<br />
application of TMM is facilitated by the<br />
24 JOURNEYS | <strong>November</strong> <strong>2011</strong><br />
Figure 1: Sutton Smarter Travel Project Delivery Cycle (Source:<br />
‘Smarter Travel Sutton: Lessons Learnt in the Delivery of a Behaviour<br />
Change Programme, Summary Report,’ <strong>November</strong> 2009).<br />
introduction of an overarching national policy<br />
on sustainable travel. In the case of Ireland,<br />
it was the adoption in 2009 of the ‘Smarter<br />
Travel: A Sustainable Transport Future’ strategy<br />
published by the Irish National Government<br />
that led to increased investment and interest in<br />
the promotion of sustainable modes of travel.<br />
Figure 2: Diffusion of Innovation Model (Source: ‘Smarter Travel Sutton: Lessons Learnt in the Delivery of a Behaviour Change<br />
Programme, Summary Report,’ <strong>November</strong> 2009).<br />
Innovators<br />
2.5%<br />
Early<br />
Adopters<br />
13.5%<br />
Early<br />
Majority<br />
34%<br />
Late<br />
Majority<br />
34%<br />
Reporting<br />
dissemination<br />
and<br />
improvement<br />
Monitoring<br />
and evaluation<br />
Laggards<br />
16%<br />
Strategy<br />
development<br />
Project<br />
management<br />
and staff<br />
management<br />
100<br />
75<br />
50<br />
25<br />
0<br />
Markets Share %<br />
Forward<br />
planning<br />
programme<br />
and budget<br />
forecast<br />
Programme<br />
and budget<br />
management
As resources to implement such policy<br />
initiatives are limited, one of the key initiatives<br />
developed by the Irish Government in support<br />
of the Smarter Travel strategy is a national<br />
funding competition that was established to<br />
deliver outstanding and innovative examples<br />
of sustainable travel in areas across Ireland.<br />
Local governments are required to develop<br />
an appropriate package of measures and<br />
demonstrate adequate stakeholder support for<br />
such measures. Such a competition means that<br />
only those strategies and measures considered<br />
to be most effective are funded.<br />
One of the 11 shortlisted Stage 1 applicants<br />
that were invited to progress to Stage 2<br />
is Limerick City Council. Limerick and the<br />
other shortlisted applicants competed for<br />
funding of up to £50m over five years to<br />
transform them into world class Smarter Travel<br />
demonstration zones. Limerick City Council’s<br />
overarching programme contains four separate<br />
geographical areas of focus, each with their<br />
own distinct target groups:<br />
1. City Centre – employees;<br />
2. Southill – regeneration;<br />
3. Corbally – residential; and<br />
4. Castletroy / University – mixed use.<br />
Specific initiatives and campaigns were<br />
developed for each target group or hub, which<br />
sat underneath the over-arching, area wide<br />
TMM programme. Thus, the local authority<br />
had the ability to amend or ‘tweak’ its TMM<br />
approach in order to engage more appropriately<br />
with relevant target groups. These hubs are<br />
the key local trip attractors and generators in<br />
Limerick and therefore form a suitable basis for<br />
the development of smarter travel initiatives. It<br />
Transport Mobility Management: Small Changes - Big Impacts<br />
is proposed that local champions be designated<br />
for each hub, who will provide a recognisable<br />
‘face’ behind the initiative and help to achieve<br />
maximum levels of public awareness and also<br />
local ownership. Each hub will be the focus of<br />
a number of initiatives, summarised in Table 3 .<br />
JOURNEYS | <strong>November</strong> <strong>2011</strong><br />
In some cases, the move towards the<br />
application of TMM is facilitated by<br />
the introduction of an overarching<br />
national policy on sustainable travel.<br />
One of the key factors in Limerick’s successful<br />
bid was that it demonstrated a high level of<br />
political and stakeholder support for the<br />
measures it proposed. Limerick City Council<br />
and Limerick County Council worked together<br />
in partnership with the University of Limerick<br />
to develop the overarching programme. In<br />
addition, the measures proposed not only<br />
encourage sustainable travel, but also a shift<br />
to more healthy and sustainable lifestyles.<br />
One of the key factors in Limerick’s<br />
successful bid was that it demonstrated<br />
a high level of political and stakeholder<br />
support for the measures it proposed.<br />
Implementation of TMM in<br />
Abu Dhabi<br />
The Emirate of Abu Dhabi took the decision to<br />
develop a TMM strategy as part of its Surface<br />
Transport Master Plan process in 2008. The<br />
Emirate is experiencing significant changes; a<br />
potential trebling of the population by 2030<br />
and extensive plans for the development of<br />
public transport. Prior to 2007 there were few<br />
25
Transport Mobility Management: Small Changes - Big Impacts<br />
Table 3: Overview of Measures Proposed as Part of Limerick City Council’s Smarter Travel Bid<br />
Measures<br />
Cycling / Walking • New cycle lanes and walkways.<br />
• Installation of Advanced Stop Lines (ASLs) for cyclists at traffic signal<br />
junctions<br />
• New covered cycle parking<br />
• Adult cycle training lessons<br />
• Provision of bike racks on local bus services<br />
Travel Planning • Appointment of Mobility Co-Ordinator<br />
• Employer Travel Plan Networks<br />
• School / residential / student / station travel planning<br />
• Car sharing management tool<br />
Research and Marketing • Local campaigns and events to support the use of particular modes<br />
e.g. electric vehicles<br />
• GIS mapping of commuters<br />
Policy Changes • Introduction of thresholds for travel planning into local policy<br />
• Park and Ride scheme<br />
• Real time bus information<br />
• Parking regulations<br />
• Parking management<br />
• Speed limit changes<br />
or no alternatives to the private car. The newly<br />
developed bus network already experiences<br />
significant demand and there are plans to<br />
The Emirate is experiencing significant<br />
changes; a potential trebling of the<br />
population by 2030 and extensive plans<br />
for the development of public transport.<br />
supplement this with a light rail system and a<br />
metro system. Despite the economic downturn<br />
of 2009, there is still considerable development<br />
taking place across the Emirate; most markedly<br />
within the city centre.<br />
TMM development began in January <strong>2011</strong> and<br />
is scheduled for completion at the end of the<br />
year. Core elements of the Abu Dhabi TMM<br />
approach include:<br />
26 JOURNEYS | <strong>November</strong> <strong>2011</strong><br />
• A review of wider transport activity to<br />
understand how and where TMM can fit into<br />
the ongoing development of the transport<br />
network;<br />
• A review of international best practices in<br />
TMM to understand the strategies and tools<br />
that work well and those that don’t;<br />
• Pilot TMM plans at a range of sites across the<br />
Emirate, including workplaces, schools and<br />
visitor attractions;<br />
• The development of various surveying tools<br />
that will facilitate the adoption of a robust,<br />
standardised approach to monitoring that<br />
will substantiate further development of<br />
TMM;<br />
• Modelling and quantitative assessment, to<br />
better understand the potential impacts<br />
of TMM on congestion, trip numbers and<br />
carbon emissions;
• The development of a brand for TMM in<br />
Abu Dhabi and an associated marketing<br />
programme;<br />
• Identification of the legislative and policy<br />
changes needed to support TMM;<br />
• Guidance on the incorporation of TMM in the<br />
development process;<br />
• The d e v e l o p m e n t of a short-term<br />
implementation programme and action plan;<br />
• The preparation of a TMM Toolkit that<br />
organisations can use in taking forward their<br />
own TMM plans; and<br />
• An overarching TMM strategy that sets out<br />
how the concept can be moved forward.<br />
This programme is the most ambitious<br />
application of TMM in the region. As it is also a<br />
relatively new concept, a number of challenges<br />
have arisen. A summary of the key issues that<br />
the TMM programme has needed to address is<br />
provided in Table 4.<br />
Table 4: Core Challenges for TMM in Abu Dhabi<br />
Transport Mobility Management: Small Changes - Big Impacts<br />
Critical Factors for Success<br />
Whilst TMM is still considered a relatively<br />
new element of the transport practitioner’s<br />
toolbox, the examples cited above are part of<br />
a growing evidence base of TMM approaches<br />
and applications across the world. The more<br />
successful TMM initiatives are those that are<br />
embedded in the wider transport approach of<br />
a government, authority or service provider.<br />
TMM is not a stand alone concept; it is a<br />
dynamic approach that can maximise the<br />
potential of new and existing infrastructure<br />
and policy (Table 5).<br />
Challenge Approach Taken to Address Challenge<br />
1. A lack of awareness of<br />
TMM<br />
2. The view that TMM is<br />
solely a European / USA<br />
concept<br />
3. The need to understand<br />
the potential Abu Dhabi<br />
specific benefits of TMM<br />
4. The need to quantify the<br />
potential benefits<br />
5. A lack of TMM skills<br />
and experience that<br />
are needed to ensure<br />
momentum is maintained<br />
An extensive stakeholder engagement programme to inform<br />
and secure buy-in<br />
The need to keep driving home the message that TMM is<br />
about delivering site specific / locally appropriate initiatives<br />
that meet the needs of local users.<br />
Close engagement with pilot organisation to assess the role<br />
that TMM can play and where the benefits lie. The key output<br />
was that TMM will play a useful role in the Corporate and<br />
Social Responsibility agenda.<br />
An impacts assessment undertaken to show the potential<br />
benefits. This, along with the use of international best<br />
practice examples helps to facilitate the roll out of the TMM<br />
programme.<br />
Whilst TMM is not an expensive initiative in comparison to<br />
new infrastructure projects, it is labour intensive. It requires<br />
ongoing input from those that understand TMM to upskill<br />
new individuals and organisations. This can be done quite<br />
quickly but cannot be ignored.<br />
JOURNEYS | <strong>November</strong> <strong>2011</strong><br />
TMM is not a stand alone concept;<br />
it is a dynamic approach that can<br />
maximise the potential of new and<br />
existing infrastructure and policy.<br />
27
Transport Mobility Management: Small Changes - Big Impacts<br />
Table 5: Top Ten TMM Measures for Success<br />
Top Ten TMM Measures for Success: These factors are by no means exhaustive.<br />
However, they do provide a useful core checklist that can contribute to the successful<br />
implementation of TMM.<br />
1. A National Approach TMM needs to be defined at the national level, with a consistent<br />
approach adopted countrywide. This is not to say that initiatives<br />
need to be on a national scale. However, the core TMM objective<br />
and philosophy needs to be set out at the highest level.<br />
2. Integration with<br />
Land Use Planning<br />
and Wider Policy<br />
3. Incorporation into<br />
the Development<br />
Process<br />
4. High Level<br />
Commitment<br />
5. A Robust Stakeholder<br />
Engagement<br />
Approach<br />
6. Pilot Studies to<br />
Gather Evidence of<br />
Success<br />
TMM is not a stand alone element of transport planning. Our<br />
earlier examples highlight how the impact of TMM measures can<br />
be increased when incorporated into wider planning and transport<br />
impacts. When any transport or planning decision is being made,<br />
the question should be asked, ‘What is the role of TMM in this?’<br />
TMM can have the biggest impact when incorporated into new<br />
developments. Many countries across the world require new<br />
developments above a specified size to develop a site specific<br />
TMM plan that mitigates the transport impact on the surrounding<br />
network. The TMM plan does not facilitate additional traffic – it proactively<br />
reduces it.<br />
TMM needs to have senior level support and buy-in. It needs to<br />
have ‘innovators’ who support the concept from the outset.<br />
A key element of TMM is the way in which it achieves stakeholder<br />
involvement from a wide range of societal sectors. These could be<br />
business leaders who facilitate the implementation of TMM plans in<br />
the workplace, or schools which influence student travel. A robust<br />
TMM programme needs to identify who it should engage with,<br />
when, how and why (refer to the Bell Diffusion of Innovation Model<br />
noted earlier).<br />
It is important to understand which are the site specific TMM quick<br />
wins in a particular area. What are peoples’ views on TMM? These<br />
will differ from city to city and country to country. Therefore, the<br />
best way to ensure that a TMM programme is right for an area is<br />
to undertake pilot studies. This also ensures that quick wins can be<br />
implemented; thus people can see the benefits immediately.<br />
28 JOURNEYS | <strong>November</strong> <strong>2011</strong>
7. Targeting and<br />
Segmentation<br />
8. Branding,<br />
Marketing and<br />
Social Marketing<br />
9. Emphasising the Site<br />
Specific Nature of<br />
TMM<br />
10. Recognition that<br />
TMM is for the<br />
Longer Term<br />
Transport Mobility Management: Small Changes - Big Impacts<br />
A number of different messages can be used to achieve TMM<br />
objectives. For this to be done successfully, specific target groups<br />
need to be identified, for example, employees in a particularly<br />
congested part of the city, all Central Government employees or<br />
those with a strong interest in the environment. For each group,<br />
the message and initiatives will differ – as will the propensity to<br />
change travel behaviour. This influences the direction of the TMM<br />
programme.<br />
Awareness is key to the success of any TMM programme. Therefore,<br />
it is useful to have a central, recognised branding strategy. This can<br />
be supported by area wide marketing activities to promote specific<br />
initiatives; for example, the development of a new car sharing tool.<br />
However, the next level – social marketing – is where the benefits can<br />
truly be realised. This is where campaigns and events are targeted at<br />
specific groups; for example, a TMM roadshow for employers along a<br />
particular public transport route, or a sustainability themed event for<br />
a particular community.<br />
Not all TMM measures are suitable everywhere. Some need to be<br />
enhanced or refined to meet particular local needs. Others are only<br />
appropriate in particular locations. For example, in Abu Dhabi, the<br />
potential for cycling in the summer months is limited due to the hot<br />
climate.<br />
The definition at the beginning of this paper highlights that TMM is a<br />
continuous process. It does not stop at a particular point. TMM is an<br />
ongoing concept that changes over time to best meet and address the<br />
needs of the target groups it is designed for.<br />
Conclusion<br />
Mobility management has the power to create a shift in overall attitudes and perceptions to travel<br />
and transport. It has achieved significant success in a variety of cities across the globe and could<br />
be an integral part of the forward planning of many more.<br />
References<br />
Mott MacDonald Ltd. 2009. ‘National Smarter Travel<br />
Areas Competition: Limerick City Council and Limerick<br />
County Council in Partnership with the University of<br />
Limerick’, October 2009.<br />
www.smartertravel.ie (accessed 13 September <strong>2011</strong>).<br />
The Mayor of London, the London Borough of Sutton<br />
and Transport for London. 2009. ‘Smarter Travel Sutton:<br />
Lessons Learnt in the Delivery of a Behaviour Change<br />
Programme, Summary Report’, <strong>November</strong> 2009.<br />
JOURNEYS | <strong>November</strong> <strong>2011</strong><br />
29
Transport Mobility Management: Small Changes - Big Impacts<br />
Damian Price is a Senior Project Manager at Mott MacDonald. He has<br />
extensive international experience in sustainable transport and mobility<br />
management and has been appointed to:<br />
• Transport for London’s Travel Plan Site Specific Advice Panel;<br />
• The Olympic Delivery Authority’s Travel Advice to Businesses Panel of<br />
Advisors; and<br />
• The Irish Department of Transport’s Panel of Expert Technical<br />
Advisers for ustainable Travel.<br />
Damian is currently Project Manager for the development of an Emirate-wide TMM strategy for<br />
Abu Dhabi, which aims to promote sustainable transport behaviour and facilitate a sustained<br />
change in attitudes to travel.<br />
Amy Leather is a Transport Planner in Mott MacDonald’s Singapore office.<br />
Amy has been involved in the development of a wide range of TMM plans<br />
in the UK, Ireland and the Middle East and has successfully delivered<br />
sustainable travel initiatives on behalf of public sector agencies and for<br />
private organisations, including workplaces, residential developments and<br />
event venues. Amy is currently developing policy guidance on behalf of<br />
Abu Dhabi Department of Transport to integrate the requirement for TMM<br />
plans into the planning process. She is also developing a TMM Plan Toolkit, which provides best<br />
practice guidance in the development of TMM plans for workplaces, educational institutions,<br />
residential developments and visitor attractions.<br />
30 JOURNEYS | <strong>November</strong> <strong>2011</strong>
Different Approaches to Public<br />
Transport Provision<br />
David A. HENSHER and Gabriel WONG<br />
Abstract<br />
Public transport is an essential service, and ensuring its effective and efficient provision<br />
is a priority of many governments. Different cities have adopted different approaches to<br />
public transport provision, each with its merits and shortcomings. This article provides<br />
a brief overview of the main approaches – government operation, competition in<br />
the market, government regulation of fares and services, competitive tendering, and<br />
negotiated performance-based contracts – with some real-world examples. There<br />
is no one-size-fits-all model, and cities have to decide the appropriate approaches<br />
for themselves based on their contexts and priorities. Singapore adopts an approach<br />
where the government regulates public transport fares and services provided by private<br />
operators. This has worked reasonably well, with some room for improvement.<br />
Introduction<br />
Travelling is part and parcel of modern urban<br />
living – people travel for work, education,<br />
recreation and many other reasons. For<br />
those who do not own motor vehicles,<br />
public transport could be their main means<br />
of travel. Because of its economic and social<br />
importance, public transport is considered<br />
an essential service in most cities, much like<br />
electricity, water and telecommunications.<br />
Hence ensuring effective and efficient<br />
provision of public transport services is a<br />
priority of most governments.<br />
Different cities have adopted different<br />
approaches to public transport provision, each<br />
with their own pros and cons. The history of<br />
public transport in many cities shows how<br />
views on the appropriate method of provision<br />
have evolved over time. This article aims to<br />
provide a brief survey of different approaches<br />
of public transport provision and Singapore’s<br />
approach. A global perspective is provided<br />
in the many papers from the International<br />
Conference Series on Competition and<br />
Ownership of Land Passenger Transport<br />
(the “Thredbo Series” http://www.thredboconference-series.org/papers/).<br />
Historical Trends in Public<br />
Transport Provision<br />
There was a wave of nationalisation in the 1940s<br />
to 1970s followed by privatisation from the late<br />
1970s in many countries. At the core of the<br />
nationalisation and privatisation waves were<br />
those industries providing essential services,<br />
such as public transport, telecommunications,<br />
electricity and gas.<br />
In the first half of the 20th century, urban public<br />
transport services in the UK and the US were<br />
mainly provided by private enterprises.<br />
JOURNEYS | <strong>November</strong> <strong>2011</strong><br />
Different Approaches to Public Transport Provision<br />
31
Different Approaches to Public Transport Provision<br />
However, rapidly rising automobile ownership<br />
after the Second World War led to a drastic<br />
decline in public transport ridership and<br />
revenues. Public transport service levels fell as<br />
these transport enterprises cut costs to survive.<br />
To maintain service provision, governments<br />
decided to nationalise their decrepit public<br />
transport industries by taking over the failed<br />
transport enterprises in the 1940s to 1960s.<br />
Due to inefficiency and the lack of<br />
incentives to reduce costs, unit operating<br />
costs in many government-operated public<br />
transport enterprises increased steadily after<br />
nationalisation. Public transport operations<br />
had to be heavily subsidised to maintain<br />
service levels and affordable fares. With rising<br />
government debt in many countries since the<br />
1970s, it became increasingly unsustainable<br />
to continue subsidising public transport. The<br />
lack of funds also led to significant underinvestment<br />
in public transport infrastructure<br />
and assets.<br />
Due to inefficiency and the lack<br />
of incentives to reduce costs, unit<br />
operating costs in many governmentoperated<br />
public transport<br />
enterprises increased steadily after<br />
nationalisation.<br />
Since the 1980s, many cities in Australia,<br />
Europe, the UK and the US have privatised public<br />
transport provision, in attempts to harness the<br />
market to keep costs down and tap on private<br />
finance for infrastructure investment. It was<br />
believed that, under private ownership and<br />
operation, the profit motive would incentivise<br />
32 JOURNEYS | <strong>November</strong> <strong>2011</strong><br />
operators to be efficient, innovative and reduce<br />
costs. These would in turn reduce the need for<br />
government subsidies, hence lightening the<br />
fiscal burden on governments and taxpayers. In<br />
addition, lower unit operating costs of private<br />
operators could also lead to lower fares.<br />
In many cities, privatisation was accompanied<br />
by the introduction of competitive tendering<br />
for public transport provision in the 1980s<br />
and 1990s, which usually led to substantial<br />
unit cost reductions. However, in several cases,<br />
unit costs actually increased in subsequent<br />
competitive tenders without corresponding<br />
service improvements. This has led to<br />
discussions over the need for an alternative<br />
approach to competitive tendering in the form<br />
of negotiated performance-based contracts<br />
(Hensher 2007).<br />
In many cities, privatisation was<br />
accompanied by the introduction<br />
of competitive tendering for public<br />
transport provision in the 1980s and<br />
1990s which usually led to substantial<br />
unit cost reductions.<br />
Public Transport Industry<br />
Structure<br />
Similar to electricity, water, gas and<br />
telecommunications, a large proportion<br />
of public transport costs comes from<br />
expenditure on infrastructure, for example,<br />
bus interchanges, rail stations and tracks, and<br />
operating assets, such as trains and buses. The<br />
other main cost component is the costs of<br />
operations and equipment maintenance. Due<br />
to the high fixed costs relative to operating
costs, public transport, especially in local<br />
urban contexts, can be considered a natural<br />
monopoly with significant economies of scale.<br />
This means that one large operator can supply<br />
public transport services at lower costs than<br />
two or more smaller operators.<br />
Due to the high fixed costs relative<br />
to operating costs, public transport,<br />
especially in local urban contexts, can<br />
be considered a natural monopoly<br />
with significant economies of scale.<br />
This means that one large operator<br />
can supply public transport services<br />
at lower costs than two or more<br />
smaller operators.<br />
While there are potential benefits, there are<br />
also risks associated with privatisation. Basic<br />
economic theory warns of the dangers of<br />
monopoly, public or private. Driven by the profit<br />
motive, private monopolies could exploit their<br />
market power to charge much higher prices<br />
than would have been possible with market<br />
competition. They may also reduce costs by<br />
lowering service levels, such as reducing service<br />
frequencies and equipment maintenance<br />
levels. An effective regulatory framework with<br />
price control must be in place to ensure that<br />
monopoly exploitation does not occur.<br />
Different Approaches to Public<br />
Transport Provision<br />
Government Operators<br />
Some would argue that, since private<br />
monopolies are likely to abuse their market<br />
power, it would be preferable to nationalise<br />
public transport. Nationalisation can be<br />
defined in several ways, for example, it could<br />
mean the government taking over transport<br />
planning, ownership of infrastructure, or<br />
service provision. In this article, nationalisation<br />
is defined specifically as government provision<br />
of public transport services.<br />
Proponents believe that government-run public<br />
transport operators which are not profit-driven<br />
would be less likely to abuse their market power,<br />
and would place greater priority on public<br />
service objectives, such as affordable fares and<br />
service enhancement. The government would<br />
also have more direct control over fares, supply<br />
of services, and service quality.<br />
However the lack of a profit motive provides<br />
little incentive for government operators to<br />
be efficient. While it is possible to set clear<br />
performance objectives for public enterprises,<br />
the experience in several countries has shown<br />
that government operators have generally<br />
failed to operate efficiently and their unit costs<br />
have increased steadily over the years. They<br />
would also face greater political pressure to<br />
provide unprofitable services.<br />
A benchmarking study done in 2008 compared<br />
Sydney’s government-run rail operator CityRail<br />
with Melbourne’s private rail operator Connex<br />
(LEK 2008). Both operators were comparable in<br />
scale but there was a disparity in cost efficiency.<br />
Using data from 2006/7, the study found that<br />
Connex’s costs were lower than CityRail’s.<br />
Connex’s annual rolling stock costs were 40%<br />
JOURNEYS | <strong>November</strong> <strong>2011</strong><br />
Different Approaches to Public Transport Provision<br />
Some would argue that, since private<br />
monopolies are likely to abuse their<br />
market power, it would be preferable<br />
to nationalise public transport.<br />
33
Different Approaches to Public Transport Provision<br />
less than CityRail’s. Connex’s crewing costs per<br />
service kilometre were about half of CityRail’s,<br />
while the former’s station costs per passenger,<br />
overhead costs per service kilometre, and<br />
employees per service kilometre were less than<br />
half of the latter’s.<br />
Proponents believe that governmentrun<br />
public transport operators<br />
which are not profit-driven would<br />
be less likely to abuse their market<br />
power, and would place greater<br />
priority on public service objectives,<br />
such as affordable fares and service<br />
enhancement.<br />
Competition in the Market<br />
At the other extreme, the government could<br />
deregulate (through relaxing price and quantity<br />
controls) the public bus services market and<br />
allow private operators to compete in the<br />
market. Operators are allowed to choose<br />
the routes they wish to serve and set fare<br />
and service levels. This could lead to cherrypicking<br />
where only profitable routes with<br />
high commuter demand would be served,<br />
sometimes by more than one operator, as is the<br />
case in New Zealand. Competition between<br />
the operators, however, encourages them to<br />
be cost efficient and reduce their operating<br />
costs, and could lead to increased choice and<br />
lower fares for commuters, but the evidence in<br />
urban areas is that natural monopoly tends to<br />
result in a single service provider.<br />
However, competition in the market, with more<br />
than one operator providing bus services on<br />
the same routes, leads to wasteful duplication<br />
of fixed costs and may prevent operators<br />
34 JOURNEYS | <strong>November</strong> <strong>2011</strong><br />
from reaching sufficient size to benefit from<br />
economies of scale. In addition, unprofitable<br />
routes with low commuter demand would not<br />
be served. This could lead to a fragmented<br />
public transport system with poor connectivity<br />
and accessibility where commuters have to<br />
make several transfers and journey times are<br />
long. Competition for passengers between<br />
buses could also lead to unsafe driving and<br />
unreliable schedules.<br />
Competition in the market, with more<br />
than one operator providing bus<br />
services on the same routes, leads to<br />
wasteful duplication of fixed costs<br />
and may prevent operators from<br />
reaching sufficient size to benefit<br />
from economies of scale.<br />
Although unit costs fell after privatisation and<br />
deregulation of bus services, the experiences<br />
of Sri Lanka with ‘peoplisation’ in the 1990s<br />
(Gomez-Ibanez 1997) and Britain (outside<br />
London) after deregulation in 1986, show<br />
the shortfalls of competitive and unregulated<br />
bus markets. Their bus networks were not<br />
integrated, leading to unserved corridors and<br />
timings with low demand. Bus drivers drove<br />
recklessly to compete for commuters and<br />
waited at bus stops until their buses were full.<br />
In Sri Lanka, buses were often overcrowded,<br />
old and not well-maintained. Singapore’s<br />
experience with an unregulated bus market<br />
before the 1970s was similar to Sri Lanka’s.<br />
In Britain, bus services in some areas are<br />
monopolised by large operators after they<br />
priced out smaller competitors and fares would<br />
rise.
In Britain, bus services in some areas<br />
are monopolised by large operators<br />
after they priced out smaller<br />
competitors and fares would rise.<br />
Government Regulation of Fares<br />
and Services<br />
With privatisation of essential services,<br />
governments often have to be more involved<br />
in regulating monopolistic operators to prevent<br />
abuse of market power. They may have to<br />
regulate prices and service levels to ensure<br />
affordability and minimum service standards.<br />
Fare regulation involves the regulator<br />
controlling fares that the public transport<br />
operator could charge. The criteria for deciding<br />
an appropriate fare level could include operator’s<br />
costs, rate of return on assets, improvements<br />
in productivity and fare affordability. If such<br />
criteria are applied correctly, the resulting<br />
subsidy is optimal in terms of value for money.<br />
To prevent operators from cutting corners<br />
to increase profits, it may be necessary<br />
for regulators to specify minimum service<br />
standards that operators have to comply<br />
with or be penalised for non-compliance.<br />
The standards could include service coverage,<br />
frequency, crowding and vehicle breakdowns.<br />
To improve public transport accessibility,<br />
regulators may require that operators serve<br />
some unprofitable routes and off-peak hours<br />
as a condition for the rights to operate services.<br />
The success of government regulation requires<br />
that regulators be able to approximate the<br />
optimal level of fares and service standards.<br />
Optimal fares have to be affordable to most<br />
commuters, but allow operators to provide<br />
reasonable quantity and quality of services<br />
and earn adequate profits for shareholder<br />
dividends and capital investment. This is<br />
difficult due to lack of information. The public<br />
may also judge the success of the regulatory<br />
regime based on their perceptions. Public<br />
acceptance would drop if the operators are<br />
perceived to be making excessive profits from<br />
high fares or providing poor quality of service.<br />
Singapore’s current approach to public transport<br />
provision, which will be discussed below, is an<br />
example of government regulation.<br />
Competitive Tendering<br />
Competition is important to ensure that<br />
privatisation improves efficiency. Many cities<br />
have introduced competition for the market<br />
through competitive tendering (CT) of licences<br />
to operate public transport services for a<br />
specified duration, for example, 15 years<br />
to operate a rail line or 5 years to operate<br />
a package of bus services. Cherry-picking<br />
of profitable routes could be prevented by<br />
packaging unprofitable routes with profitable<br />
ones or by provision of government subsidies.<br />
Licences could be awarded based on a number<br />
of criteria, for example, track record, proposed<br />
fares and services, or required amount of<br />
government subsidies.<br />
JOURNEYS | <strong>November</strong> <strong>2011</strong><br />
Different Approaches to Public Transport Provision<br />
To prevent operators from cutting<br />
corners to increase profits, it may be<br />
necessary for regulators to specify<br />
minimum service standards that<br />
operators have to comply with or be<br />
penalised for non-compliance.<br />
35
Different Approaches to Public Transport Provision<br />
Cherry-picking of profitable routes<br />
could be prevented by packaging<br />
unprofitable routes with profitable<br />
ones or by provision of government<br />
subsidies.<br />
Interested operators would submit competitive<br />
bids proposing high levels of service, low<br />
fares and low level of government subsidies<br />
in order to win the tenders. If there is intense<br />
competition for the tender, the winning bid<br />
would be close to the outcome with market<br />
competition. The transport regulator would<br />
enter into a contract with the winning operator<br />
based on the proposed terms. The operator<br />
has the incentive to be as efficient as possible<br />
to maximise profits for the limited duration<br />
of the licence. Extension of the licence could<br />
be contingent on the incumbent operator’s<br />
performance. The threat of replacement after<br />
expiry of the licence incentivises the incumbent<br />
to maintain good performance.<br />
Due to the durable, immobile nature of<br />
transport investments and the essential service<br />
nature of public transport, both parties –<br />
the operator and the regulator acting on<br />
behalf of commuters – are vulnerable to<br />
opportunistic behaviour of the other party.<br />
A long-term contract could protect both<br />
parties from opportunism by establishing<br />
clear commitments. The level of commitment<br />
depends on the completeness of the contract;<br />
a more complete contract is able to cover<br />
more contingencies (Hensher 2010). However<br />
it is undesirable and impossible to write a<br />
complete contract with a long duration if the<br />
environment is changing rapidly. A contract<br />
36 JOURNEYS | <strong>November</strong> <strong>2011</strong><br />
that is overly prescriptive may be inflexible to<br />
changing circumstances. Drafting a relatively<br />
complete contract may be too difficult and<br />
the transactions costs too high (Gomez-Ibanez<br />
2003).<br />
The threat of replacement after<br />
expiry of the licence incentivises the<br />
incumbent to maintain good performance.<br />
London’s bus system is the oft-cited example<br />
of how one of the world’s largest urban bus<br />
systems has benefited from CT at the route<br />
level. London began privatising its governmentrun<br />
bus operator and tendering bus services<br />
in 1985, and the conversion was completed<br />
by 1999. An expert (Cox 2004) compared<br />
the situation in London before and after the<br />
conversion, and found significant productivity<br />
improvement and cost reductions. Prior to<br />
privatisation and CT, bus costs per vehicle<br />
kilometre had risen 79% between 1970 and<br />
1985. This trend was reversed with costs per<br />
vehicle kilometre falling by 48% from 1985<br />
and 2001. Annual capital and operating<br />
expenditures dropped 26%, despite service<br />
expansion of a similar magnitude in the same<br />
period. Unit costs fell 48% and productivity<br />
measured by level of service per unit of currency<br />
increased 91%. Government subsidies were<br />
reduced substantially and reached a low of<br />
zero subsidies in 1997/8. Similar benefits were<br />
observed for Copenhagen, Stockholm, San<br />
Diego, Denver and Las Vegas after CT was<br />
introduced (Cox 2004).<br />
These cost savings, however, were often onceoff,<br />
a windfall gain. Many of the cities which<br />
experienced cost savings after introducing CT
saw unit costs rising in subsequent tenders,<br />
for example, in London, Copenhagen and<br />
Stockholm (Hensher and Wallis 2005), despite<br />
the primary focus of CT being to lower costs,<br />
subject to prescribed service levels. This<br />
has stimulated discussion on alternatives to<br />
CT, such as negotiated performance-based<br />
contracts (NPBCs) between regulators and<br />
operators, where there is greater emphasis on<br />
service improvement.<br />
Many of the cities which experienced<br />
cost savings after introducing CT<br />
saw unit costs rising in subsequent<br />
tenders...<br />
Negotiated Performance-Based<br />
Contracts<br />
Through negotiations and performance<br />
incentives, NPBCs may better enable the<br />
regulator to tap an operator’s expertise to<br />
facilitate innovation, patronage growth and<br />
service improvement. In addition, transactions<br />
costs of NPBCs are likely to be lower than CT<br />
as operators do not have to spend significant<br />
sums of money to prepare tender proposals.<br />
Efficient incumbent operators also face less<br />
uncertainty associated with renewal of licences,<br />
thus encouraging them to make long-term<br />
investments. Importantly, negotiation increases<br />
trust between the regulators and the operators<br />
which enables better communication and<br />
quicker resolution of issues arising from the<br />
inevitable incompleteness and lack of clarity<br />
in contracts, thus saving time and money<br />
(Hensher and Stanley 2010). Critics point out<br />
that there are risks of regulatory capture and<br />
collusion by operators with NPBCs. However<br />
these risks are also present in CT. NPBCs<br />
could complement CT, with CT as a last resort<br />
when incumbent operators fail to meet their<br />
contractual obligations.<br />
Analysis of a survey of bus contracts throughout<br />
the world confirmed the effects of increased<br />
trust in improving operators’ perceived clarity<br />
and completeness of contract obligations,<br />
which in turn improves the effectiveness<br />
of NPBCs and reduces the uncertainty with<br />
negotiations (Hensher 2010).<br />
The Need for Benchmarks<br />
Where there is only one operator providing<br />
public transport services without competition<br />
(e.g., under regulatory or contractual regimes),<br />
it may not set fares at competitive and<br />
affordable levels. The regulator may have to<br />
dictate fare levels to ensure efficiency and<br />
affordability, but this is difficult because the<br />
regulator does not have as much information<br />
on costs as the operator. Without benchmarks,<br />
it is difficult for the regulator to ascertain<br />
whether the public transport operator is<br />
efficient. Thus the operator is likely to request<br />
for fare increases every time its costs increase,<br />
but it is difficult for the regulator to turn down<br />
the request on the basis of inefficiency. The<br />
presence of other operators under similar<br />
cost conditions could provide benchmark<br />
comparisons for efficiency. The regulator could<br />
compare costs of the various operators to get<br />
JOURNEYS | <strong>November</strong> <strong>2011</strong><br />
Different Approaches to Public Transport Provision<br />
Analysis of a survey of bus contracts<br />
throughout the world confirmed the<br />
effects of increased trust in improving<br />
operators’ perceived clarity and<br />
completeness of contract obligations...<br />
37
Different Approaches to Public Transport Provision<br />
more information, before deciding whether to<br />
approve applications for fare increases.<br />
The presence of other operators<br />
under similar cost conditions could<br />
provide benchmark comparisons<br />
for efficiency. The regulator could<br />
compare costs of the various<br />
operators to get more information,<br />
before deciding whether to approve<br />
applications for fare increases.<br />
In Sydney (Australia) an effective benchmarking<br />
programme is in place (developed by Hensher<br />
and Saha International) that is used on an<br />
annual basis to identify bus operators (and<br />
soon to include rail and ferries) who satisfy a<br />
number of performance measures and those<br />
who do not. A process is in place to warn<br />
operators who do not pass on at least 6 of<br />
the 8 key performance indicators (of which<br />
cost efficiency and safety are mandatory). The<br />
approach not only ensures operator efficiency<br />
but also provides important data to understand<br />
the performance of the sector, something that<br />
is often missing under CT.<br />
Singapore’s Approach<br />
Singapore’s approach to public transport<br />
provision is based on sound economic theory<br />
and practical considerations. As with most<br />
goods and services in the economy, the<br />
Government believes that public transport<br />
services could be more efficiently provided<br />
by commercially run operators. There are<br />
two multi-modal operators providing rail and<br />
bus services in Singapore. Each operator has<br />
exclusive rights to operate its rail lines and bus<br />
services in its distinct Area of Responsibility.<br />
38 JOURNEYS | <strong>November</strong> <strong>2011</strong><br />
The Land Transport Authority (<strong>LTA</strong>) develops the<br />
public transport infrastructure and purchases<br />
the rail operating assets which it leases to the<br />
operators to operate and maintain. Operators<br />
pay licence charges for rights to operate public<br />
transport services. They retain revenues from<br />
fares and rental of commercial spaces in rail<br />
stations and bus interchanges, and pay for the<br />
operating costs without government subsidies.<br />
Recognising that public transport has the<br />
characteristics of a natural monopoly, the<br />
Government has established a tight regulatory<br />
framework to prevent the operators from<br />
abusing their market power to set excessively<br />
high fares and cut corners.<br />
The Public Transport Council (PTC), which is<br />
responsible for regulating bus and rail fares,<br />
uses a Fare Adjustment Formula to determine<br />
the maximum allowable fare increase each<br />
year, based on inflation in the operators’ costs<br />
and a productivity extraction to be shared<br />
with commuters. The average productivity<br />
improvement of the two operators is used<br />
to determine the productivity extraction.<br />
Recognising that public transport has the<br />
characteristics of a natural monopoly,<br />
the Government has established a tight<br />
regulatory framework to prevent the<br />
operators from abusing their market<br />
power to set excessively high fares and<br />
cut corners.<br />
This encourages each operator to be more<br />
efficient than the other. The presence of two<br />
operators allows for benchmark comparison,<br />
and gives a better idea of reasonable costs and<br />
service levels.
The presence of two operators allows<br />
for benchmark comparison, and gives<br />
a better idea of reasonable costs and<br />
service levels.<br />
The PTC would deliberate on operators’<br />
applications for fare increases, taking into<br />
account the macro-economic environment,<br />
operators’ retur n-on-total-assets and<br />
affordability of fares. The PTC has often not<br />
granted the maximum allowable fare increase.<br />
The PTC also has the power to initiate decreases<br />
in fares, if this is justified. This approach to<br />
fare regulation has ensured that fares remain<br />
affordable to most Singaporeans (Figure 1).<br />
The PTC also regulates bus services by<br />
establishing basic Quality of Service (QoS)<br />
standards which comprise Operating<br />
Performance Standards (OPS) and Service<br />
Provision Standards (SPS). OPS measure<br />
minimum daily or monthly operational<br />
deliverables at the bus network or route levels,<br />
such as bus reliability, loading and safety.<br />
Figure 1: Public Transport Fare Increases<br />
Index Value<br />
1.70<br />
1.60<br />
1.50<br />
1.40<br />
1.30<br />
1.20<br />
1.10<br />
1.00<br />
0.90<br />
1997 1998 1999 2000 2001 2002 2003 2004<br />
Year<br />
SPS measure overall bus route planning and<br />
provision of services which covers service<br />
availability, integration and provision of<br />
information (PTC). The <strong>LTA</strong> imposes minimum<br />
Operating Performance Standards (OPS) for<br />
rail services which measure service quality,<br />
safety assurance and equipment performance<br />
through indicators, such as service availability,<br />
schedule adherence, and severity of service<br />
disruption. Operators would be fined for failure<br />
to meet these standards.<br />
The annual Public Transport Customer<br />
Satisfaction Survey in 2010 found that more<br />
than 92% of respondents were satisfied<br />
with overall public transport services.<br />
However recently there has been some public<br />
unhappiness over overcrowding on buses and<br />
trains during peak hours and the irregular<br />
frequencies of buses. Since 2010, the <strong>LTA</strong><br />
has worked with the operators to review and<br />
improve bus and train services. More bus<br />
and train trips have been added to address<br />
overcrowding. To cope with increasing<br />
JOURNEYS | <strong>November</strong> <strong>2011</strong><br />
Different Approaches to Public Transport Provision<br />
Avrg Monthly<br />
Earnings<br />
Fare Adjustment<br />
Cap<br />
Overall Public<br />
Transport Fares<br />
2005 2006 2007 2008 2009 2010<br />
39
Different Approaches to Public Transport Provision<br />
The annual Public Transport<br />
Customer Satisfaction Survey in<br />
2010 found that more than 92% of<br />
respondents were satisfied with<br />
overall public transport services.<br />
train ridership, the <strong>LTA</strong> is expanding the<br />
rail network and increasing capacity on the<br />
current network.<br />
The <strong>LTA</strong> is also enhancing competition for the<br />
rail and bus markets. The licence duration<br />
for rail lines has been shortened from the<br />
current 30 years to about 15 years, thereby<br />
encouraging the incumbent operators to<br />
perform better in order to retain their<br />
licences. The <strong>LTA</strong> is also studying tendering<br />
of packages of bus routes in future, in order<br />
to inject competition for the bus market and<br />
spur efficiency.<br />
To cope with increasing train<br />
ridership, the <strong>LTA</strong> is expanding the<br />
rail network and increasing capacity<br />
on the current network.<br />
Conclusion<br />
There are different approaches to providing<br />
public transport services, each with its merits<br />
and shortcomings. Most governments aim<br />
to develop integrated and accessible urban<br />
public transport systems with reasonable<br />
quality of services and at affordable fares.<br />
These would ideally be fiscally sustainable,<br />
and provided by efficient and financially viable<br />
operators. There could be tradeoffs between<br />
the different objectives and governments have<br />
to strike a balance between public service and<br />
economic efficiency.<br />
40 JOURNEYS | <strong>November</strong> <strong>2011</strong><br />
Nationalisation was popular in the 1940s to<br />
1960s as governments attempted to provide<br />
integrated and affordable public transport<br />
services which the private operators were<br />
increasingly unable to provide. Privatisation<br />
of public transport gained ground from<br />
the 1980s due to increased importance of<br />
operator efficiency and fiscal sustainability.<br />
The appropriate approach for each<br />
government depends on what its priorities<br />
are. As with other policies, there may not<br />
The appropriate approach for each<br />
government depends on what its<br />
priorities are.<br />
be a one-size-fits-all model as contexts and<br />
imperatives differ among cities. Singapore<br />
has adopted an approach which seems to<br />
work reasonably well, with some areas for<br />
improvement. It could serve as a case study<br />
for other cities attempting to improve their<br />
public transport systems.<br />
References<br />
Cox, Wendell. 2004. Competitive Tendering of Public<br />
Transport. Presentation to the Urban Road and Public<br />
Transit Symposium. Montreal.<br />
Gomez-Ibanez, Jose A. 1997. Sri Lanka Transport (A):<br />
The Bus Industry. Kennedy School of Government Case<br />
Program CRI-97-1377.0.<br />
Gomez-Ibanez, Jose A. 2003. Regulating Infrastructure:<br />
Monopoly, Contracts, and Discretion. Harvard University<br />
Press, Cambridge, Massachusetts, and London, England.<br />
Hensher, David A. 2007. Delivering Value for Money to<br />
Government through Efficient and Effective Public Transit<br />
Service Continuity: Some Thoughts, (including commentary<br />
of 8 respondents) Transport Reviews, 27 (4). pp 411-448.<br />
Hensher, David A. 2010. Incompleteness and Clarity in Bus<br />
Contracts: Identifying the Nature of the ex ante and ex post<br />
Perceptual Divide. Research in Transportation Economics,<br />
29 (1), pp. 106-117.
Hensher, David A and Stanley, John. 2010. Metropolitan<br />
Bus Service Contracts (MBSC): Thoughts on the Next<br />
Round. Institute of Transport and Logistics Studies Working<br />
Paper ITLS-WP-10-02. The University of Sydney, Sydney,<br />
New South Wales.<br />
Hensher, David A and Wallis, Ian P. 2005. Competitive<br />
Tendering as a Contracting Mechanism for Subsidising<br />
Transport: The Bus Experience. Journal of Transport<br />
Economics and Policy, 39 (3), pp. 295-321.<br />
LEK. 2008. Cost Review of CityRail’s Regular Passenger<br />
Services. Independent Pricing and Regulatory Tribunal,<br />
Sydney, New South Wales.<br />
PTC (Public Transport Council), Singapore.<br />
http://www.ptc.gov.sg.<br />
JOURNEYS | <strong>November</strong> <strong>2011</strong><br />
Different Approaches to Public Transport Provision<br />
David A. Hensher is Professor of Management, and Founding Director of<br />
the Institute of Transport and Logistics Studies at The University of Sydney.<br />
A Fellow of the <strong>Academy</strong> of Social Sciences in Australia and Honorary<br />
Fellow of the Singapore <strong>LTA</strong> <strong>Academy</strong>, David has received several awards<br />
including the 2009 IATBR (International Association of Travel Behaviour<br />
Research) Lifetime Achievement Award in recognition for his longstanding<br />
and exceptional contribution to IATBR as well as to the wider<br />
travel behaviour community. David is Vice-Chair of the International<br />
Scientific Committee of the World Conference of Transport Research, and the Executive Chair<br />
and Co-Founder of The International Conference in Competition and Ownership of Land<br />
Passenger Transport (the Thredbo Series). David has published extensively and written many<br />
books. He is on the editorial boards of leading transport journals, and edited volumes on<br />
Handbooks in Transport, Transport Economics, and Transport and the Environment. Australia’s<br />
most cited transport academic and number three academic economist, David has advised<br />
numerous government and private sector organisations on transportation matters. His interests<br />
are transport economics, transport strategy, sustainable transport, productivity measurement,<br />
traveller behaviour analysis, choice analysis, stated choice experiments, and institutional reform.<br />
Gabriel Wong is a Researcher at the <strong>LTA</strong> <strong>Academy</strong> where he does<br />
research on land transport policies and developments in Singapore.<br />
He was previously with the Civil Service College’s Centre for Public<br />
Economics, Centre for Governance and Leadership, and Institute of<br />
Policy Development where he has written on Singapore’s experience<br />
in the areas of economic regulation, industrial policy, and industrial<br />
relations. Gabriel obtained his Bachelor in Social Science (Honours)<br />
degree and completed his Master in Social Science in Economics degree<br />
on a Research Scholarship at the National University of Singapore.<br />
41
Recommendations for Improving Transportation Energy Efficiency in APEC Economies<br />
Recommendations For Improving<br />
Transportation Energy Efficiency<br />
In APEC Economies<br />
Laura VAN WIE MCGRORY<br />
Abstract<br />
The March 2009 APEC Workshop on Policies that Promote Energy Efficiency in Transport<br />
(WPPEET) produced broad consensus that APEC economies should aim to increase<br />
transit-oriented development and integrated land-use planning, and minimise private<br />
motorised transport. The workshop recommendations for APEC economies included<br />
methods of overcoming institutional barriers and information gaps, as well as, the<br />
adoption of best practices to both improve the energy efficiency of vehicles and promote<br />
efficiency in the entire transport system. The workshop recommendations also suggested<br />
a stronger role for APEC in supporting needed research into key areas related to energy<br />
efficiency in transportation, and acting as a clearinghouse of information.<br />
Introduction<br />
The Asia Pacific Economic Cooperation<br />
(APEC) Workshop on Policies that Promote<br />
Energy Efficiency in Transport (WPPEET) –<br />
held at the APEC Secretariat in Singapore on<br />
24-25 March, 2009 – provided a lively forum<br />
on a range of transport topics, including fuel<br />
economy standards, operational efficiency<br />
programmes, freight efficiency, mass transit,<br />
reducing road congestion, and land use<br />
and urban planning. While the workshop<br />
focused on policies that could decrease the<br />
energy intensity of the transport sector in<br />
APEC economies, participants unanimously<br />
recognised the importance of energy<br />
efficiency and transportation within the larger<br />
context of climate change and sustainable<br />
economic development. Discussion also<br />
focused on how to write transportation into<br />
global climate policy.<br />
42 JOURNEYS | <strong>November</strong> <strong>2011</strong><br />
Particularly for developing economies, an<br />
emphasis on the economic and other cobenefits<br />
of energy efficient transport policy<br />
can help leaders overcome the perceived tradeoff<br />
between economic growth and adopting<br />
measures to cut emissions. For instance,<br />
reduced road congestion resulting from a<br />
modal shift from private-motorised transport<br />
to public transit – such as, a bus rapid transit<br />
or subway system – significantly improves<br />
road safety, local air pollution, and economic<br />
productivity.<br />
...for developing economies, an<br />
emphasis on the economic and<br />
other co-benefits of energy efficient<br />
transport policy can help leaders<br />
overcome the perceived trade-off<br />
between economic growth and<br />
adopting measures to cut emissions.
There was broad consensus among<br />
WPPEET participants that transit-oriented<br />
development, integrated land-use planning,<br />
and minimised private motorised transport<br />
should be among every economy’s primary<br />
development goals.<br />
The “Avoid-Shift-Improve” framework<br />
used by the Asian Development Bank provides<br />
a succinct lens for evaluating transport policy:<br />
Comprehensive transportation policy aims<br />
simultaneously to avoid travel, encourage<br />
a shift from motorised to non-motorised<br />
and low-carbon transport, and improve the<br />
efficiency of existing systems and vehicles.<br />
The WPPEET participants recommended the<br />
introduction of this framework into further<br />
discussions of APEC activities related to<br />
efficient transportation policy.<br />
Recommendations<br />
The recommendations emerging from the<br />
presentations and discussions at WPPEET fell<br />
into three categories:<br />
Recommendations for APEC<br />
Economies: Overcoming Barriers<br />
M a n y e c o n o m i e s f a c e c h a l l e n g e s<br />
integrating transportation policies with<br />
Table 1: Policies to encourage vehicle and transport system efficiency<br />
Recommendations for Improving Transportation Energy Efficiency in APEC Economies<br />
energy and planning p o l i c i e s . The<br />
WPPEET experts suggested measures for<br />
overcoming institutional barriers and the lack<br />
of reliable and comprehensive information,<br />
and for ensuring effective education of<br />
policy-makers and the public.<br />
Recommendations for Economies:<br />
Best Practices in Transport Policy<br />
The workshop recommendations also<br />
included specific policies for APEC economies<br />
to consider in addressing transportation<br />
energy efficiency. The policies are divided<br />
into strategies for improving the energy<br />
efficiency of vehicles, and strategies for<br />
promoting energy efficiency in the entire<br />
transport system (Table1).<br />
A Role for APEC<br />
APEC has an important role in supporting<br />
needed research into key areas related to<br />
energy efficiency in transportation, and<br />
acting as a clearinghouse of information on<br />
these issues. WPPEET workshop participants<br />
specifically recommended two measures;<br />
firstly, studies to improve and fill gaps in<br />
information, and secondly, the creation of a<br />
forum on energy-efficient transportation.<br />
Policies to Encourage Vehicle Efficiency Policies to Encourage Transport<br />
System Efficiency<br />
• Increasing Fuel Economy of New Vehicles • Reducing Road Congestion<br />
• Improving Operational Efficiency • Land Use and Urban Planning<br />
• Energy Efficiency in Freight • Mass Transit<br />
JOURNEYS | <strong>November</strong> <strong>2011</strong><br />
43
Recommendations for Improving Transportation Energy Efficiency in APEC Economies<br />
APEC has an important role in<br />
supporting needed research into key<br />
areas related to energy efficiency<br />
in transportation, and acting as a<br />
clearinghouse of information on these<br />
issues.<br />
Recommendations for the APEC<br />
Economies<br />
In addition to providing key information and<br />
resources, APEC can also encourage its 21<br />
member economies to consider certain policy<br />
strategies and goals. Despite the great diversity<br />
of economic and political climates of APEC<br />
members, workshop participants identified a<br />
number of common challenges that almost<br />
every economy faces, such as, the lack of<br />
reliable and comprehensive information, the<br />
need for effective education of policymakers<br />
and the public, and institutional barriers.<br />
All levels of government, from municipal to<br />
national, face challenges in the coordination<br />
of transportation and energy policy. These<br />
challenges are both horizontal (e.g., difficulty<br />
in coordinating policy among agencies at<br />
the same level) and vertical (difficulty in<br />
coordinating policy among agencies at<br />
different levels of government). To address<br />
overlapping (and sometimes conflicting)<br />
interests among different layers of government<br />
and different agencies, as well as, jurisdictional<br />
issues, p o l i c y m a k e r s should consider<br />
establishing cross-cutting task forces or<br />
consolidating leadership in transportation<br />
planning under one overarching agency .<br />
Another significant challenge is educating the<br />
44 JOURNEYS | <strong>November</strong> <strong>2011</strong><br />
public on the transportation options available<br />
to them, the considerable benefits of a<br />
comprehensive transportation policy, and the<br />
urgent need for action to ensure a sustainable<br />
future. In a difficult economic climate, an<br />
effective education/outreach campaign<br />
can help create the political will to make longterm<br />
investments in sustainable transportation.<br />
Public outreach also can help address cultural<br />
preferences and promote positive attitudes<br />
about using mass transit as an alternative<br />
to personal motorised transport. Lastly,<br />
ongoing education for policymakers on the<br />
interrelated impacts and challenges of energy<br />
and transportation, possible solutions, and<br />
potential benefits will facilitate every stage of<br />
this process.<br />
A third challenge is the problem of collecting<br />
reliable and consistent data and then<br />
translating and communicating those data in<br />
meaningful ways to the different government<br />
agencies with a stake in a new, comprehensive<br />
transportation and development strategy.<br />
Below are some recommendations on how to<br />
address these challenges.<br />
Institutional Recommendations<br />
APEC economies should establish official<br />
mechanisms of coordination among their<br />
ministries of transportation, energy, and<br />
environment. Often, the greatest barrier to<br />
effective policy making on energy-efficient<br />
transport is the lack of clear jurisdiction for a<br />
given programme, or the lack of communication<br />
among agencies regarding their needs and<br />
goals and possibilities for finding synergies<br />
among them.
Often, the greatest barrier to<br />
effective policy making on energyefficient<br />
transport is the lack of clear<br />
jurisdiction for a given programme,<br />
or the lack of communication among<br />
agencies regarding their needs and<br />
goals and possibilities for finding<br />
synergies among them.<br />
Data Collection and Goal<br />
Formulation Recommendations<br />
APEC economies should prioritise the<br />
collection and analysis of data relating to their<br />
transportation energy consumption, to enable<br />
the characterisation of their transportation<br />
systems. This effort will benefit greatly from the<br />
development and harmonisation of common<br />
methodologies currently under development<br />
by the Asian Development Bank and other<br />
organisations.<br />
Policy/Programme<br />
Recommendations for<br />
Improving Vehicle Efficiency<br />
• Increasing Fuel Economy of New Vehicles<br />
The key recommendations for increasing<br />
new vehicle efficiency in all economies<br />
centre around fuel economy standards.<br />
Economies with fuel economy standards<br />
already in place are recommended to<br />
develop implementation and enforcement<br />
plans to ensure the standards have the<br />
This initiative proposes making vehicles 50%<br />
more efficient by 2050. Though aggressive,<br />
GFEI maintains that this goal can be achieved<br />
Recommendations for Improving Transportation Energy Efficiency in APEC Economies<br />
The 50 by 50 Global Fuel Economy Initiative (GFEI)<br />
JOURNEYS | <strong>November</strong> <strong>2011</strong><br />
desired maximum impact, and to consider<br />
adopting more stringent standards – e.g.,<br />
those advocated by the International<br />
Energy Agency (IEA)’s 50 by 50 Global Fuel<br />
Economy Initiative. Economies that do not<br />
have fuel economy standards are urged to<br />
develop and adopt them, and to prioritise<br />
the harmonisation of new standards with<br />
existing ones in the region or coordinate<br />
with neighbouring economies to facilitate<br />
manufacturers’ compliance with new<br />
standards.<br />
The key recommendations for<br />
increasing new vehicle efficiency<br />
in all economies centre around fuel<br />
economy standards.<br />
Other recommendations include<br />
internalising the external costs of<br />
transportation energy consumption by<br />
increasing fuel taxes and removing fuel<br />
price stabilisation policies; investing in<br />
research and development for new highefficiency<br />
vehicle technologies; providing<br />
economic incentives (e.g., tax credits)<br />
to promote market penetration of highefficiency<br />
vehicles; and complementing<br />
policies with economic disincentives<br />
for the use of inefficient vehicles, such<br />
as, higher fuel taxes or excise taxes on<br />
vehicle sales.<br />
with existing technologies, and in the short<br />
term will have a high impact on reducing fuel<br />
consumption and carbon emissions.<br />
45
Recommendations for Improving Transportation Energy Efficiency in APEC Economies<br />
Two-wheelers in Asia<br />
The predominance of two- and three-wheelers<br />
is a growing phenomenon in Asian cities.<br />
Transportation and planning policies should<br />
find ways to consider their impacts and<br />
• Improving Operational Efficiency<br />
Several recommendations focus on<br />
improving the operational efficiency of<br />
all vehicles on the road. These include<br />
implementing a vehicle lifetime or<br />
scrappage policy–being mindful of<br />
unintended impacts to the import/export<br />
market for used vehicles and parts. A<br />
dedicated study on the topic of the Import/<br />
Export of Used Vehicles and Parts could<br />
help inform on this issue. The workshop<br />
experts also recommended that economies<br />
that import and export vehicles coordinate<br />
actions to develop and enforce standards<br />
on imported used vehicles.<br />
Other recommendations include adopting<br />
fuel-quality standards; designing driver<br />
education, training, and enforcement<br />
programmes to improve driving behaviours<br />
(which can raise a vehicle’s effective fuel<br />
efficiency by as much as 35 percent);<br />
implementing centralised inspection and<br />
maintenance programmes; and supporting<br />
the development of policies regulating twowheeler<br />
(Figure 2) operational efficiency,<br />
particularly in Asian cities.<br />
• Energy Efficiency in Freight<br />
For the freight sector, the following threepronged<br />
approach is recommended for<br />
improving the energy efficiency of freight<br />
operations:<br />
Figure 2: Two-wheelers in Asia<br />
46 JOURNEYS | <strong>November</strong> <strong>2011</strong><br />
accommodate these fleets as they continue<br />
to grow. Chinese Taipei, for example, has<br />
implemented a highly successful inspection and<br />
maintenance programme for two-wheelers.<br />
i) Improve the energy efficiency of freight<br />
vehicles by providing incentives (e.g.,<br />
rebates and tax credits for the purchase<br />
of fuel-efficient freight vehicles,<br />
or subsidies for their manufacture), and<br />
investing in research and development for<br />
more fuel-efficient freight vehicles.<br />
ii) Improve freight logistics by providing<br />
incentives for higher cargo volume per<br />
trip, and for two-way shipping (i.e.,<br />
ensuring that vehicles transport cargo<br />
on return trips). Both incentives and<br />
new infrastructure are also important for<br />
encouraging switching from truck freight<br />
to rail and ocean freight.<br />
iii) Provide driver education and training,<br />
e.g., by requiring freight drivers to attend<br />
courses that teach them how to improve
Freight Tax Incentives in Japan<br />
In Japan, three types of taxes are imposed on<br />
freight vehicles:<br />
(i) A one-time vehicle acquisition tax<br />
(ii) An annual vehicle tonnage tax (based on<br />
weight)<br />
a vehicle’s operational efficiency through<br />
such measures as reducing speeding,<br />
minimising gear changing, and scheduling<br />
regular inspections. As a complementary<br />
measure, economies are urged to<br />
implement programmes aimed at raising<br />
the awareness of freight companies and<br />
drivers about the link between fuel-efficient<br />
driving practices and safe operations, as<br />
well as, the fact that saving 10 percent on<br />
fuel costs can increase a freight company’s<br />
bottom line by 15-35 percent.<br />
...economies are urged to implement<br />
programmes aimed at raising the<br />
awareness of freight companies and<br />
drivers about the link between fuelefficient<br />
driving practices and safe<br />
operations, as well as, the fact that<br />
saving 10 percent on fuel costs can<br />
increase a freight company’s bottom<br />
line by 15-35 percent.<br />
Policies to Encourage Transport<br />
System Efficiency<br />
• Reducing Road Congestion<br />
To mitigate road congestion, the workshop<br />
recommendations include implementing<br />
demand-centric measures to reduce<br />
Recommendations for Improving Transportation Energy Efficiency in APEC Economies<br />
(iii) An annual vehicle capacity tax (based on<br />
cargo capacity)<br />
To incentivise fuel efficient freight vehicles,<br />
Japan reduces the level of all three taxes for<br />
fuel-efficient vehicles.<br />
JOURNEYS | <strong>November</strong> <strong>2011</strong><br />
congestion on existing roads, before<br />
implementing supply-centric measures (e.g.,<br />
building more roads), since experience has<br />
shown that the addition of more roads does<br />
not alleviate congestion. Another strategy<br />
is to price parking in commercial business<br />
districts at a rate that prevents congestion<br />
due to “parking cruisers”. Studies have<br />
shown that the ideal price for parking may<br />
be one that ensures a 15 percent vacancy<br />
rate at any given time, so that vehicles<br />
looking for parking will not contribute to<br />
congestion and emissions by circling city<br />
blocks.<br />
...Studies have shown that the<br />
ideal price for parking may be one<br />
that ensures a 15 percent vacancy<br />
rate at any given time, so that<br />
vehicles looking for parking will<br />
not contribute to congestion and<br />
emissions by circling city blocks.<br />
Congestion pricing systems can also be<br />
extremely effective, particularly when<br />
they are designed to maximise congestion<br />
reduction rather than revenue generation.<br />
Charging for congestion rather than, or<br />
in addition to, car ownership enables<br />
policy to shape marginal behaviour,<br />
47
Recommendations for Improving Transportation Energy Efficiency in APEC Economies<br />
Figure 3: Congestion Pricing in Singapore<br />
so those who choose to own cars can<br />
still make energy-efficient decisions.<br />
Electronic congestion pricing systems<br />
(Figure 3) can further promote energy<br />
efficiency in transport by varying charges<br />
according to vehicle fuel efficiency.<br />
• Land Use and Urban Planning<br />
Recommendations for improving land<br />
use and urban planning include incentivising<br />
mixed-use development – to ensure that<br />
retail, commercial, and residential areas<br />
are developed together (Figure 4) to reduce<br />
the need for car trips. Economies should<br />
adopt a long-term vision for land use that<br />
integrates transportation goals, along with<br />
medium-term plans to achieve the vision.<br />
Other recommendations include investing<br />
in infrastructure, such as, underpasses<br />
Congestion Pricing in Singapore<br />
Since 1975, Singapore has addressed the issue<br />
of road congestion with a road pricing system,<br />
which charges vehicles a fee to travel congested<br />
roads during peak hours. The system, which<br />
has been electronic since 1998, has increased<br />
Figure 4: Mixed-use development<br />
48 JOURNEYS | <strong>November</strong> <strong>2011</strong><br />
and covered walkways, that create a<br />
safe and comfortable environment for<br />
pedestrians (to provide an alternative to<br />
driving), and connecting non-motorised<br />
transport users to mass transit systems<br />
so that pedestrians and bikers can access<br />
mass transit systems.<br />
• Mass Transit<br />
One key workshop recommendation<br />
for mass transit is to focus on improving<br />
ridership on existing mass transit<br />
s y s t e m s b e f o r e expanding these<br />
systems or building new ones. Other<br />
suggestions include funding repairs and<br />
expansions of mass transit systems through<br />
tax revenue on land whose value has<br />
increased due to the development of the<br />
systems; and reforming mass transit pricing<br />
the speed at which traffic flows through the<br />
central business district by 20 percent. Prices<br />
are set with a goal of maintaining an optimal<br />
speed range of 45 to 65 km/h for expressways<br />
and 20 to 30 km/h for arterial roads.
Urban Planning in Shanghai, People’s Republic of China<br />
Shanghai has made efforts to control the<br />
rate of growth in private vehicle ownership<br />
through a multi-modal system of urban<br />
development. The city has built mass transit<br />
systems (Figure a), such as, light rail and bus<br />
lines to minimise the rate of growth in personal<br />
vehicle ownership. In addition, it has provided<br />
bike lanes and pedestrian walkways to enable<br />
commuters to connect to the mass transit<br />
system. Unlike Chinese cities with similar rates<br />
of population growth, Shanghai has stabilised<br />
the growth rate of private vehicle ownership<br />
based on distance rather than multiple<br />
trips to make it more convenient and less<br />
expensive at modal interfaces.<br />
When deciding which mass transit system<br />
to build first, it is recommended that<br />
economies consider time horizons for<br />
system completion (since the culture of<br />
personal vehicle ownership may become even<br />
more entrenched during the time it takes<br />
to complete a major system); integration<br />
of commercial and residential development<br />
around the system; and difficulties involved<br />
in developing the route (e.g., can a new<br />
right-of-way be built, or must it be carved<br />
out of existing road space?).<br />
...it is recommended that economies<br />
consider time horizons for system<br />
completion (since the culture of<br />
personal vehicle ownership may<br />
become even more entrenched during<br />
the time it takes to complete a major<br />
system)...<br />
Recommendations for Improving Transportation Energy Efficiency in APEC Economies<br />
Figure a: Maglev in Shanghai<br />
JOURNEYS | <strong>November</strong> <strong>2011</strong><br />
In addition, the cost-per-unit-of-energysaved<br />
of a given system is a key factor. It<br />
is important to consider what level of<br />
investment is required to yield the resulting<br />
energy savings, because there may be other<br />
transportation programs or policies that can<br />
reduce energy consumption at a lower cost.<br />
This calculation must take into account<br />
several factors, including:<br />
i) The energy consumption of a given system;<br />
ii) The energy consumption displaced by that<br />
system, which will be determined largely by<br />
ridership levels (a system with low ridership<br />
may actually consume more energy than it<br />
displaces);<br />
iii) The cost of building the system; and<br />
iv) The lifetime of the system. Systems that<br />
require a good deal of infrastructure are<br />
more expensive initially, but the system may<br />
last much longer, reducing the cost of the<br />
system over time.<br />
49
Recommendations for Improving Transportation Energy Efficiency in APEC Economies<br />
A Role for APEC<br />
Within the institutional framework of APEC,<br />
there exist many opportunities for promoting<br />
energy efficiency in transportation, both<br />
through projects and through the coordination<br />
of working groups and other bodies that<br />
advise the Ministers and Leaders of the APEC<br />
economies. APEC can play a unique role in<br />
improving information on current practices<br />
and policies in the region. The results of<br />
APEC studies and other information-sharing<br />
strategies can be used to enhance other global<br />
initiatives focusing on transportation in the<br />
context of the sector’s impacts on energy use,<br />
economic development, health, and climate.<br />
The results of APEC studies and other<br />
information-sharing strategies can<br />
be used to enhance other global<br />
initiatives focusing on transportation<br />
in the context of the sector’s<br />
impacts on energy use, economic<br />
development, health, and climate.<br />
Potential Projects<br />
APEC could undertake the following events<br />
and analyses, the results of which would be<br />
made available to the member economies for<br />
use in the development of transportation plans<br />
and policies.<br />
• Workshops on Transportation Energy<br />
Efficiency Improvement Potential, with a<br />
focus on potential energy savings from<br />
various policy options and the pace at<br />
which overall energy efficiency in transport<br />
could improve over time.<br />
• Detailed Study of Bus Rapid Transit and its<br />
potential benefits in terms of reduced oil<br />
50 JOURNEYS | <strong>November</strong> <strong>2011</strong><br />
imports, greenhouse emissions, and road<br />
congestion.<br />
• Detailed Analysis of Transit-Oriented<br />
Development to assess the most effective<br />
means to reduce automobile traffic<br />
through strategies that stress the clustering<br />
of commercial and residential buildings<br />
around urban transit routes.<br />
• Detailed Analysis of Intermodal Freight to<br />
examine the energy savings, greenhouse<br />
gas reductions, and transport system<br />
benefits of shifting freight from energyintensive<br />
modes (such as trucking) to<br />
energy-conserving modes (such as ships,<br />
barges, and rail).<br />
• Detailed Study of Import/Export of Used<br />
Vehicles and Vehicle Parts to characterise<br />
the import/export market of used vehicles<br />
and vehicle parts in APEC economies and<br />
provide recommendations on retirement/<br />
scrapping, recycling of vehicle parts, and<br />
geographical and topical opportunities for<br />
saving energy through addressing import/<br />
export issues.<br />
• Case Studies and Success Stories from the<br />
APEC Economies to provide a clearinghouse<br />
of information and support for the Asia-<br />
Pacific economies.<br />
• Development of Common Methodologies<br />
and Metrics to provide consistent and<br />
comparable metrics (e.g., energy intensity,<br />
carbon emissions, and vehicle miles traveled)<br />
to help policymakers make a strong business<br />
case for sustainable transportation policies.<br />
Coordination of APEC Working<br />
Groups<br />
Integrating the activities of APEC’s Energy
and Transportation Working Groups could<br />
provide significant assistance in coordinating<br />
the development of energy and transportation<br />
policy in APEC economies. Effectively improving<br />
the energy efficiency of transportation systems<br />
requires close coordination by ministries<br />
that in many cases have traditionally worked<br />
separately. The energy challenges that the<br />
Effectively improving the energy<br />
efficiency of transportation systems<br />
requires close coordination by<br />
ministries that in many cases have<br />
traditionally worked separately.<br />
APEC economies face cannot be addressed<br />
without considering transportation policy,<br />
and the transportation challenges cannot<br />
be addressed without incorporating energy<br />
issues. The establishment of an APEC forum<br />
on energy efficient transportation that involves<br />
and informs the APEC ministries of transport,<br />
energy, and the environment could:<br />
Acknowledgement<br />
Recommendations for Improving Transportation Energy Efficiency in APEC Economies<br />
• Provide focus on the need to reduce the<br />
energy intensity of, or the carbon emissions<br />
from, the transport sectors of the APEC<br />
economies; and<br />
• Ensure that the results of transport-related<br />
studies reach APEC ministers and encourage<br />
them to use the results to strengthen the<br />
business case for sustainable transport<br />
policies.<br />
Best Practices and Case Study<br />
Resources<br />
Resources available to policymakers include:<br />
i) “Avoid–Shift–Improve:<br />
An Action Plan to Make Transport in<br />
Developing Countries More Climate-<br />
Friendly,” Asian Development Bank<br />
ii) “50 by 50 Global Fuel Economy Initiative,”<br />
International Energy Agency<br />
iii) “Bellagio Memorandum on Motor Vehicle<br />
Policy,” International Council on Clean<br />
Transportation.<br />
This article is based on a recommendations report - “Improving Energy Efficiency in the Transportation Sector of APEC<br />
Economies” – prepared for APEC as a follow up to the APEC Workshop on Policies that Promote Energy Efficiency in<br />
Transport (WPPEET) In 2009. The original recommendations report was co-written by Diana Lin, Sally Larsen, and Laura<br />
Van Wie McGrory of the Alliance to Save Energy.<br />
Laura Van Wie McGrory, Vice President of International Programs with<br />
the Alliance to Save Energy, has managed the Alliance’s international<br />
energy efficiency projects since 2008. Before joining the Alliance, she<br />
worked with the Environmental Energy Technologies Division at Lawrence<br />
Berkeley National Laboratory for nine years, managing the Washington<br />
DC office of the Lab for the last two. Laura previously worked with the<br />
Intergovernmental Panel on Climate Change, and was a consultant to the<br />
US EPA’s Global Change Division, and the World Bank. She has a B.A. in<br />
Geography and Environmental Studies from Dartmouth College, and a Master of International<br />
Affairs from Columbia University’s School of International and Public Affairs.<br />
JOURNEYS | <strong>November</strong> <strong>2011</strong><br />
51
Achieving Green Freight in Asia<br />
Achieving Green Freight in Asia<br />
Sophie PUNTE and Yan PENG<br />
Abstract<br />
Road freight is the ‘Cinderella’ of the transport sector because of policy, technological<br />
and financial barriers which result in intense fuel use and increased emissions. This paper<br />
describes how a small trucks pilot project in Guangzhou led to a larger freight project<br />
in Guangdong and paved the way for designing a national freight programme in China.<br />
These initiatives on greening the freight and logistics sector are expected to be replicated<br />
in other Asian countries with strong support from private sector, as it is in their interest<br />
that common policies and integrated programmes are established.<br />
Introduction<br />
The efficient movement of goods and services<br />
contributes significantly to the economic<br />
growth of countries. As the Asian economy<br />
continues to grow at a rapid pace, an increase<br />
in freight activity is also expected. It is<br />
estimated that by the year 2050, medium and<br />
heavy freight trucks worldwide will consume<br />
1,240 billion litres of fuel (gasoline equivalent),<br />
138% more than 2000 levels. The global share<br />
of trucks operating within Asian countries is<br />
expected to increase from 19% in 2000 to<br />
34% in 2050. In China, more than 24 billion<br />
tonnes of freight were transported in 2010,<br />
twice as much as in the United States, with an<br />
annual growth rate of 14% in freight turnover.<br />
The high percentage of empty hauls combined<br />
with systemic overloading of trucks is common<br />
and results in economic loss, higher fuel use and<br />
emissions, and safety issues. Trucks are a main<br />
cause of greenhouse gases and air pollutants.<br />
For example, 4% of Chinese vehicles are trucks<br />
but they are responsible for 57% of particulate<br />
52 JOURNEYS | <strong>November</strong> <strong>2011</strong><br />
emissions from transport. The potential for<br />
savings is huge; fuel costs can be 60% of truck<br />
operating costs in Asia, making it an even more<br />
attractive area for cost reductions than in the<br />
US, where driver wages are the largest cost<br />
component.<br />
The high percentage of empty hauls<br />
combined with systemic overloading<br />
of trucks is common and results in<br />
economic loss, higher fuel use and<br />
emissions, and safety issues.<br />
Whether it is the introduction of cleaner<br />
fuels, fuel economy standards, tax incentives<br />
or investments in infrastructure to improve<br />
transport, the freight sector is seldom given<br />
attention and often ignored. People either<br />
drive cars or ride the bus and so trucks are not<br />
in the public eye. Within cities, trucks are often<br />
allowed along specific corridors only at night,<br />
as a way to reduce traffic congestion during<br />
the day. Freight is clearly the “Cinderella” of<br />
the transport sector.
Barriers to a Sustainable Road<br />
Freight Sector<br />
Some of the main challenges that Asian<br />
countries must overcome to effectively<br />
address sustainability issues of the freight and<br />
logistics sector are policies and institutional<br />
arrangements, characteristic of the freight<br />
sector, technologies and financing mechanisms.<br />
Policies that deal with the environmental<br />
performance of trucks and the trucking<br />
industry are often lacking or limited, and poorly<br />
enforced. Freight is seldom included in the<br />
design and planning of urban transport systems<br />
and in policy development, resulting in ad hoc<br />
measures to accommodate urban freight. The<br />
wide range of government agencies with a<br />
stake in freight also makes it difficult to assess<br />
and formulate policies to develop the sector<br />
more sustainably.<br />
The trucking sector in China is highly<br />
fragmented with almost 90% of trucks owned<br />
by individual drivers and only 0.1% belongs<br />
to companies with more than one hundred<br />
trucks. This makes it difficult for government<br />
agencies to reach them with information and<br />
policies on, for example, new technologies.<br />
Freight is seldom included in the design<br />
and planning of urban transport systems<br />
and in policy development, resulting in<br />
ad hoc measures to accommodate<br />
urban freight.<br />
Furthermore, the adoption of cleaner<br />
technologies is vital for developing Asia as<br />
many trucks are old and poorly maintained.<br />
Driver training and technologies can render<br />
significant fuel savings, which is important<br />
in developing Asian countries where the fuel<br />
costs are the largest component of a truck’s<br />
operational costs. Widespread technology<br />
adoption becomes challenging due to limited<br />
availability, fragmented suppliers’ network,<br />
and scarce case studies for Asia.<br />
Financing green technologies is hampered<br />
by high investment costs (despite potential<br />
large savings and short payback periods), the<br />
reluctance of banks and financiers to lend<br />
money to trucks drivers and small companies,<br />
and the lack of experience of ESCOs (energy<br />
service companies) with trucking fleets.<br />
Financiers often do not know how to appraise<br />
financing of technologies for trucks and<br />
policymakers have minimal experience in<br />
applying economic instruments to the trucking<br />
sector.<br />
Local, national and regional initiatives are<br />
needed to green freight and logistics in Asia.<br />
Piloting Green Trucks and Freight<br />
Logistics in China<br />
It all started with a truck pilot project in<br />
Guangzhou, a key transportation hub and<br />
capital of Guangdong Province, China (CAI-<br />
Asia and World Bank 2010). The pilot project<br />
started in 2009 and analysed the truck sector<br />
through research and a survey, developed<br />
JOURNEYS | <strong>November</strong> <strong>2011</strong><br />
Achieving Green Freight in Asia<br />
Financiers often do not know how to<br />
appraise financing of technologies for<br />
trucks and policymakers have minimal<br />
experience in applying economic<br />
instruments to the trucking sector.<br />
53
Achieving Green Freight in Asia<br />
and tested training materials for truck fuel<br />
efficiency and carried out a technology<br />
pilot. It was a collaborative effort between<br />
the Guangzhou transport and environment<br />
agencies, three trucking companies, Clean<br />
Air Initiative for Asian Cities (CAI-Asia), U.S.<br />
Environment Protection Agency (US EPA), U.S.based<br />
Cascade Sierra Solutions (CSS) and the<br />
World Bank.<br />
CAI-Asia tested tyre and aerodynamics<br />
technologies on ten long-haul and short-haul<br />
trucks of private companies, and garbage trucks<br />
(CAI-Asia and World Bank 2010). Technologies<br />
were selected based on successes achieved in<br />
the United States under the US EPA SmartWay<br />
programme. Fuel and emissions savings for<br />
garbage trucks equipped with low rolling<br />
resistance tyres and a tyre pressure monitoring<br />
system (Figure 1) were about 18%. This figure<br />
is much higher than the savings seen in the<br />
United States, most likely because aside from<br />
Figure 1: Low rolling resistance tyres and pressure monitoring systems<br />
Single-wide tyres<br />
or Dual low rolling<br />
resistance tyres<br />
reduce rolling<br />
resistance<br />
Aluminium wheels<br />
reduce weight<br />
Automatic tyre<br />
pressure monitoring<br />
systems keep tyre<br />
pressure more<br />
constant<br />
54 JOURNEYS | <strong>November</strong> <strong>2011</strong><br />
reducing friction with the road, the new tyres<br />
also made the truck more stable, thus reducing<br />
fuel use.<br />
Fuel savings of long distance trucks was about<br />
6.6%. This was less than expected because<br />
the trucks in the pilot travelled at lower speeds<br />
than the 75 km/hour needed for aerodynamics<br />
technologies to significantly reduce drag and<br />
fuel use. Still, the savings are high enough<br />
for companies to be interested in these<br />
technologies.<br />
To complement the technology pilot, truck<br />
drivers and truck fleet managers from the pilot<br />
companies participated in a training course<br />
on how to reduce truck fuel use. The course<br />
covered truck specifications, technologies,<br />
route planning, maintenance and inspection,<br />
and driving behaviour. The importance of driver<br />
training was highlighted as the difference in<br />
fuel efficiency between the best and worst<br />
Gap fairing reduces<br />
the tractor-trailer gap<br />
Skirts reduce wind<br />
underneath the trailer<br />
Nosecones reduce<br />
turbulence
driver in the US can be as high as 35%. A<br />
10-minute video of the technology pilot<br />
(CAI-Asia and World Bank 2010) and driver’s<br />
training materials are available in both English<br />
and Chinese.<br />
The survey involving 1,040 truck drivers and<br />
43 companies revealed that maintenance<br />
practices are poor as most drivers only use a<br />
hammer to check tyre pressure and 14% check<br />
pressure less than once per week (CAI-Asia and<br />
World Bank 2010).<br />
The importance of driver training<br />
was highlighted as the difference in<br />
fuel efficiency between the best and<br />
worst driver in the US can be as high<br />
as 35%.<br />
The pilot showed that Guangdong’s 825,000<br />
heavy duty trucks have the potential to reduce<br />
diesel use by 3.8 million hectolitre, CO2 emissions by 8 million tonnes and particulate<br />
matter (including black carbon) by 1.2 million<br />
tonnes each year through proper management<br />
and technologies. This helped convince<br />
Guangdong authorities to start a three-year<br />
USD $14 million Green Trucks Demonstration<br />
Project (CAI-Asia and World Bank 2010) cofinanced<br />
by GEF and covering the whole<br />
Guangdong Province.<br />
Launched at an International Green Freight<br />
Fair in October <strong>2011</strong>, this new project will<br />
install new technology on Guangdong trucks<br />
and explore technology financing options. The<br />
project will also investigate ways to optimise<br />
freight logistics and address fuel wastage from<br />
the estimated 40% empty hauls of trucks.<br />
To help design the project, CAI-Asia, US EPA<br />
and CSS hosted 19 government officials from<br />
Guangdong Province in June 2010 to visit<br />
truck fleets, the California Air Resources Board<br />
and several non-governmental organisations<br />
in California and Washington State. A visit<br />
to Europe in August <strong>2011</strong> gave insights into<br />
innovative freight logistics practices in Finland,<br />
Sweden and Switzerland (Figure 2).<br />
Establishing a Green Freight China<br />
Program<br />
The Guangzhou and Guangdong pilot became<br />
a springboard to establishing a national green<br />
freight programme. With Energy Foundation<br />
support, CAI-Asia designed a Green Freight<br />
China Program with five components: Clean<br />
Technologies, Freight Logistics, Financing<br />
Mechanisms, Knowledge & Capacity, and<br />
Partnerships between government and the<br />
private sector (CAI-Asia and World Bank<br />
2010). Its design is based on the US SmartWay<br />
Partnership programme, and comes at the<br />
right time for China. “Energy efficiency is a<br />
JOURNEYS | <strong>November</strong> <strong>2011</strong><br />
Achieving Green Freight in Asia<br />
The pilot showed that Guangdong’s<br />
825,000 heavy duty trucks have the<br />
potential to reduce diesel use by 3.8<br />
million hectolitre, CO 2 emissions by 8<br />
million tonnes.<br />
Figure 2: A visit to Europe to benchmark freight logistics<br />
practices in Finland, Sweden and Switzerland<br />
55
Achieving Green Freight in Asia<br />
Figure 3: Delegates at the 1st Green Freight China Seminar in May, <strong>2011</strong>.<br />
key factor in making the freight sector in China<br />
more competitive,” stated Mr. Xu Yahua,<br />
Deputy Director-General, Road Transportation<br />
Department, Ministry of Transport.<br />
The Guangzhou and Guangdong pilot<br />
became a springboard to establishing<br />
a national green freight programme.<br />
At the 1st Green Freight China Seminar last<br />
May <strong>2011</strong> (Figure 3), over ninety Chinese<br />
government officials, private sector and civil<br />
society representatives discussed how to<br />
advance green freight in China and several<br />
organisations committed to collaborate on<br />
policy research and pilot studies. The Seminar<br />
was organised by CAI-Asia with support from<br />
the Road Transportation Department of the<br />
Ministry of Transport, the Vehicle Emission<br />
Control Center of the Ministry of Environment<br />
Protection, Energy Foundation, US EPA, World<br />
Bank and CSS.<br />
Companies such as C.H. Robinsons, Schneider<br />
Logistics, Xin Bang Logistics and GITI Tires<br />
shared their experiences in introducing clean<br />
technologies and logistics solutions. “Those<br />
56 JOURNEYS | <strong>November</strong> <strong>2011</strong><br />
who can organise the labour capacity to<br />
move freight in China will be the winners”<br />
commented Schneider Logistics, pointing to<br />
the highly-fragmented truck sector.<br />
CAI-Asia will further develop the programme<br />
design with stronger collaboration among<br />
local, national and regional stakeholders from<br />
the freight sector.<br />
Expanding Efforts to Asia<br />
Green freight efforts in other Asian countries<br />
are also gaining traction. This is a welcome<br />
development, since tackling the barriers to a<br />
sustainable road freight sector would certainly<br />
require a common framework across Asia,<br />
especially with the freight movement going<br />
beyond international borders.<br />
...tackling the barriers to a sustainable<br />
road freight sector would certainly<br />
require a common framework<br />
across Asia, especially with the<br />
freight movement going beyond<br />
international borders.<br />
Improved freight transport efficiency is one<br />
of the sustainable transport goals under the
Bangkok 2020 Declaration signed by 15 Asian<br />
countries in August 2010 during the Fifth<br />
Environmentally Sustainable Transport Forum.<br />
A report highlighting the strategies and best<br />
practices for green freight in Asia will be<br />
released as a briefing paper for policy makers<br />
from transport and environment ministries<br />
during the Sixth Environmentally Sustainable<br />
Transport Forum to be held in Delhi, India in<br />
December <strong>2011</strong>.<br />
Interest in pilots and programmes on freight and<br />
logistics management has also sparked. The<br />
Society of Indian Automobile Manufacturers<br />
(SIAM), together with CAI-Asia, will hold a<br />
Green Freight India Seminar in January 2012 to<br />
engage truck manufacturers and government<br />
officials on establishing a programme design<br />
for improving fuel efficiency and reducing<br />
emissions from freight. Likewise, low carbon<br />
projects to reduce emissions from freight are<br />
also being implemented along the economic<br />
corridor of Thailand, Laos and Vietnam, also<br />
known as the Greater Mekong Sub-region.<br />
...low carbon projects to reduce<br />
emissions from freight are also being<br />
implemented along the economic<br />
corridor of Thailand, Laos and<br />
Vietnam, also known as the Greater<br />
Mekong Sub-region.<br />
Private sector support is pivotal to make these<br />
initiatives work. In the process of developing<br />
the Green Freight China Program design, CAI-<br />
Asia has brought together shippers, carriers<br />
and logistic service providers operating in<br />
China to discuss the role of the private sector<br />
in emissions reductions from freight and<br />
logistics. A follow-up meeting will be held<br />
before end of <strong>2011</strong>, supported by Logistics<br />
Institute - Asia Pacific and the Deutsche Post<br />
DHL. It will initiate the establishment of an<br />
informal partnership of private sector and<br />
other collaborating organisations to advance<br />
green freight programmes in China and other<br />
countries in Asia.<br />
Improving freight logistics would involve<br />
integration of truck companies, as well as,<br />
logistics centres. To facilitate this, CAI-Asia<br />
established a dedicated Green Freight website,<br />
www.greenfreightandlogistics.org. The goal is<br />
to improve access to information on policies<br />
and programmes, technologies and logistics,<br />
contacts and data relevant to the freight sector,<br />
especially for developing countries.<br />
Conclusion<br />
The China experience has shown that there<br />
is an untapped opportunity to reduce fuel<br />
use and emissions from the fuel-intensive<br />
freight and logistics operations. As proven by<br />
the green freight pilot project in Guangzhou,<br />
truck performance can be improved through<br />
technologies and drivers’ training to realise fuel<br />
savings and emissions reduction.<br />
City level and regional level projects for the<br />
freight sector can be successful and sustained<br />
if an integrated policy is in place nationally.<br />
This programmatic approach will only work<br />
if supported by stakeholders especially<br />
carriers, shippers, logistics providers and the<br />
government.<br />
JOURNEYS | <strong>November</strong> <strong>2011</strong><br />
Achieving Green Freight in Asia<br />
57
Achieving Green Freight in Asia<br />
Acknowledgement<br />
The authors want to thank Energy Foundation, World Bank, US EPA, Cascade Sierra Solutions, DHL, SSCCAP and Chinese<br />
government authorities for their support to advancing green freight in China and Asia. We would also like to acknowledge<br />
Bert Fabian, Sudhir Gota, Alvin Mejia, Su Song, Mingming Liu, and Parthaa Bosu from CAI-Asia for their role in green<br />
freight research and project implementation.<br />
Notes<br />
1. More information on the global share of trucks and their<br />
worldwide fuel consumption can be found in (WBCSD<br />
and IEA 2004).<br />
2. The full copy of the technology pilot report can be found<br />
at http://cleanairinitiative.org/portal/GreenTrucksPilot<br />
3. The viewing of the video may be accessed at http://<br />
cleanairinitiative.org/portal/knowledgebase/videos/Gree<br />
nTrucksPilotProjectinGuangzhou%28video%29<br />
4. More information on Guangdong GEF Green Freight<br />
Demonstration Project can be found at http://<br />
cleanairinitiative.org/portal/GuangdongGEF<br />
5. More information on Development of Green Freight<br />
China Program can be found at http://cleanairinitiative.<br />
org/portal/projects/GreenFreightChinaProgram.<br />
References<br />
CAI-Asia and World Bank. 2010. Green Trucks Pilot Project<br />
in Guangzhou: Final Report . http://cleanairinitiative.<br />
org/portal/GreenTrucksPilot<br />
58 JOURNEYS | <strong>November</strong> <strong>2011</strong><br />
6. In order to highlight the issue of freight to senior<br />
decision makers in Asia, CAI-Asia prepared a background<br />
paper on the “Challenges and Opportunities for an<br />
Environmentally Sustainable Road Freight Sector in<br />
Asia” for the United Nations Centre for Regional<br />
Development’s Fifth Environmentally Sustainable<br />
Transport Forum held in Bangkok, Thailand on 23-<br />
25 Aug 2010 (see http://cleanairinitiative.org/portal/<br />
node/6340).<br />
7. Challenges and Opportunities for an Environmentally<br />
Sustainable Road Freight Sector in Asia. 2010.<br />
Background paper prepared by Sophie Punte, Bert<br />
Fabian, Sudhir Gota and Alvin Mejia for the 5th Regional<br />
Environmentally Sustainable Transport Forum in Asia.<br />
World Business Council on Sustainable Development<br />
(WBCSD) and the International Energy Agency (IEA).<br />
2004. Sustainable Mobility Project. http://www.<br />
wbcsd.org/includes/getTarget.asp?type=p&id=MTQ0
JOURNEYS | <strong>November</strong> <strong>2011</strong><br />
Achieving Green Freight in Asia<br />
Sophie Punte is Executive Director with the Clean Air Initiative Asia<br />
(CAI-Asia) in Manila, which promotes reductions in air pollution and<br />
greenhouse gas emissions in all sectors, including trucks and freight.<br />
She leads the work on green freight in China together with the CAI-<br />
Asia China office. For four years she worked at the United Nations in<br />
Bangkok to lead a UNEP energy efficiency and climate change project<br />
for Asian industry in nine countries. Prior to joining the UN, Sophie was<br />
senior manager with audit and advisory firm KPMG in Australia and<br />
The Netherlands, a policy analyst with the New Zealand Environment<br />
Ministry and an environmental scientist with an engineering firm. She holds a Master of Science<br />
(Biology) and a Master of Environmental Management from the Netherlands.<br />
Yan Peng has been the China Representative of Clean Air Initiative Asia<br />
(CAI-Asia) in China since 2005. Prior to joining CAI-Asia she worked<br />
with the UK Department for International Development (DFID) and<br />
consulting firm ERM in China. She has a Master of Law degree from<br />
Peking University and studied at the Johns Hopkins University-Nanjing<br />
University Center for Chinese and American Studies, and the University<br />
of Toronto, Canada. Her areas of specialty are environment public policy,<br />
social impact assessments. Yan leads CAI-Asia’s China Network of 13<br />
cities and the annual Air Quality Management city workshop held together with the Ministry of<br />
Environmental Protection. She also leads CAI-Asia’s work in China to improve energy efficiency<br />
and reduce greenhouse gas and air pollutant emissions from freight and logistics.<br />
59
References<br />
Passenger Transport Mode<br />
Shares in World Cities<br />
Passenger transport mode share refers to the<br />
percentage of passenger journeys or trips by<br />
the main mode of transport and is typically<br />
reported through travel surveys. Comparing<br />
passenger transport mode share across<br />
different cities is a challenging task. As travel<br />
surveys are typically conducted for long-term<br />
strategic planning purpose, such surveys are<br />
not conducted frequently and detailed reports<br />
are not always published. The situation is<br />
further complicated as the surveys are often<br />
commissioned by local governments. The<br />
geographical areas covered, sampling and<br />
interviewing techniques, questionnaire and<br />
stratification methods deployed by travel<br />
surveys vary greatly in different countries.<br />
For example, the definition for a pedestrian<br />
trip or a public transport trip may be different<br />
in different countries. In cities like Hong<br />
Kong, mode share is based on the number of<br />
boardings by mode of transport (or journeystages).<br />
In most cities, however, mode share<br />
is reported on the basis of the number of<br />
journeys, which may consist of a series of<br />
boardings on different modes of transport and<br />
the main mode is reported as the transport<br />
mode.<br />
Mode share is affected by household incomes,<br />
land use patterns, and many other economic<br />
and social factors. Therefore, the figures may<br />
not be directly comparable. They should be<br />
60 JOURNEYS | <strong>November</strong> <strong>2011</strong><br />
analysed together with the historical, social<br />
and economic situation of the city.<br />
The mode share information of some major<br />
metropolitan cities in the world is presented.<br />
They include the traditionally advanced<br />
cities (e.g. London, Paris, New York and<br />
Tokyo), newly developed cities (e.g. Hong<br />
Kong, Seoul), cities often cited in transport<br />
innovations or sustainable transport surveys<br />
(e.g. Bogota, Osaka), and emerging megacities<br />
(e.g. Shanghai, Bangalore) (Table 1).<br />
For cities where mode share information of<br />
different geographical coverage is available,<br />
the geographical area that is approximately in<br />
a similar pattern to Singapore is used (e.g. land<br />
area, population density).<br />
Table 1: List of Selected Cities<br />
Asia<br />
Ahmedabad, Bangalore, Beijing, Delhi,<br />
Guangzhou, Hong Kong, Mumbai, Osaka,<br />
Seoul, Shanghai, Singapore, Taipei, Tokyo<br />
Australia<br />
Melbourne, Sydney<br />
Europe<br />
Barcelona, Berlin, London, Madrid, Paris,<br />
Prague, Rome, Vienna<br />
North America<br />
Chicago, New York City, Toronto<br />
South America<br />
Bogota, Curitiba
AHMEDABAD<br />
Population: 5.6 million<br />
Land area: 281 km 2<br />
Mode share<br />
Based on the number of journeys by main<br />
mode of transport. It includes all modes for all<br />
purposes. Mass transit constitutes 16% of all<br />
journeys.<br />
Data Sources:<br />
Census of India <strong>2011</strong><br />
Ministry of Urban Development, 2008. Study on Traffic<br />
and Transportation Policies and Strategies in Urban Areas<br />
in India<br />
BANGALORE<br />
Population: 8.4 million<br />
Land area: 226 km 2<br />
Mode share<br />
Based on the number of journeys by main<br />
mode of transport. It includes all modes for all<br />
purposes. Mass transit constitutes 35% of all<br />
journeys.<br />
Data Sources:<br />
Census of India <strong>2011</strong><br />
Ministry of Urban Development, 2008. Study on Traffic<br />
and Transportation Policies and Strategies in Urban Areas<br />
in India<br />
BARCELONA<br />
Population: 1.5 million<br />
Land area: 98 km 2<br />
Mode share<br />
Based on the number of journeys by main<br />
mode of transport. It includes all modes for all<br />
purposes. Mass transit constitutes 26% of all<br />
journeys.<br />
Data Sources:<br />
Urban Transport Benchmarking Initiative Year Three, Annex<br />
A1. Common Indicator Report 2006<br />
Figure 1: Mode Share in Ahmedabad<br />
JOURNEYS | <strong>November</strong> <strong>2011</strong><br />
Paratransit<br />
6%<br />
Cycle<br />
14%<br />
Public<br />
transport<br />
16%<br />
Figure 2: Mode Share in Bangalore<br />
Walk<br />
26%<br />
Public<br />
transport<br />
35%<br />
Figure 3: Mode Share in Barcelona<br />
Walk<br />
38%<br />
Walk<br />
22%<br />
Taxi<br />
1%<br />
Public<br />
transport<br />
26%<br />
Private<br />
transport<br />
42%<br />
Private<br />
transport<br />
25%<br />
Cycle<br />
7%<br />
Paratransit<br />
7%<br />
Private<br />
transport<br />
35%<br />
References<br />
61
CHICAGO<br />
Population: 2.7 million<br />
Land area: 589 km 2<br />
Mode share<br />
Based on the number of journeys by main<br />
mode of transport. It includes all modes for all<br />
purposes. Mass transit constitutes 16% of all<br />
journeys.<br />
Data Sources:<br />
Chicago Regional Household Travel Inventory: Mode Choice<br />
and Trip Purpose for the 2008 and 1990 Surveys, Chicago<br />
Metropolitan Agency for Planning<br />
CURITIBA<br />
Population: 1.9 million<br />
Land area: 430 km 2<br />
Mode share<br />
Based on the number of journeys by main<br />
mode of transport. It includes all modes for all<br />
purposes. Mass transit constitutes 45% of all<br />
journeys.<br />
Data Sources:<br />
ICLEI EcoMobility Case “Curitiba, Brazil - A model of transit<br />
oriented planning”<br />
DELHI<br />
Population: 11.0 million<br />
Land area: 431 km 2<br />
Mode share<br />
Based on the number of journeys by main<br />
mode of transport. It includes all modes for all<br />
purposes. Mass transit constitutes 42% of all<br />
journeys.<br />
Data Sources:<br />
Census of India <strong>2011</strong><br />
Ministry of Urban Development, 2008. Study on Traffic<br />
and Transportation Policies and Strategies in Urban Areas<br />
in India<br />
Figure 7: Mode Share in Chicago<br />
Walk<br />
19%<br />
Figure 8: Mode Share in Curitiba<br />
Figure 9: Mode Share in Delhi<br />
JOURNEYS | <strong>November</strong> <strong>2011</strong><br />
Bus<br />
11%<br />
Bus & BRT<br />
45%<br />
Walk<br />
21%<br />
Rail<br />
5%<br />
Taxi<br />
1%<br />
Others<br />
1%<br />
Cycle<br />
5%<br />
Public<br />
transport<br />
42%<br />
Cycle<br />
1%<br />
Private<br />
transport<br />
63%<br />
Private<br />
transport<br />
28%<br />
Walk<br />
21%<br />
Private<br />
transport<br />
19%<br />
Cycle<br />
12%<br />
Paratransit<br />
6%<br />
References<br />
63
MADRID<br />
Population: 3.1 million<br />
Land area: 606 km 2<br />
Mode share<br />
Based on the number of journeys by main<br />
mode of transport. It includes all modes for all<br />
purposes. Mass transit constitutes 34% of all<br />
journeys.<br />
Data Sources:<br />
Urban Transport Benchmarking Initiative Year Three, Annex<br />
A1. Common Indicator Report 2006<br />
MELBOURNE<br />
Population: 4.1 million<br />
Land area: 1,566 km 2<br />
Mode share<br />
Based on the number of journeys by main<br />
mode of transport. It includes all modes for all<br />
purposes. Mass transit constitutes 8% of all<br />
journeys.<br />
Data Sources:<br />
Victorian Integrated Survey of Travel and Activity 2007<br />
MUMBAI<br />
Population: 12.5 million<br />
Land area: 603 km 2<br />
Mode share<br />
Based on the number of journeys by main<br />
mode of transport. It includes all modes for all<br />
purposes. Mass transit constitutes 45% of all<br />
journeys.<br />
Data Sources:<br />
Census of India <strong>2011</strong><br />
Ministry of Urban Development, 2008. Study on Traffic<br />
and Transportation Policies and Strategies in Urban Areas<br />
in India<br />
Figure 13: Mode Share in Madrid<br />
Public<br />
transport<br />
34%<br />
Figure 14: Mode Share in Melbourne<br />
Walk<br />
13%<br />
Figure 15: Mode Share in Mumbai<br />
JOURNEYS | <strong>November</strong> <strong>2011</strong><br />
Bus<br />
Rail 3%<br />
4%<br />
Walk<br />
27%<br />
Cycle<br />
2%<br />
Taxi<br />
1%<br />
Walk<br />
36%<br />
Others<br />
1%<br />
Public<br />
transport<br />
45%<br />
Private<br />
transport<br />
29%<br />
Private<br />
transport<br />
77%<br />
Private<br />
transport<br />
15%<br />
Paratransit<br />
7%<br />
Cycle<br />
6%<br />
References<br />
65
References<br />
NEW YORK<br />
Population: 8.2 million<br />
Land area: 790 km 2<br />
Mode share<br />
Based on the number of journeys by main<br />
mode of transport. It includes all modes for all<br />
purposes. Mass transit constitutes 23% of all<br />
journeys.<br />
Data Sources:<br />
Census 2010, U.S. Census Bureau<br />
National Household Travel Survey 2009, New York City<br />
OSAKA<br />
Population: 2.7 million<br />
Land area: 222 km 2<br />
Mode share<br />
Based on the number of journeys by main<br />
mode of transport. It includes all modes for all<br />
purposes. Mass transit constitutes 34% of all<br />
journeys.<br />
Data Sources:<br />
Osaka Prefecture Travel Report 2000 (in Japanese only, 大<br />
阪府全体の人の動き 第4回パーソントリップ調査から,<br />
Japan)<br />
PARIS (Paris et Petite Couronne) 3<br />
Population: 6.5 million<br />
Land area: 762 km 2<br />
Mode share<br />
Based on the number of journeys by main<br />
mode of transport. It includes all modes for all<br />
purposes. Mass transit constitutes 62% of all<br />
journeys.<br />
Data Sources:<br />
National Transport Survey 2008 (in French only, Enquête<br />
Nationale Transports et Déplacements)<br />
66 JOURNEYS | <strong>November</strong> <strong>2011</strong><br />
Figure 16: Mode Share in New York<br />
Walk<br />
39%<br />
Others<br />
6%<br />
Figure 17: Mode Share in Osaka<br />
Walk<br />
27%<br />
Rail<br />
32%<br />
Bus<br />
10%<br />
Bus<br />
2%<br />
Private<br />
transport<br />
33%<br />
Rail<br />
12%<br />
Private<br />
transport<br />
39%<br />
Figure 18: Mode Share in Paris et Petite Couronne<br />
Public<br />
transport<br />
62%<br />
Cycle<br />
1%<br />
Taxi<br />
1%<br />
Private<br />
transport<br />
32%<br />
Walk<br />
4%
PRAGUE<br />
Population: 1.2 million<br />
Land area: 496 km 2<br />
Mode share<br />
Based on the number of journeys by main<br />
mode of transport. It includes all modes for all<br />
purposes. Mass transit constitutes 43% of all<br />
journeys.<br />
Data Sources:<br />
The Yearbook of Transportation 2009, Prague<br />
ROME<br />
Population: 3.7 million<br />
Land area: 1,290 km 2<br />
Mode share<br />
Based on the number of journeys by main<br />
mode of transport. It includes all modes for all<br />
purposes. Mass transit constitutes 20% of all<br />
journeys.<br />
Data Sources:<br />
Urban Transport Benchmarking Initiative Year Three, Annex<br />
A1. Common Indicator Report 2006<br />
SEOUL<br />
Population: 10.6 million<br />
Land area: 605 km 2<br />
Mode share<br />
Based on the number of journeys by main<br />
mode of transport. It includes only motorised<br />
modes for all purposes. Mass transit<br />
constitutes 63% of motorised journeys.<br />
Data Sources:<br />
Seoul Statistics – Population Trend in 2010<br />
Seoul Statistics – Composition of Daily Passenger<br />
Transportation in 2009<br />
Figure 19: Mode Share in Prague<br />
Public<br />
transport<br />
43%<br />
Figure 20: Mode Share in Rome<br />
Figure 21: Mode Share in Seoul<br />
JOURNEYS | <strong>November</strong> <strong>2011</strong><br />
Public<br />
transport<br />
20%<br />
Walk<br />
21%<br />
Bus<br />
28%<br />
Cycle<br />
1%<br />
Rail<br />
35%<br />
Walk<br />
23%<br />
Private<br />
transport<br />
33%<br />
Private<br />
transport<br />
59%<br />
Private<br />
transport<br />
26%<br />
Taxi<br />
6%<br />
Others<br />
5%<br />
References<br />
67
References<br />
SHANGHAI 4<br />
Population: 16.4 million<br />
Land area: 2,141 km 2<br />
Mode share<br />
Based on the number of journeys by main<br />
mode of transport. It includes all modes for all<br />
purposes. Mass transit constitutes 33% of all<br />
journeys.<br />
Data Sources:<br />
Shanghai Yearbook <strong>2011</strong><br />
Shanghai Construction and Transport Commission 2009<br />
(data provided directly)<br />
SINGAPORE<br />
Population: 5.1 million<br />
Land area: 712 km 2<br />
Mode share<br />
Based on the number of journeys by main<br />
mode of transport. It includes all modes for all<br />
purposes. Mass transit constitutes 44% of all<br />
journeys.<br />
Data Sources:<br />
Singapore in Figures <strong>2011</strong><br />
Travel Survey <strong>2011</strong>, Land Transport Authority, Singapore<br />
SYDNEY<br />
Population: 4.6 million<br />
Land area: 1,580 km 2<br />
Mode share<br />
Based on the number of journeys by main<br />
mode of transport. It includes all modes for all<br />
purposes. Mass transit constitutes 11% of all<br />
journeys.<br />
Data Sources:<br />
2009/10 Household Travel Survey-Key Indicators for Sydney<br />
Figure 22: Mode Share in Shanghai<br />
68 JOURNEYS | <strong>November</strong> <strong>2011</strong><br />
Figure 23: Mode share in Singapore<br />
Rail<br />
19%<br />
Walk<br />
22%<br />
Taxi<br />
4%<br />
Cycle<br />
1%<br />
Figure 24: Mode Share in Sydney<br />
Walk<br />
18%<br />
Walk<br />
27%<br />
Bus<br />
6%<br />
Public<br />
transport<br />
33%<br />
Rail<br />
5%<br />
Others<br />
2%<br />
Private<br />
transport<br />
20%<br />
Private<br />
transport<br />
29%<br />
Bus<br />
25%<br />
E-bike<br />
10%<br />
Cycle<br />
10%<br />
Private<br />
transport<br />
69%
References<br />
VIENNA<br />
Population: 1.6 million<br />
Land area: 415 km 2<br />
Mode share<br />
Based on the number of journeys by main<br />
mode of transport. It includes all modes for all<br />
purposes. Mass transit constitutes 36% of all<br />
journeys.<br />
Data Sources:<br />
Vienna Modal Split 2010 (in German only, APA-Grafik<br />
Modal Split, Wiener)<br />
Notes<br />
1. For Beijing, this includes the traditional urban area,<br />
which is only part of the area administered by the Beijing<br />
Municipality.<br />
2. For Guangzhou, this includes the central districts (i.e.<br />
Liwan, Yuexiu, Haizhu, Tianhe, Baiyun, Huangpu) only,<br />
which is only part of the area administered by the<br />
Guangzhou Municipality.<br />
3. For Paris, this includes the city of Paris and the surrounding<br />
districts collectively called “Petite Couronne” (Little<br />
Crown, or Inner Ring): Hauts-de-Seine, Seine-Saint-<br />
Denis and Val-de-Marne.<br />
Figure 28: Mode Share in Vienna<br />
Public<br />
transport<br />
36%<br />
70 JOURNEYS | <strong>November</strong> <strong>2011</strong><br />
Cycle<br />
5%<br />
Walk<br />
28%<br />
Private<br />
transport<br />
31%<br />
4. For Shanghai, this includes the traditional urban area<br />
and the Pudong New District, which is only part of the<br />
area administered by the Shanghai Municipality.<br />
5. For Tokyo, this includes the traditional urban area<br />
collectively called “23-Ward”, which is only part of<br />
the area administered by the Tokyo Metropolitan<br />
Government (TMG).
Comparison of Public Transport<br />
Operations<br />
Comparing the performances of public<br />
transport operators helps surface some<br />
understanding of the best practices employed in<br />
the industry. Here, key performance indicators<br />
have been identified for three functional areas,<br />
namely: system utilisation, fare level, and<br />
operational efficiency.<br />
We recognise that these indicators do not<br />
represent the complete picture of the company’s<br />
performances, and some of them may not be<br />
directly comparable because of the differences<br />
in operational scales, organisational structure<br />
and accounting practices. These indicators<br />
should be interpreted together with other<br />
performances such as service quality, safety<br />
and security, employee and public relations, as<br />
well as the planning, design, development and<br />
regulatory regime within which they operate.<br />
Table 1: Key Performance Indicators (KPIs)<br />
Functional<br />
Area<br />
System<br />
Utilisation<br />
Indicators Description/Remark<br />
Average<br />
passenger-km<br />
per vehicle-km<br />
Annual ridership<br />
(million) per<br />
station<br />
Annual ridership<br />
(million) per bus<br />
Key Indicators in Comparison<br />
A list of performance indicators of selected<br />
public transport operators are compiled in<br />
terms of system utilisation, affordability, and<br />
operational efficiency for reference (Table 1).<br />
System utilisation measures the level of<br />
assets being utilised - adequate utilisation<br />
is essential to generate revenue to fund<br />
operations. However, excessive utilisation may<br />
imply crowding (an aspect of service quality)<br />
during peak periods if the demand is not well<br />
distributed.<br />
The purpose of public transport is to provide<br />
basic amenity and mobility to the society; thus<br />
it is critical that the fare level is affordable to the<br />
general public. As an indicator of affordability,<br />
the fare is normalised using PPP conversion<br />
This indicator measures the average system loading, in other words, how<br />
well the operating capacity has been utilised. A higher value suggests<br />
better utilisation.<br />
This indicator can be used to measure the performance of both bus and rail<br />
systems. However, as the information of passenger-distance travelled is not<br />
always available in bus systems, this indicator is used in the comparison of<br />
rail systems only.<br />
This indicator normalises the ridership by the number of stations in the<br />
rail system. A higher value suggests a better utilisation of the system<br />
infrastructure.<br />
JOURNEYS | <strong>November</strong> <strong>2011</strong><br />
References<br />
This indicator normalises bus ridership by bus fleet size, and reflects the<br />
asset utilisation. A higher value means that on average, a bus carries more<br />
passengers and suggests better asset utilisation.<br />
71
References<br />
Functional<br />
Area<br />
Affordability<br />
(Fare Level)<br />
Operation<br />
Efficiency<br />
Indicators Description/Remark<br />
Average fare per<br />
passenger-km<br />
Average fare per<br />
boarding<br />
Operating costs<br />
per passengerkm<br />
Operating costs<br />
per boarding<br />
This indicator measures how much a commuter pays for one kilometre<br />
he/she travels in the public transport system. As fare structures may be<br />
distance-based (e.g. Singapore and Hong Kong) or Zone-based (e.g.<br />
London), therefore, removing the effect of travelling distance provides a<br />
fair comparison among operators. A lower value means that commuters<br />
pay less for every kilometre travelled.<br />
This indicator is used only in the comparison of rail systems due to a lack of<br />
information for bus systems.<br />
Average fare per boarding is computed using total fare revenue divided by<br />
total ridership. Different from the previous indicator, this indicator measures<br />
average fare per trip directly. The comparison of this indicator is still<br />
meaningful as commuters usually would not compute how long they have<br />
travelled; instead, they care more for how much they have been charged<br />
for a trip. This indicator applies to both bus and rail operator comparisons.<br />
Subsides are excluded from fare revenue. In some cities, the government<br />
subsidises concession travel (e.g. the difference between normal fare and<br />
concession fare) and pays the difference to operators accordingly. Such<br />
subsides are excluded from fare revenue computations as they are paid by<br />
the government, instead of commuters.<br />
This indicator measures the cost required to deliver every kilometre a<br />
passenger travels. As operating cost is largely fixed (e.g. manpower cost,<br />
fuel cost) once the route and schedule are determined, a higher ridership<br />
and longer trip distance would lead to higher operational efficiency.<br />
As different development stages and financial methods result in different<br />
depreciation of rail assets, the depreciation cost is removed from the operating<br />
cost for a fair comparison across rail operators.<br />
This indicator measures the operating cost (excluding depreciation cost<br />
of rail assets) for every passenger trip. A higher value refers to lower<br />
efficiency.<br />
Farebox ratio Farebox ratio is computed by total fare revenue over total operating cost. In<br />
rail comparison, depreciation cost is excluded from operating cost.<br />
This indicator measures the financial viability of an operator without<br />
subsidy. A ratio above 1 suggests that the operator is able to recover its<br />
operating cost (excluding depreciation of rail assets) with fare revenue. If<br />
operators could not recover their operating cost from fare revenue, then<br />
government subsidy or other income is required to maintain the fare level<br />
and service quality.<br />
factor, as it takes into account both cost of<br />
living and exchange rates.<br />
Operational efficiency is essential to keep the<br />
fare affordable. A high operating efficiency<br />
ensures that lower revenue is able to cover<br />
operating cost. Subsidies may be required<br />
72 JOURNEYS | <strong>November</strong> <strong>2011</strong><br />
by operators who are unable to recover their<br />
operating cost from fares.<br />
Public Transport Operators (PTOs)<br />
in Comparison<br />
Public Transport Operators (PTOs) are selected<br />
based on their performance, geographical
Table 2: Key Performance Indicators (KPIs)<br />
Asia / Australia Europe North America<br />
[r] [b]<br />
SMRT, Singapore<br />
SBST, Singapore [b]<br />
MTR Corporation, Hong Kong [r]<br />
KMB, Hong Kong [b]<br />
Shanghai Shentong Metro [r]<br />
Taipei Metro [r]<br />
[r] [b]<br />
Toei, Tokyo<br />
Tokyo Metro [r]<br />
Sydney Bus [b]<br />
Notes: [r] rail; [b] bus<br />
London Underground [r]<br />
London Bus [b]<br />
Nexus Tyne & Wear Metro [r]<br />
Dublin Bus [b]<br />
[r] [b]<br />
TMB Barcelona<br />
SL Stockholm [b]<br />
coverage, and data availability (Table 2). Data<br />
here is obtained mainly from annual reports<br />
and financial statements published by the<br />
operators.<br />
Comparisons among Rail Operators<br />
The rail operations in this comparison refer<br />
to those of mass rapid transit systems (MRT,<br />
metro, or subway, as it is called in some cities).<br />
They do not include operations of inter-city<br />
rail, commuter rail and light rail systems<br />
because the operating cost, demand (volume<br />
and distance) and fares of these systems are<br />
generally different from that of the MRT system<br />
Toei - Tokyo<br />
Tokyo Metro<br />
TMB-Barcelona<br />
Taipei Metro<br />
SMRT-Singapore<br />
Shanghai Shentong<br />
Nexus Tyne & Wear<br />
MTR-Hong Kong<br />
MTA-New York<br />
London Underground<br />
CTA-Chicago<br />
Infrastructure - Rail Length<br />
JOURNEYS | <strong>November</strong> <strong>2011</strong><br />
[r] [b]<br />
MTA New York<br />
Chicago Transit Authority<br />
MTA Washington [b]<br />
Translink Vancouver [b]<br />
and therefore, not directly comparable.<br />
References<br />
0 50 100 150 200 250 300 350 400 450<br />
[r] [b]<br />
The infrastructure (including length and<br />
number of stations of the rail network) is<br />
presented as supplementary information. It is<br />
used to normalise some indicators, such as,<br />
annual ridership, for a fair comparison. The<br />
infrastructure here shows the status at the<br />
point of comparison and it may not be the<br />
latest figure. For example, the Circle Line Stage<br />
4&5 in Singapore is not included in SMRT<br />
(Singapore) rail length as its revenue operation<br />
only started on 8 Oct <strong>2011</strong>. For Shanghai<br />
Shentong metro, only Line 1 was included as<br />
the other lines were not accounted for under<br />
Shanghai Shentong, the public-listed company.<br />
km<br />
73
References<br />
Toei - Tokyo<br />
Tokyo Metro<br />
TMB-Barcelona<br />
Taipei Metro<br />
SMRT-Singapore<br />
Shanghai Shentong<br />
Nexus Tyne & Wear<br />
MTR-Hong Kong<br />
MTA-New York<br />
London Underground<br />
CTA-Chicago<br />
Toei - Tokyo<br />
Tokyo Metro<br />
Taipei Metro<br />
SMRT-Singapore<br />
MTR-Hong Kong<br />
MTA-New York<br />
London Underground<br />
CTA-Chicago<br />
Toei - Tokyo<br />
Tokyo Metro<br />
TMB-Barcelona<br />
Taipei Metro<br />
SMRT-Singapore<br />
Shanghai Shentong<br />
Nexus Tyne & Wear<br />
MTR-Hong Kong<br />
MTA-New York<br />
London Underground<br />
CTA-Chicago<br />
0<br />
Infrastructure - Number of Stations<br />
0 50 100 150 200 250 300 350 400 450 500<br />
System Utilisation - Average passenger-km per vehicle-km<br />
10 20 30 40 50 60 70 80<br />
System Utilisation - Annual ridership (million) per station<br />
0 2 4 6 8 10 12 14 16 18<br />
74 JOURNEYS | <strong>November</strong> <strong>2011</strong>
Toei - Tokyo<br />
Tokyo Metro<br />
Taipei Metro<br />
SMRT-Singapore<br />
MTR-Hong Kong<br />
MTA-New York<br />
London Underground<br />
CTA-Chicago<br />
Toei - Tokyo<br />
Tokyo Metro<br />
TMB-Barcelona<br />
Taipei Metro<br />
SMRT-Singapore<br />
Shanghai Shentong<br />
Nexus Tyne & Wear<br />
MTR-Hong Kong<br />
MTA-New York<br />
London Underground<br />
CTA-Chicago<br />
Toei - Tokyo<br />
Tokyo Metro<br />
TMB-Barcelona<br />
Taipei Metro<br />
SMRT-Singapore<br />
Shanghai Shentong<br />
Nexus Tyne & Wear<br />
MTR-Hong Kong<br />
MTA-New York<br />
London Underground<br />
CTA-Chicago<br />
Fare Level - Average fare per passenger-km<br />
$0.00 $0.05 $0.10 $0.15 $0.20 $0.25 $0.30 $0.35 $0.40 $0.45<br />
Fare Level - Average fare per boarding<br />
JOURNEYS | <strong>November</strong> <strong>2011</strong><br />
S$, PPP<br />
S$, PPP<br />
$0.00 $0.50 $1.00 $1.50 $2.00 $2.50 $3.00 $3.50<br />
Operation Efficiency - Operating cost per boarding*<br />
References<br />
S$, PPP<br />
$0.00 $0.50 $1.00 $1.50 $2.00 $2.50 $3.00 $3.50 $4.00<br />
*Operating cost excludes depreciation<br />
75
References<br />
Toei - Tokyo<br />
Tokyo Metro<br />
TMB-Barcelona<br />
Taipei Metro<br />
SMRT-Singapore<br />
Shanghai Shentong<br />
Nexus Tyne & Wear<br />
MTR-Hong Kong<br />
MTA-New York<br />
London Underground<br />
CTA-Chicago<br />
0.0<br />
*Operating cost excludes depreciation<br />
0.5 1.0 1.5 2.0 2.5<br />
Comparison of Bus Operators<br />
The bus operations in this comparison refer<br />
to those of public buses in a city. They do not<br />
include school bus, company bus, inter-city bus<br />
and tourist bus, etc., because the operating<br />
cost, demand and fares of these systems are<br />
generally different from public buses and<br />
therefore, not directly comparable.<br />
Translink-Vancouver<br />
Toei - Tokyo<br />
TMB-Barcelona<br />
Sydney Bus<br />
SMRT-Singapore<br />
SL-Stockholm<br />
SBST-Singapore<br />
MTA-Washington<br />
MTA-New York<br />
London Bus<br />
KMB-Hong Kong<br />
Dublin<br />
CTA-Chicago<br />
Operation Efficiency - Farebox ratio*<br />
Infrastructure - Fleet Size<br />
76 JOURNEYS | <strong>November</strong> <strong>2011</strong><br />
The infrastructure (i.e., bus fleet of the<br />
operators) is presented as supplementary<br />
information. It has been used to normalise<br />
annual ridership to compare system utilisation<br />
as operators are running at different scales.<br />
0 1,000 2,000 3,000 4,000 5,000 6,000 7,000 8,000
Translink-Vancouver<br />
Toei - Tokyo<br />
TMB-Barcelona<br />
Sydney Bus<br />
SMRT-Singapore<br />
SL-Stockholm<br />
SBST-Singapore<br />
MTA-Washington<br />
MTA-New York<br />
London Bus<br />
KMB-Hong Kong<br />
Dublin<br />
CTA-Chicago<br />
Translink-Vancouver<br />
Toei - Tokyo<br />
TMB-Barcelona<br />
Sydney Bus<br />
SMRT-Singapore<br />
SL-Stockholm<br />
SBST-Singapore<br />
MTA-Washington<br />
MTA-New York<br />
London Bus<br />
KMB-Hong Kong<br />
Dublin<br />
CTA-Chicago<br />
Translink-Vancouver<br />
Toei - Tokyo<br />
TMB-Barcelona<br />
Sydney Bus<br />
SMRT-Singapore<br />
SL-Stockholm<br />
SBST-Singapore<br />
MTA-Washington<br />
MTA-New York<br />
London Bus<br />
KMB-Hong Kong<br />
Dublin<br />
CTA-Chicago<br />
System Utilisation - Annual ridership (million) per bus<br />
0 0.05 0.1 0.15 0.2 0.25 0.3 0.35<br />
Fare Level - Average fare per boarding<br />
0 $0.2 $0.4 $0.6 $0.8 $1.0 $1.2 $1.4 $1.6 $1.8 $2.0<br />
Operation Efficiency - Operating cost per boarding<br />
JOURNEYS | <strong>November</strong> <strong>2011</strong><br />
References<br />
S$, PPP<br />
S$, PPP<br />
$0.0 $0.5 $1.0 $1.5 $2.0 $2.5 $3.0 $3.5 $4.0 $4.5<br />
77
The <strong>LTA</strong> <strong>Academy</strong> was launched in September 2006 by the Singapore Land Transport Authority.<br />
The <strong>Academy</strong> aims to be a global knowledge hub in urban transport. It serves as a one-stop focal<br />
point for government officials and professionals around the world to tap on Singapore’s knowhow<br />
and exchange international best practices in urban transport management and development.<br />
The <strong>LTA</strong> <strong>Academy</strong>’s Advisory Board provides high-level advice on strategic directions and major<br />
initiatives for the <strong>Academy</strong> to establish itself as a leading land transport institution in the world.<br />
The Advisory Board comprises the following international ensemble of distinguished members:<br />
Professor Cham Tao Soon (Chair)<br />
Chancellor and Chairman, SIM University, Singapore<br />
President Emeritus, Nanyang Technological University, Singapore<br />
Professor Henry Fan<br />
Professor, School of Civil and Environmental Engineering, Nanyang Technological University,<br />
Singapore<br />
Professor Fwa Tien Fang<br />
Director, Centre for Transportation Research, National University of Singapore, Singapore<br />
Professor Phang Sock Yong<br />
Professor of Economics and Interim Dean, School of Economics, Singapore Management University<br />
Singapore<br />
O P Agarwal<br />
Vice President, Institute of Urban Transport, India and Senior Transport Specialist, World Bank<br />
Professor Lu Hua Pu<br />
Director, Institute of Transportation Engineering, Tsinghua University, China<br />
Professor Anthony May<br />
Emeritus Professor of Transport Engineering, University of Leeds, United Kingdom<br />
Michael Replogle<br />
Global Policy Director, President Emeritus and Founder, Institute for Transportation and Development<br />
Policy (ITDP), United States of America<br />
JOURNEYS is a biannual publication of the <strong>Academy</strong>. It provides a platform for the <strong>Academy</strong><br />
to showcase and share urban transport trends, policies, technologies and challenges in different<br />
cities. It is also one of the key resources to complement and enhance the learning experience of<br />
participants at the <strong>Academy</strong>’s programmes.
<strong>LTA</strong> <strong>Academy</strong><br />
Land Transport Authority<br />
1 Hampshire Road<br />
Singapore 219428<br />
www.<strong>LTA</strong>academy.gov.sg