Parameter Uncertainty in CGE Modeling of the Macroeconomic Impact
Parameter Uncertainty in CGE Modeling of the Macroeconomic Impact
Parameter Uncertainty in CGE Modeling of the Macroeconomic Impact

You also want an ePaper? Increase the reach of your titles
YUMPU automatically turns print PDFs into web optimized ePapers that Google loves.
620<br />
End<br />
value and <strong>the</strong> benchmark year data<br />
Run <strong>the</strong> model<br />
Calculate <strong>the</strong> mean and variance <strong>of</strong> <strong>the</strong> model output<br />
for <strong>the</strong> K runs<br />
End<br />
Calculate <strong>the</strong> importance measure <strong>of</strong> uncerta<strong>in</strong> parameter i<br />
(def<strong>in</strong>ed as <strong>the</strong> difference between <strong>the</strong> maximum and<br />
m<strong>in</strong>imum mean output value over its si po<strong>in</strong>ts)<br />
End<br />
Rank <strong>the</strong> parameters by <strong>the</strong> value <strong>of</strong> <strong>the</strong>ir importance measure<br />
All beta variates were generated based on a rejection-acceptance<br />
algorithm (algorithm BS) [17] . The random<br />
data matrix can ei<strong>the</strong>r be generated us<strong>in</strong>g a crude<br />
Monte Carlo algorithm or some form <strong>of</strong> stratified sampl<strong>in</strong>g,<br />
such as Lat<strong>in</strong> hypercube sampl<strong>in</strong>g (LHS). LHS<br />
was used <strong>in</strong> this study to reduce <strong>the</strong> computation cost<br />
us<strong>in</strong>g s<strong>of</strong>tware developed <strong>in</strong> Visual Basic to call for <strong>the</strong><br />
execution <strong>of</strong> <strong>the</strong> general algebraic model<strong>in</strong>g system<br />
(GAMS) solution <strong>of</strong> TED<strong>CGE</strong>.<br />
3 Data and Results<br />
The model was calibrated to a set <strong>of</strong> data for Ch<strong>in</strong>a <strong>in</strong><br />
1997. The data was aggregated <strong>in</strong>to three broad categories:<br />
detailed economic accounts, which are ideally<br />
ma<strong>in</strong>ta<strong>in</strong>ed <strong>in</strong> <strong>the</strong> form <strong>of</strong> a social account<strong>in</strong>g matrix<br />
(SAM); structural parameters; and some subsidiary<br />
data. The National Bureau <strong>of</strong> Statistics <strong>of</strong> Ch<strong>in</strong>a<br />
(NBSC) [18] discovered <strong>the</strong> <strong>in</strong>come and expenditures for<br />
each household category, <strong>the</strong> imports and exports for<br />
Ts<strong>in</strong>ghua Science and Technology, October 2006, 11(5): 617-624<br />
each sector, <strong>the</strong> labor and capital under each <strong>of</strong> <strong>the</strong><br />
production sectors as well as <strong>the</strong>ir level <strong>of</strong> output, <strong>the</strong><br />
transformation matrix between <strong>in</strong>dustrial output and<br />
consumer goods, <strong>the</strong> <strong>in</strong>vestments by sector, and government<br />
revenues and expenditures. Before calibration,<br />
a number <strong>of</strong> adjustments to <strong>the</strong> orig<strong>in</strong>al <strong>in</strong>put/output<br />
(I/O) table were necessary with <strong>the</strong> SAM used to impose<br />
a general equilibrium structure on <strong>the</strong> economy,<br />
s<strong>in</strong>ce many <strong>in</strong>consistencies or “residuals” may exist <strong>in</strong><br />
<strong>the</strong> I/O table. In addition, <strong>the</strong> 50 elasticities <strong>of</strong> substitution<br />
<strong>in</strong> <strong>the</strong> model were predef<strong>in</strong>ed based on literature<br />
values before calibration.<br />
3.1 Uncerta<strong>in</strong>ties <strong>in</strong> <strong>the</strong> <strong>in</strong>put parameters<br />
Statistical <strong>in</strong>formation for <strong>the</strong> probability density functions<br />
for each parameter such as <strong>the</strong> mode (most likely<br />
value), <strong>the</strong> endpo<strong>in</strong>ts (<strong>the</strong> 0.00 and 1.00 fractiles) and<br />
<strong>the</strong> level <strong>of</strong> variance <strong>of</strong> each uncerta<strong>in</strong> parameter were<br />
derived from exist<strong>in</strong>g literature data. All <strong>the</strong> elasticity<br />
parameters selected as uncerta<strong>in</strong> <strong>in</strong> <strong>the</strong> model are<br />
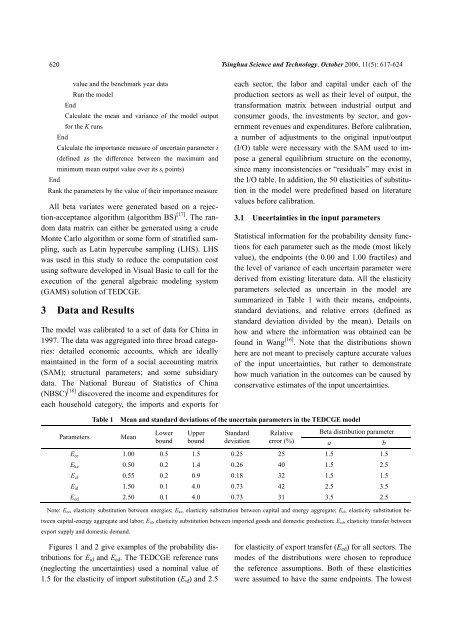
summarized <strong>in</strong> Table 1 with <strong>the</strong>ir means, endpo<strong>in</strong>ts,<br />
standard deviations, and relative errors (def<strong>in</strong>ed as<br />
standard deviation divided by <strong>the</strong> mean). Details on<br />
how and where <strong>the</strong> <strong>in</strong>formation was obta<strong>in</strong>ed can be<br />
found <strong>in</strong> Wang [16] . Note that <strong>the</strong> distributions shown<br />
here are not meant to precisely capture accurate values<br />
<strong>of</strong> <strong>the</strong> <strong>in</strong>put uncerta<strong>in</strong>ties, but ra<strong>the</strong>r to demonstrate<br />
how much variation <strong>in</strong> <strong>the</strong> outcomes can be caused by<br />
conservative estimates <strong>of</strong> <strong>the</strong> <strong>in</strong>put uncerta<strong>in</strong>ties.<br />
Table 1 Mean and standard deviations <strong>of</strong> <strong>the</strong> uncerta<strong>in</strong> parameters <strong>in</strong> <strong>the</strong> TED<strong>CGE</strong> model<br />
<strong>Parameter</strong>s Mean<br />
Lower<br />
bound<br />
Upper<br />
bound<br />
Standard<br />
deviation<br />
Relative<br />
error (%)<br />
Beta distribution parameter<br />
a b<br />
Eee 1.00 0.5 1.5 0.25 25 1.5 1.5<br />
Eke 0.50 0.2 1.4 0.26 40 1.5 2.5<br />
Ecl 0.55 0.2 0.9 0.18 32 1.5 1.5<br />
Eid 1.50 0.1 4.0 0.73 42 2.5 3.5<br />
Eed 2.50 0.1 4.0 0.73 31 3.5 2.5<br />
Note: Eee, elasticity substitution between energies; Eke, elasticity substitution between capital and energy aggregate; Ecl, elasticity substitution be-<br />
tween capital-energy aggregate and labor; Eid, elasticity substitution between imported goods and domestic production; Eed, elasticity transfer between<br />
export supply and domestic demand.<br />
Figures 1 and 2 give examples <strong>of</strong> <strong>the</strong> probability distributions<br />
for Eid and Eed. The TED<strong>CGE</strong> reference runs<br />
(neglect<strong>in</strong>g <strong>the</strong> uncerta<strong>in</strong>ties) used a nom<strong>in</strong>al value <strong>of</strong><br />
1.5 for <strong>the</strong> elasticity <strong>of</strong> import substitution (Eid) and 2.5<br />
for elasticity <strong>of</strong> export transfer (Eed) for all sectors. The<br />
modes <strong>of</strong> <strong>the</strong> distributions were chosen to reproduce<br />
<strong>the</strong> reference assumptions. Both <strong>of</strong> <strong>the</strong>se elasticities<br />
were assumed to have <strong>the</strong> same endpo<strong>in</strong>ts. The lowest