Parameter Uncertainty in CGE Modeling of the Macroeconomic Impact
Parameter Uncertainty in CGE Modeling of the Macroeconomic Impact
Parameter Uncertainty in CGE Modeling of the Macroeconomic Impact

You also want an ePaper? Increase the reach of your titles
YUMPU automatically turns print PDFs into web optimized ePapers that Google loves.
WANG Can (王 灿) et al:<strong>Parameter</strong> <strong>Uncerta<strong>in</strong>ty</strong> <strong>in</strong> <strong>CGE</strong> Model<strong>in</strong>g <strong>of</strong>… 621<br />
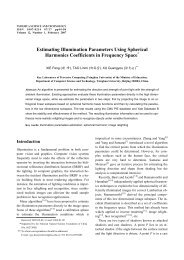
endpo<strong>in</strong>t was set at 0 and <strong>the</strong> highest was set at 4.0.<br />
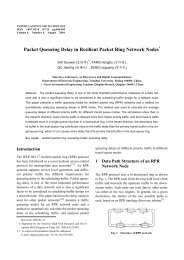
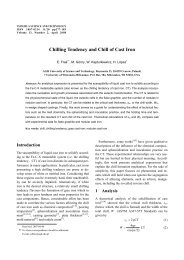
The result<strong>in</strong>g distribution for import substitution elasticity<br />
was modeled by a beta distribution with parameters<br />
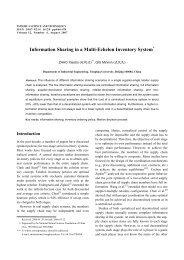
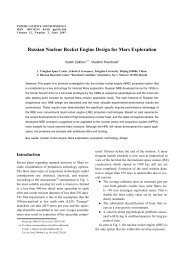
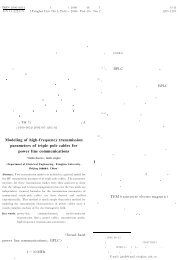
a = 2.5 and b = 3.5, while <strong>the</strong> beta parameters for<br />
export transfer elasticity were a = 3.5 and b = 2.5.<br />
Fig. 1 Probability distribution for elasticity <strong>of</strong> import<br />
substitution<br />
Fig. 2 Probability distribution for elasticity <strong>of</strong> export<br />
transfer<br />
3.2 <strong>Uncerta<strong>in</strong>ty</strong> <strong>in</strong> <strong>the</strong> TED<strong>CGE</strong> outputs<br />
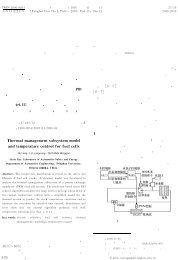
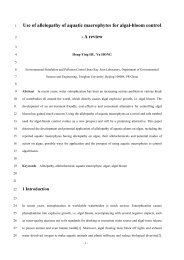
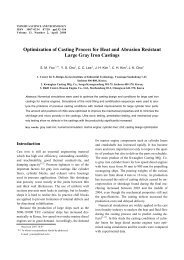
Figure 3 shows <strong>the</strong> probability distributions for carbon<br />
tax rates required to achieve <strong>the</strong> carbon reduction goals<br />
<strong>of</strong> 10%, 20%, 30%, and 40% compared with <strong>the</strong> BAU<br />
scenario for 2010 <strong>in</strong> Ch<strong>in</strong>a. 5000 repetitions <strong>of</strong> <strong>the</strong><br />
Monte Carlo experiment were first used to formulate<br />
<strong>the</strong> probability distributions. The Monte Carlo experiments<br />
were <strong>the</strong>n repeated to get ano<strong>the</strong>r probability<br />
distribution. The errors <strong>in</strong> <strong>the</strong> means and variances<br />
from <strong>the</strong>se two experiments were found to be less than<br />
1%, which means that <strong>the</strong> 5000 Monte Carlo simulations<br />
give sufficiently accurate results. The implications<br />
<strong>of</strong> <strong>the</strong> uncerta<strong>in</strong>ties are important when evaluat<strong>in</strong>g<br />
<strong>the</strong> performance <strong>of</strong> a carbon tax policy for a carbon<br />
mitigation strategy, but even <strong>in</strong> <strong>the</strong> absence <strong>of</strong> a policy<br />
<strong>the</strong> uncerta<strong>in</strong>ties <strong>in</strong> <strong>the</strong> carbon tax rates have implications<br />
for <strong>in</strong>terpret<strong>in</strong>g results. What is <strong>of</strong>ten called a<br />
marg<strong>in</strong>al abatement cost curve for <strong>the</strong> <strong>in</strong>ternational<br />
carbon emission trad<strong>in</strong>g model is <strong>in</strong> fact only one series<br />
<strong>of</strong> values from a series <strong>of</strong> distributions <strong>of</strong> possible<br />
values, given <strong>the</strong> uncerta<strong>in</strong> parameters exist<strong>in</strong>g <strong>in</strong> <strong>the</strong><br />
model. Policy analysis with models on carbon emission<br />
trad<strong>in</strong>g should be viewed <strong>in</strong> this context.<br />
Fig. 3 Probability distribution <strong>of</strong> carbon tax rate response<br />
to carbon reduction rates<br />
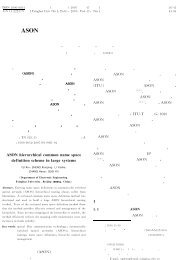
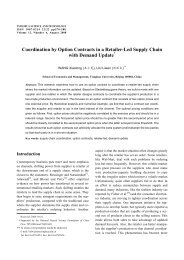
The mean (bold middle l<strong>in</strong>e), <strong>the</strong> 95% and 100%<br />
confidence <strong>in</strong>tervals, and <strong>the</strong> relative error for <strong>the</strong> marg<strong>in</strong>al<br />
abatement cost curve <strong>in</strong> 2010 for Ch<strong>in</strong>a calculated<br />
by TED<strong>CGE</strong> are illustrated <strong>in</strong> Fig. 4. The results<br />
show <strong>in</strong>creas<strong>in</strong>g means and variances for <strong>the</strong> abatement<br />
cost as <strong>the</strong> carbon reduction goal <strong>in</strong>creases. In<br />
addition, <strong>the</strong> relative error <strong>in</strong> <strong>the</strong> TED<strong>CGE</strong> output is<br />
much smaller than <strong>the</strong> error <strong>in</strong> <strong>the</strong> <strong>in</strong>put parameters<br />
(see Table 1).<br />
Fig. 4 Marg<strong>in</strong>al abatement cost curve with parameter<br />
uncerta<strong>in</strong>ties<br />
The results show that if <strong>the</strong> <strong>in</strong>put parameter statistical<br />
<strong>in</strong>formation is fully provided, <strong>the</strong> <strong>CGE</strong> model outputs<br />
also exhibit statistical characteristics reflect<strong>in</strong>g <strong>the</strong><br />
uncerta<strong>in</strong>ties transmitted from <strong>the</strong> <strong>in</strong>puts to <strong>the</strong> simulation<br />
results. Although parameter uncerta<strong>in</strong>ties throw<br />
doubt on <strong>the</strong> reliability <strong>of</strong> <strong>the</strong> <strong>CGE</strong> model simulation<br />
results, <strong>the</strong> <strong>in</strong>put uncerta<strong>in</strong>ties are reduced to some extent<br />
through <strong>the</strong> <strong>CGE</strong> model<strong>in</strong>g procedure.