Chilling Tendency and Chill of Cast Iron
Chilling Tendency and Chill of Cast Iron
Chilling Tendency and Chill of Cast Iron

Create successful ePaper yourself
Turn your PDF publications into a flip-book with our unique Google optimized e-Paper software.
TSINGHUA SCIENCE AND TECHNOLOGY<br />
ISSN 1007-0214 11/20 pp177-183<br />
Volume 13, Number 2, April 2008<br />
<strong><strong>Chill</strong>ing</strong> <strong>Tendency</strong> <strong>and</strong> <strong>Chill</strong> <strong>of</strong> <strong>Cast</strong> <strong>Iron</strong><br />
E. Fraś ** , M. Górny, W. Kapturkiewicz, H. López †<br />
AGH University <strong>of</strong> Science <strong>and</strong> Technology, Reymonta 23, 30-059 Cracow, Pol<strong>and</strong>;<br />
† University <strong>of</strong> Wisconsin-Milwaukee, P.O. Box 784, Milwaukee, WI 53201, USA<br />
Abstract: An analytical expression is presented for the susceptibility <strong>of</strong> liquid cast iron to solidify according to<br />
the Fe-C-X metastable system (also known as the chilling tendency <strong>of</strong> cast iron, CT). The analysis incorpo-<br />
rates the nucleation <strong>and</strong> growth processes associated with the eutectic transformation. The CT is related to<br />
the physicochemical state <strong>of</strong> the liquid, the eutectic cells in the flake graphite, <strong>and</strong> the number <strong>of</strong> nodules in<br />
nodular cast iron. In particular, the CT can be related to the critical wall thickness, scr, or the chill width, Wcr,<br />
in wedge shaped castings. Finally, this work serves as a guide for underst<strong>and</strong>ing the effect <strong>of</strong> technical fac-<br />
tors such as the melt chemistry, the spheroidizing <strong>and</strong> inoculation practice, <strong>and</strong> the holding time <strong>and</strong> tem-<br />
perature on the resultant CT <strong>and</strong> chill <strong>of</strong> the cast iron. Theoretical calculations <strong>of</strong> scr <strong>and</strong> Wcr compare well<br />
with experimental data for flake graphite <strong>and</strong> nodular cast iron.<br />
Key words: chill; chilling tendency; gray cast iron; nodular cast iron<br />
Introduction<br />
The susceptibility <strong>of</strong> liquid cast iron to solidify according<br />
to the Fe-C-X metastable system (i.e. the chilling<br />
tendency,CT) <strong>of</strong> cast iron dictates its subsequent performance<br />
in many applications. In particular, cast irons<br />
possessing a high chilling tendency are prone to develop<br />
zones <strong>of</strong> white or mottled iron. Considering that<br />
these regions can be extremely hard, their machinability<br />
can be severely impaired. Alternatively, if white<br />
iron is the desired structure, a relatively small chilling<br />
tendency f1avours the formation <strong>of</strong> grey iron which in<br />
turn leads to poor hardness <strong>and</strong> wear properties for the<br />
cast components. Hence, considerable effort has been<br />
made to correlate the various factors affecting the chill<br />
<strong>of</strong> cast iron such as chemical composition [1-4] , pouring<br />
temperature [2] , spheroidization <strong>and</strong> inoculation treatment<br />
[2,3,5,6] , casting geometry [7] , plate thickness [2,3,7] ,<br />
mold material [8] , <strong>and</strong> nodule count [1] .<br />
**<br />
Received: 2007-06-06<br />
To whom correspondence should be addressed.<br />
E-mail: edfras@agh.edu.pl<br />
Furthermore, some works [4,5] have given qualitative<br />
descriptions <strong>of</strong> the influence <strong>of</strong> the chemical composition<br />
<strong>and</strong> spheroidization <strong>and</strong> inoculation practice on<br />
the CT. These experimental relationships are very useful<br />
but are limited in their physical meaning. Accordingly,<br />
this work presents analytical expressions that<br />
explain the chill formation mechanism. For the sake <strong>of</strong><br />
simplicity, this paper focuses on phenomena <strong>and</strong> results<br />
which still hold when one ignores the segregation<br />
effects <strong>of</strong> alloying elements, such as silicon, manganese,<br />
including the so-called inverse chill.<br />
1 Analysis<br />
A theoretical analysis <strong>of</strong> the solidification <strong>of</strong> cast<br />
iron [9,10] showed that the critical wall thickness, scr,<br />
(below which, the chill is formed) <strong>and</strong> the width <strong>of</strong> the<br />
total chill, W (ASTM A367-55T St<strong>and</strong>ard) can be<br />
given by<br />
s = 2pCT (1)<br />
cr<br />
4np<br />
W = CT<br />
(2)<br />
cos /2<br />
( α )
178<br />
where for flake graphite cast iron,<br />
or<br />
5 3<br />
s<br />
e<br />
3<br />
φ<br />
2<br />
ef<br />
1/6<br />
a ⎛ 2 T ⎞<br />
p = ⎜ ⎟ (3)<br />
π ⎝L c ⎠<br />
⎡ 1<br />
⎛ b ⎞⎤<br />
CT = ⎢ exp<br />
3 8 ⎜ ⎟⎥<br />
⎢Ns( 1 fγ) µ T ∆T<br />
⎣<br />
− ∆ sc ⎝ sc ⎠⎦⎥<br />
⎡ 1<br />
CT = ⎢<br />
⎢⎣<br />
N ( 1 − f ) µ ∆T<br />
<strong>and</strong> for ductile cast iron,<br />
or<br />
⎛<br />
p = a ⎜<br />
⎝4<br />
π<br />
3 8<br />
cr γ sc<br />
T<br />
3<br />
s<br />
5 2 2 2 4<br />
β B Lez c<br />
⎤<br />
⎥<br />
⎥⎦<br />
⎞<br />
⎟<br />
⎠<br />
1/6<br />
1/6<br />
1 ⎡ 1 ⎛ b ⎞⎤<br />
CT = exp<br />
1/2 ⎢ 2 ⎜ ⎟⎥<br />
D ⎢⎣Ns β ∆Tsc ⎝∆Tsc ⎠⎥⎦<br />
1/3<br />
1/3<br />
1/6<br />
(4)<br />
(5)<br />
(6)<br />
(7)<br />
1 ⎡ 1 ⎤<br />
CT = 1/2 ⎢<br />
2<br />
D ⎣Ncr β ∆Tsc⎦<br />
⎥ (8)<br />
∆ Tsc = Ts− Tc<br />
(9)<br />
φ = cef B1+ cB2<br />
(10)<br />
Tsinghua Science <strong>and</strong> Technology, April 2008, 13(2): 177-183<br />
T T T<br />
B= ln , B = ln , B2=<br />
ln<br />
T T<br />
i l<br />
1<br />
1 s<br />
L<br />
γ<br />
cef = c+ Tlγ−Ts i<br />
T 1<br />
(11)<br />
(12)<br />
z=0.41+0.93B (13)<br />
In these equations CT is the chilling tendency <strong>of</strong> the<br />
cast iron; Ns <strong>and</strong> b are the nucleation coefficients for<br />
flake graphite or nodular cast iron; fγ is the proeutectic<br />
austenite volume fraction; a is the material mould abil-<br />
ity to absorb heat; cef is the effective specific heat <strong>of</strong><br />
the proeutectic austenite; Ti is the initial metal tem-<br />
perature just after filling the mould; φ is the heat transfer<br />
coefficient; α is the wedge angle; ∆ T = T −T<br />
<strong>and</strong><br />
sc s c<br />
c, D, Le<br />
, Lγ , Tl , Tlγ , Ts , Tc , µ , <strong>and</strong> β are defined in<br />
Table 1; Ncr is the critical cells or nodule count at tem-<br />
perature T≈Tc; <strong>and</strong> n is the wedge size coefficient<br />
which expresses the influence <strong>of</strong> wedge size on the<br />
chill width. The ProductLog [y]=x is the Lambert func-<br />
tion, also known as the omega function which can be<br />
easily calculated by means <strong>of</strong> the instruction Product-<br />
Log [y] in Mathematica.<br />
Table 1 Selected thermophysical data<br />
Parameter Value<br />
Latent heat <strong>of</strong> graphite eutectic L e=2028.8 J/cm 3<br />
Latent heat <strong>of</strong> austenite L γ=1904.4 J/cm 3<br />
Specific heat <strong>of</strong> cast iron c=5.95 J/(cm 3 · ℃ )<br />
9.2 6.3Si 10 −<br />
Growth coefficient <strong>of</strong> graphite eutectic µ= ( )<br />
0.25 6<br />
− × cm/(℃ 2 ·s)<br />
Material mould ability to absorb heat a=0.10 J/(cm 2 ·s 1/2 · ℃ )<br />
The diffusion coefficient <strong>of</strong> carbon in austenite D = 3.9 10 −6 cm 2 /s<br />
Coefficient related with the slopes <strong>of</strong> the solubility lines JE’, E’S’, <strong>and</strong> BC’<br />
in Fe-C system<br />
β = 0.001 55℃ –1<br />
Liquidus temperature for austenite T l=[1636 –113(C+0.25Si+0.5P)]℃<br />
Formation temperature for cementite eutectic Tc=[1130.56+4.06(C–3.33Si–12.58P)]℃<br />
Graphite eutectic equilibrium temperature T s=[1154.0+5.25Si–14.88P]℃<br />
Carbon content in graphite eutectic C e=(4.26–0.30Si–0.36P)%<br />
Maximum carbon content in austenite at Ts<br />
Liquidus temperature <strong>of</strong> austenite for austenite composition C γ<br />
C γ=(2.08–0.11Si–0.35P)%<br />
Weight fraction <strong>of</strong> austenite g γ=(C e–C)/(C e–C γ)<br />
Austenite density ρ γ=7.51 g/cm 3<br />
Melt density ρ m=7.1 g/cm 3<br />
T lγ=[1636–113(2.08+0.15Si+0.14P)]℃<br />
Volume fraction <strong>of</strong> proeutectic austenite f γ=ρ m g γ/[ρ γ+g γ(ρ m–ρ γ)]<br />
Note: C, Si, <strong>and</strong> P indicate content <strong>of</strong> carbon, silicon, <strong>and</strong> phosphorus in the cast iron, %.
E. Fraś et al:<strong><strong>Chill</strong>ing</strong> <strong>Tendency</strong> <strong>and</strong> <strong>Chill</strong> <strong>of</strong> <strong>Cast</strong> <strong>Iron</strong> 179<br />
The theoretical predictions agree qualitatively with<br />
the available data in the literature. In particular, it is<br />
well known that the chill <strong>of</strong> cast iron decreases with<br />
increasing eutectic cell or nodule count N (<strong>and</strong> in consequence<br />
Ncr) as a result <strong>of</strong> inoculation, as well as decreased<br />
heating times <strong>and</strong> decreased bath superheating<br />
temperature [11] . It is also known that increasing C <strong>and</strong><br />
Si in the cast iron reduces the chill [11] . An increase in<br />
the carbon (1) increases the eutectic cell count in<br />
uninoculated cast iron or the number <strong>of</strong> nodules<br />
(Ncr) [11] , (2) decreases the proeutectic austenite fraction<br />
fγ (Table 1), (3) slightly narrows the ∆Tsc range (Eq. (9)<br />
<strong>and</strong> Table 1) <strong>and</strong> (4) decreases the austenite liquidus<br />
temperature Tl. Points 1 <strong>and</strong> 2 are the main reason for<br />
the reduction in the chill by carbon (Eqs. (1) <strong>and</strong> (2)).<br />
An increase in the silicon (1) reduces the growth coefficient<br />
for graphite eutectic µ (Table 1), (2) increases<br />
the cell or the number <strong>of</strong> nodules (Ncr) [11] , (3) decreases<br />
the proeutectic austenite fraction fγ (Table 1), (4)<br />
widens the ∆Tsc range (Eq. (9) <strong>and</strong> Table 1), <strong>and</strong> (5)<br />
decreases the austenite liquidus temperature Tl. The effects<br />
<strong>of</strong> increases in the number <strong>of</strong> cells or nodules <strong>and</strong><br />
<strong>of</strong> the proeutectic austenite fraction are the most important<br />
<strong>and</strong> as a result silicon reduces the chill (Eqs. (1)<br />
<strong>and</strong> (2)).<br />
In addition, the critical plate wall thicknesses, scr,<br />
<strong>and</strong> the wedge chill widths, W, according to Eqs. (1),<br />
(2), (3), <strong>and</strong> (6) increase as the ability <strong>of</strong> the mold to<br />
absorb heat, a, increases. scr <strong>and</strong> W also depend on B,<br />
B1, <strong>and</strong> B2 (Eq. (11)) <strong>and</strong>, hence, on the initial temperature,<br />
Ti, <strong>of</strong> the cast iron just after pouring into the<br />
mould. Higher pouring temperatures, Tp, will result in<br />
higher Ti. Therefore, decreasing Tp reduces φ parameter<br />
(Eq. (10)), thus increasing scr <strong>and</strong> W (Eqs. (1) <strong>and</strong> (2)).<br />
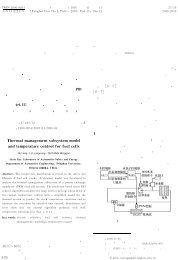
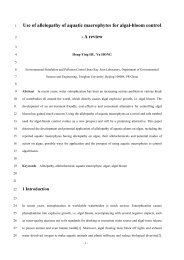
A schematic diagram showing the role <strong>of</strong> the various<br />
factors on the chilling tendency <strong>and</strong> the chill <strong>of</strong> cast<br />
iron is given in Fig. 1.<br />
Fig. 1 Schematic representation <strong>of</strong> the effect <strong>of</strong> various factors on the chilling tendency
180<br />
2 Experimental Procedure<br />
2.1 Flake graphite cast iron<br />
Experimental melts were made in a 15-kg capacity<br />
crucible <strong>of</strong> an electric induction furnace. The raw materials<br />
were pig iron, steel scrap, commercially pure<br />
silicon, <strong>and</strong> Fe-P <strong>and</strong> Fe-S alloys. Melting was followed<br />
by liquid iron superheating up to 1420℃ <strong>and</strong><br />
inoculation using FOUNDRYSIL with a 0.2-0.5-cm<br />
granulation <strong>and</strong> added as 0.5 % <strong>of</strong> the total charge<br />
weight. After various time intervals (1.5, 5, 10, 15, 20,<br />
<strong>and</strong> 25 min) from the instant <strong>of</strong> inoculation, the cast<br />
iron was poured into plate shaped molds <strong>of</strong> s=0.6, 1.0,<br />
1.6, 2.2, <strong>and</strong> 3.0 cm in thickness. The average chemical<br />
composition <strong>of</strong> cast iron was 3.18% C, 1.91% Si,<br />
0.13% Mn, 0.092% P, <strong>and</strong> 0.064% S. In all cases, the<br />
plates had a common gating system. The foundry<br />
molds were prepared using conventional molding s<strong>and</strong>.<br />
In addition, they were instrumented with Pt/PtRh10<br />
thermocouples enclosed in quartz sleeves. The thermocouple<br />
tips were located in the geometric center <strong>of</strong><br />
each mold cavity. An Agilent 34970A electronic module<br />
was used to record the cooling curves which were<br />
used to determine the initial metal temperature Ti just<br />
after the mold filling <strong>and</strong> the maximum undercooling,<br />
2.2 Ductile cast iron<br />
Tsinghua Science <strong>and</strong> Technology, April 2008, 13(2): 177-183<br />
∆Tm, at the onset <strong>of</strong> eutectic solidification. After cooling,<br />
specimens were taken for metallographic examination<br />
from the geometric centers <strong>of</strong> the plates. Metallographic<br />
examinations were made on polished <strong>and</strong><br />
etched (stead reagent) specimens to show the graphite<br />
eutectic cell boundaries. The planar microstructure was<br />
characterized by the average number <strong>of</strong> eutectic cells<br />
NF per unit area (cell count) [12]<br />
N<br />
N + 0.5 N<br />
F<br />
+ 1<br />
i w<br />
F = (14)<br />
where Ni is the number <strong>of</strong> eutectic cells inside a rectangle<br />
S, Nw is the number <strong>of</strong> eutectic cells that intersect<br />
the sides <strong>of</strong> S but not their corners <strong>and</strong> F is the surface<br />
area <strong>of</strong> S. The average number <strong>of</strong> eutectic cells N<br />
per unit volume (volumetric cell count) was given<br />
by [13]<br />
N ≅ 0.568 N<br />
(15)<br />
3/2<br />
F<br />
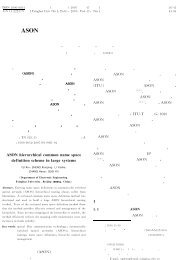
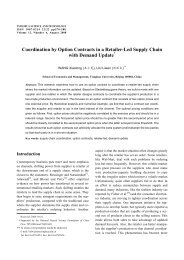
Wedges with Bw=1.25 cm <strong>and</strong> α=28.5 o <strong>and</strong> samples<br />
for chemical composition measurement were also cast<br />
simultaneously with the plates. Figure 2 shows typical<br />
planar microstructures <strong>of</strong> the wedges. The width, W, <strong>of</strong><br />
the total chill <strong>and</strong> the critical cell count, Ncr, were<br />
measured at the junction <strong>of</strong> the gray structure with the<br />
first spot <strong>of</strong> cementite as shown in Fig. 2.<br />
Fig. 2 Exhibited microstructure in wedge-shaped <strong>of</strong> flake graphite castings<br />
The test melts were made in an electric induction furnace<br />
having 8000 kg capacity. The raw materials were<br />
iron scrap, steel scrap, <strong>and</strong> commercially pure silicon.<br />
After melting <strong>and</strong> preheating at 1485 ℃ , the cast iron<br />
was poured into a casting ladle where it was spheroidized<br />
using the cored wired injection method. Different<br />
inoculants in various amounts were used. The aim<br />
<strong>of</strong> using different inoculants <strong>and</strong> inoculation processes<br />
was to induce different maximum undercoolings, ∆Tm,<br />
<strong>and</strong> various nodule counts N. The average chemical<br />
composition <strong>of</strong> the nodular iron was 3.69% C, 2.63%<br />
Si, 0.42% Mn, 0.02% P, 0.02% S, <strong>and</strong> 0.04% Mg. The<br />
nodular cast iron was poured into the same molds as<br />
for the gray cast iron. The cooling curves <strong>and</strong> metallographic<br />
structure were examined in the same way as<br />
for the gray cast iron. In the nodular cast iron the
E. Fraś et al:<strong><strong>Chill</strong>ing</strong> <strong>Tendency</strong> <strong>and</strong> <strong>Chill</strong> <strong>of</strong> <strong>Cast</strong> <strong>Iron</strong> 181<br />
graphite nodules were characterized by Raleigh distributions<br />
[14] so the volumetric nodule count, N, could<br />
be related to the planar nodule count, NnF, using the<br />
Wiencek equation [15]<br />
N<br />
3<br />
NF<br />
= (16)<br />
f<br />
where fgr is the volume fraction <strong>of</strong> graphite at room<br />
temperature, fgr≈0.11-0.14.<br />
3 Results <strong>and</strong> Discussion<br />
3.1 Flake graphite cast iron<br />
The experimentally determined ∆Tm <strong>and</strong> N were used<br />
with [16,17]<br />
Case<br />
No.<br />
td<br />
s<br />
gr<br />
⎛ b ⎞<br />
N = N exp −<br />
⎜<br />
⎝ ∆Tm<br />
⎠ ⎟<br />
∆Tsc/℃<br />
(17)<br />
Table 2 Experimental <strong>and</strong> calculated results<br />
Nucleation coefficients<br />
Ns/cm −3<br />
I/1 — 35.2 1.6×10 5<br />
I/2 0.06 51.1 6.1×10 6<br />
I/3 0.20 52.3 6.8×10 6<br />
I/4 0.40 52.3 4.4×10 6<br />
I/5 0.60 51.5 5.4×10 6<br />
I/6 0.80 53.0 1.3×10 6<br />
I/7 1.00 52.9 8.4×10 5<br />
to determine the nucleation coefficients Ns <strong>and</strong> b by<br />
statistical methods (shown in Table 2). In all cases, the<br />
correlation coefficients were high (0.86-0.99) so the re-<br />
lationship between N <strong>and</strong> ∆Tm described by Eq. (17) is<br />
in good agreement with the experimental evidence.<br />
The nucleation coefficients Ns <strong>and</strong> b can be related to a<br />
dimensionless time t = t/ t , where t is the time calcu-<br />
d<br />
r<br />
lated from the instant in which the inoculant was intro-<br />
duced into the melt <strong>and</strong> tr<br />
is the time when the observed<br />
changes in the cell count were negligible (tr=25 min).<br />
b/℃<br />
Note: Mean temperature (just after pouring) <strong>of</strong> wedge Ti ≈ 1270℃, n=0.877<br />
The chilling tendency, CT, <strong>and</strong> the total width <strong>of</strong> the<br />
chill, W, can be estimated from Eqs. (2) <strong>and</strong> (4) as<br />
functions <strong>of</strong> the chemical composition <strong>of</strong> the cast iron,<br />
the nucleation coefficients, the mean initial temperature<br />
<strong>of</strong> wedge, Ti, the wedge size coefficients n in the<br />
note <strong>of</strong> Table 2, <strong>and</strong> thermophysical data in Table 1.<br />
The results in Table 2 show that the theoretical predictions<br />
agree well with the experimental results.<br />
3.2 Ductile cast iron<br />
The experimental data for ductile iron ∆Tm <strong>and</strong> N can<br />
be used with Eq. (17) to calcutate the melt nucleation<br />
coefficients, Ns <strong>and</strong> b, listed in Table 3. The correlation<br />
coefficients for all the melts are quite high (0.84-0.98).<br />
It is not surprising that the nucleation coefficients Ns<br />
<strong>and</strong> b for each melt differ. However, in each case, N<br />
( )<br />
−3<br />
N = 6.5 −0.8 t − 5.3 t × 10 cm ,<br />
2 6<br />
s d d<br />
b= (96.9 + 122.6 t − 59.2 t ) ℃ (18)<br />
Measured<br />
total width <strong>of</strong><br />
chill (mm)<br />
d<br />
Calculated<br />
total width <strong>of</strong><br />
chill (mm)<br />
2<br />
d<br />
CT/( s 1/2 ·℃ –1/3 )<br />
76.8 7.9 8.8 1.10<br />
104 3.3 3.6 0.43<br />
119 3.6 3.6 0.44<br />
135 4.0 4.1 0.50<br />
154 4.5 5.4 0.65<br />
152 4.8 5.2 0.63<br />
162 5.5 5.8 0.71<br />
<strong>and</strong> ∆Tm are related as in Eq. (17), thus confirming that<br />
the theory is in good agreement with the experimental<br />
results.<br />
Table 3 Nucleation coefficients, temperature ranges, ∆T sc,<br />
<strong>and</strong> chilling tendencies, CT, for graphite<br />
Melt<br />
Nucleation coefficients<br />
No. Ns/cm −3<br />
1 4.13×10 7<br />
2 2.95×10 8<br />
3 5.69×10 7<br />
4 4.01×10 7<br />
5 4.24×10 7<br />
6 5.16×10 7<br />
7 4.85×10 7<br />
b/℃<br />
Note: CT is calculated by Eq. (7).<br />
∆Tsc/ ℃ CT/(s 1/2 ·℃ –1/3 )<br />
58 59.7 1.14<br />
100 51.9 0.90<br />
60 56.9 1.09<br />
42 58.9 1.07<br />
20 61.2 0.90<br />
20 60.9 0.84<br />
43 59.2 1.00
182<br />
The chilling tendency CT can be calculated from Eq.<br />
(7) as a function <strong>of</strong> the chemical composition <strong>of</strong> the<br />
cast iron, Ns <strong>and</strong> b, listed in Table 3, the mean temperature<br />
<strong>of</strong> the metal just after pouring, Ti≈1260℃, <strong>and</strong> any<br />
relevant thermophysical data (shown in Table 1).<br />
Table 4 shows results for plate-shape castings reported<br />
in the literature [4] with various chemical compositions<br />
<strong>and</strong> wall thicknesses, as well as the number <strong>of</strong><br />
nodules <strong>and</strong> the cementite fraction. In these cases, the<br />
nucleation coefficients b <strong>and</strong> Ns are not known, so CT<br />
is calulated using Eq. (8). The results in Table 4 show<br />
that in melts I <strong>and</strong> II, chill starts to occur in walls with<br />
thicknesses between 3 <strong>and</strong> 6 mm, while in melt III chill<br />
starts to occur for wall thicknesses between 1.5 <strong>and</strong> 2<br />
mm. scr must be calculated using Eq. (1) to compare<br />
these results with the theoretical predictions. These<br />
calculations assumed that a=0.11 J/(cm 2 ·s 1/2 · ℃ )<br />
<strong>and</strong> Ti=1250℃ with other information taken from Table<br />
1. The results in Table 4 show that in melt I the<br />
Tsinghua Science <strong>and</strong> Technology, April 2008, 13(2): 177-183<br />
change <strong>of</strong> the wall thickness, s, from 6 mm to 3 mm is<br />
closely linked to the change in the number <strong>of</strong> nodules<br />
from 588 to 1039 mm −2 . As a result, an average nodule<br />
count <strong>of</strong> NF,cr=813 mm −2 was used in this work. Similar<br />
determinations were made for melts II <strong>and</strong> III with NF,cr<br />
values <strong>of</strong> 945 <strong>and</strong> 1959 mm −2 , respectively. scr for<br />
melts I, II, <strong>and</strong> III were then 3.4 mm, 3.1 mm, <strong>and</strong><br />
1.8 mm as shown in Table 4. In addition, comparison<br />
<strong>of</strong> s <strong>and</strong> scr in Table 4 indicates that the predictions<br />
from the theoretical analysis are in good agreement<br />
with the experimental determinations <strong>of</strong> the wall thickness<br />
at which chill occurs. Table 4 shows the CT for<br />
the three melts calculated using Eq. (8) <strong>and</strong> data in Table<br />
1. The results in Table 4 show that as the chilling<br />
tendency increases from 0.34 to 0.68 s 1/2 ·℃ –1/3 , the<br />
critical wall thickness, scr, increases from 1.8 to<br />
3.4 mm.<br />
Table 4 Chemical composition, wall thicknesses, nodule count, cementite fraction, <strong>and</strong> chilling tendency for three<br />
ductile cast iron melts<br />
Melt<br />
No.<br />
C/% Si/% P/%<br />
I 3.40 2.70 0.046<br />
II 3.45 2.91 0.044<br />
III 3.31 4.42 0.051<br />
4 Conclusions<br />
Wall thickness (mm)<br />
Experimental s Calculated scr<br />
(1) A simple theoretical analysis is presented which<br />
predicts the chilling tendency <strong>and</strong> chill in flake graphite<br />
<strong>and</strong> ductile cast iron based on<br />
The chemical composition <strong>of</strong> the casting which<br />
for flake graphite cast iron is characterized by ∆Tsc,<br />
fγ, T, µ, Ncr or Ns, <strong>and</strong> b, <strong>and</strong> for ductile cast iron is<br />
characterized by ∆Tsc, D, Tl, Ncr or Ns <strong>and</strong> b;<br />
The inoculation <strong>and</strong> spheroidization method, the<br />
superheating temperature, <strong>and</strong> bath holding<br />
Nodule count<br />
(NF/mm −2 )<br />
Fraction <strong>of</strong><br />
cementite (%)<br />
CT/( s 1/2 ·℃ –1/3 )<br />
6.0 588 0.0 0.68<br />
3.4<br />
3.0<br />
1039 9.0 —<br />
2.0 1380 24.0 —<br />
1.5<br />
1311 34.0 —<br />
6.0 854 0.0 0.60<br />
3.1<br />
3.0<br />
1037 7.3 —<br />
2.0 1100 24.0 —<br />
6.0 1127 0.0 —<br />
3.0<br />
1726 0.0 —<br />
2.0 1890 0.0 0.34<br />
1.8<br />
1.5<br />
2027 9.3 —<br />
times as characterized by Ncr or Ns <strong>and</strong> b;<br />
Selected thermophysical data <strong>of</strong> the metal <strong>and</strong><br />
mold material as well as the metal temperature<br />
just after pouring into the mold.<br />
(2) Theoretical calculations <strong>of</strong> the width <strong>of</strong> the total<br />
chill in wedges for flake graphite <strong>and</strong> <strong>of</strong> the critical<br />
wall thickness for nodular cast iron compare well with<br />
experimental data.<br />
(3) The absolute values <strong>of</strong> the chilling tendency <strong>of</strong><br />
cast iron are calculated to range from 0.3 to<br />
1.1 s 1/2 ·℃ –1/3 .
E. Fraś et al:<strong><strong>Chill</strong>ing</strong> <strong>Tendency</strong> <strong>and</strong> <strong>Chill</strong> <strong>of</strong> <strong>Cast</strong> <strong>Iron</strong> 183<br />
References<br />
[1] Javaid A, Thompson J, Davis K G. Critical conditions for<br />
obtaining carbide-free microstructures in thin-wall ductile<br />
irons. In: Transactions <strong>of</strong> the American Foundry Society<br />
<strong>and</strong> the One Hundred Sixth Annual <strong>Cast</strong>ing Congress.<br />
Kansas City, USA, 2002: 889-898.<br />
[2] Javaid A, Thompson J, Sahoo M, Davis K G. Factors af-<br />
fecting the formation <strong>of</strong> carbides in thin-wall DI castings.<br />
In: One Hundred Third Annual Meeting <strong>of</strong> the American<br />
Foundrymen’s Society. Rosemont, USA, 1998: 441-456.<br />
[3] Rux<strong>and</strong>a R E, Stefanescu D M, Piwonka T S. Microstruc-<br />
ture characterization <strong>of</strong> ductile thin wall iron castings. In:<br />
Transactions <strong>of</strong> the American Foundry Society <strong>and</strong> the<br />
One Hundred Sixth Annual <strong>Cast</strong>ing Congress. Kansas City,<br />
USA, 2002: 1131-1147.<br />
[4] Giacopini A, Boeri R E, Sikora J A. Carbide dissolution in<br />
thin wall ductile iron. Mats. Sci. Tech., 2003, 19(12):<br />
1755-1760.<br />
[5] Labrecque C, Gagne M, Javaid A, et al. Production <strong>and</strong><br />
properties <strong>of</strong> thin-wall ductile iron castings. Int. J. <strong>Cast</strong><br />
Metals Research, 2003, 16(1-3): 313-317.<br />
[6] Choi J H, Oh J K, Choi C O, et al. Effect <strong>of</strong> Bi on forma-<br />
tion <strong>of</strong> microstructure <strong>and</strong> mechanical properties <strong>of</strong> ductile<br />
iron castings with thin-wall section. AFS Transactions,<br />
2004, 112: 831-840.<br />
[7] Mampaey F, Xu Z A. Mold filling <strong>and</strong> solidification <strong>of</strong><br />
thin-wall ductile iron casting. AFS Transactions, 1997,<br />
105: 95-103.<br />
[8] Showman R E, Aufderheide R C. Process for thin-wall<br />
s<strong>and</strong> castings. AFS Transactions, 2003, 111: 567-578.<br />
[9] Fraś E, Górny M, López H F. The transition from gray to<br />
white cast iron during solidification: Part I. Theoretical<br />
background. Metallurgical <strong>and</strong> Materilas Transactions A,<br />
2005, 36: 3075-3082.<br />
[10] Fraś E, Górny M, López H F. Eutectic transformation in<br />
ductile cast iron. Part I. Theoretical background. Metal-<br />
lurgy <strong>and</strong> Foundry Engineering, 2005, 31: 113-136.<br />
[11] Merchant H D. Recent Research on <strong>Cast</strong> <strong>Iron</strong>, Gordon <strong>and</strong><br />
Breach. New York: Science Publishers, 1968.<br />
[12] Rys J. Stereology <strong>of</strong> Materials. Cracov: Fotobit, 1995.<br />
[13] Osher J, Lorz U. Quantitative Gefuengenanalysie. DVG:<br />
Leipzig-Stuttgard, 1994.<br />
[14] Wojnar L. Effect <strong>of</strong> graphite size <strong>and</strong> distribution on<br />
fracture <strong>and</strong> fractography <strong>of</strong> ferritic nodular cast iron. Acta<br />
Stereologica, 1986, 5(2): 319-324.<br />
[15] Wiencek K, Rys J. The estimation <strong>of</strong> Fe3C particle density<br />
in steel by simple counting measurements made in plane<br />
sections. Materialas Engineering, 1998, (3): 396-399.<br />
[16] Fraś E, Górny M, López H F. Nodule count in ductile iron:<br />
Theoretical model based on Weibull statistics. Interna-<br />
tional Journal <strong>of</strong> <strong>Cast</strong> Metals Researches, 2005, 18(3):<br />
156-162.<br />
[17] Fraś E, Górny M, Tartera J. Nucleation <strong>and</strong> grains density<br />
in grey cast iron—A theoretical model <strong>and</strong> experimental<br />
verification. International Journal <strong>of</strong> <strong>Cast</strong> Research, 2003,<br />
16: 99-104.