Chilling Tendency and Chill of Cast Iron
Chilling Tendency and Chill of Cast Iron
Chilling Tendency and Chill of Cast Iron

You also want an ePaper? Increase the reach of your titles
YUMPU automatically turns print PDFs into web optimized ePapers that Google loves.
180<br />
2 Experimental Procedure<br />
2.1 Flake graphite cast iron<br />
Experimental melts were made in a 15-kg capacity<br />
crucible <strong>of</strong> an electric induction furnace. The raw materials<br />
were pig iron, steel scrap, commercially pure<br />
silicon, <strong>and</strong> Fe-P <strong>and</strong> Fe-S alloys. Melting was followed<br />
by liquid iron superheating up to 1420℃ <strong>and</strong><br />
inoculation using FOUNDRYSIL with a 0.2-0.5-cm<br />
granulation <strong>and</strong> added as 0.5 % <strong>of</strong> the total charge<br />
weight. After various time intervals (1.5, 5, 10, 15, 20,<br />
<strong>and</strong> 25 min) from the instant <strong>of</strong> inoculation, the cast<br />
iron was poured into plate shaped molds <strong>of</strong> s=0.6, 1.0,<br />
1.6, 2.2, <strong>and</strong> 3.0 cm in thickness. The average chemical<br />
composition <strong>of</strong> cast iron was 3.18% C, 1.91% Si,<br />
0.13% Mn, 0.092% P, <strong>and</strong> 0.064% S. In all cases, the<br />
plates had a common gating system. The foundry<br />
molds were prepared using conventional molding s<strong>and</strong>.<br />
In addition, they were instrumented with Pt/PtRh10<br />
thermocouples enclosed in quartz sleeves. The thermocouple<br />
tips were located in the geometric center <strong>of</strong><br />
each mold cavity. An Agilent 34970A electronic module<br />
was used to record the cooling curves which were<br />
used to determine the initial metal temperature Ti just<br />
after the mold filling <strong>and</strong> the maximum undercooling,<br />
2.2 Ductile cast iron<br />
Tsinghua Science <strong>and</strong> Technology, April 2008, 13(2): 177-183<br />
∆Tm, at the onset <strong>of</strong> eutectic solidification. After cooling,<br />
specimens were taken for metallographic examination<br />
from the geometric centers <strong>of</strong> the plates. Metallographic<br />
examinations were made on polished <strong>and</strong><br />
etched (stead reagent) specimens to show the graphite<br />
eutectic cell boundaries. The planar microstructure was<br />
characterized by the average number <strong>of</strong> eutectic cells<br />
NF per unit area (cell count) [12]<br />
N<br />
N + 0.5 N<br />
F<br />
+ 1<br />
i w<br />
F = (14)<br />
where Ni is the number <strong>of</strong> eutectic cells inside a rectangle<br />
S, Nw is the number <strong>of</strong> eutectic cells that intersect<br />
the sides <strong>of</strong> S but not their corners <strong>and</strong> F is the surface<br />
area <strong>of</strong> S. The average number <strong>of</strong> eutectic cells N<br />
per unit volume (volumetric cell count) was given<br />
by [13]<br />
N ≅ 0.568 N<br />
(15)<br />
3/2<br />
F<br />
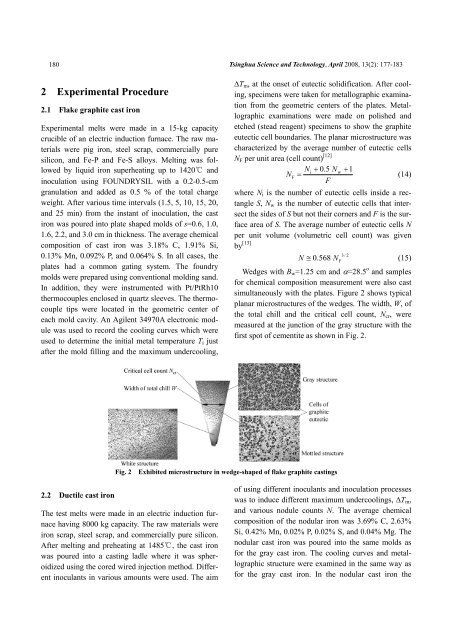
Wedges with Bw=1.25 cm <strong>and</strong> α=28.5 o <strong>and</strong> samples<br />
for chemical composition measurement were also cast<br />
simultaneously with the plates. Figure 2 shows typical<br />
planar microstructures <strong>of</strong> the wedges. The width, W, <strong>of</strong><br />
the total chill <strong>and</strong> the critical cell count, Ncr, were<br />
measured at the junction <strong>of</strong> the gray structure with the<br />
first spot <strong>of</strong> cementite as shown in Fig. 2.<br />
Fig. 2 Exhibited microstructure in wedge-shaped <strong>of</strong> flake graphite castings<br />
The test melts were made in an electric induction furnace<br />
having 8000 kg capacity. The raw materials were<br />
iron scrap, steel scrap, <strong>and</strong> commercially pure silicon.<br />
After melting <strong>and</strong> preheating at 1485 ℃ , the cast iron<br />
was poured into a casting ladle where it was spheroidized<br />
using the cored wired injection method. Different<br />
inoculants in various amounts were used. The aim<br />
<strong>of</strong> using different inoculants <strong>and</strong> inoculation processes<br />
was to induce different maximum undercoolings, ∆Tm,<br />
<strong>and</strong> various nodule counts N. The average chemical<br />
composition <strong>of</strong> the nodular iron was 3.69% C, 2.63%<br />
Si, 0.42% Mn, 0.02% P, 0.02% S, <strong>and</strong> 0.04% Mg. The<br />
nodular cast iron was poured into the same molds as<br />
for the gray cast iron. The cooling curves <strong>and</strong> metallographic<br />
structure were examined in the same way as<br />
for the gray cast iron. In the nodular cast iron the