Determinants and effects of Venture Capital and Private Equity ...
Determinants and effects of Venture Capital and Private Equity ...
Determinants and effects of Venture Capital and Private Equity ...

Create successful ePaper yourself
Turn your PDF publications into a flip-book with our unique Google optimized e-Paper software.
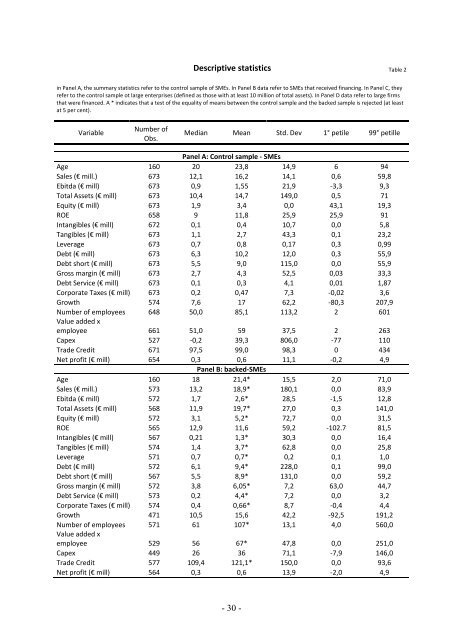
Descriptive statistics Table 2<br />
in Panel A, the summary statistics refer to the control sample <strong>of</strong> SMEs. In Panel B data refer to SMEs that received financing. In Panel C, they<br />
refer to the control sample ot large enterprises (defined as those with at least 10 million <strong>of</strong> total assets). In Panel D data refer to large firms<br />
that were financed. A * indicates that a test <strong>of</strong> the equality <strong>of</strong> means between the control sample <strong>and</strong> the backed sample is rejected (at least<br />
at 5 per cent).<br />
Variable<br />
Number <strong>of</strong><br />
Obs.<br />
Median Mean Std. Dev 1° petile 99° petille<br />
Panel A: Control sample ‐ SMEs<br />
Age 160 20 23,8 14,9 6 94<br />
Sales (€ mill.) 673 12,1 16,2 14,1 0,6 59,8<br />
Ebitda (€ mill) 673 0,9 1,55 21,9 ‐3,3 9,3<br />
Total Assets (€ mill) 673 10,4 14,7 149,0 0,5 71<br />
<strong>Equity</strong> (€ mill) 673 1,9 3,4 0,0 43,1 19,3<br />
ROE 658 9 11,8 25,9 25,9 91<br />
Intangibles (€ mill) 672 0,1 0,4 10,7 0,0 5,8<br />
Tangibles (€ mill) 673 1,1 2,7 43,3 0,1 23,2<br />
Leverage 673 0,7 0,8 0,17 0,3 0,99<br />
Debt (€ mill) 673 6,3 10,2 12,0 0,3 55,9<br />
Debt short (€ mill) 673 5,5 9,0 115,0 0,0 55,9<br />
Gross margin (€ mill) 673 2,7 4,3 52,5 0,03 33,3<br />
Debt Service (€ mill) 673 0,1 0,3 4,1 0,01 1,87<br />
Corporate Taxes (€ mill) 673 0,2 0,47 7,3 ‐0,02 3,6<br />
Growth 574 7,6 17 62,2 ‐80,3 207,9<br />
Number <strong>of</strong> employees 648 50,0 85,1 113,2 2 601<br />
Value added x<br />
employee 661 51,0 59 37,5 2 263<br />
Capex 527 ‐0,2 39,3 806,0 ‐77 110<br />
Trade Credit 671 97,5 99,0 98,3 0 434<br />
Net pr<strong>of</strong>it (€ mill) 654 0,3 0,6 11,1 ‐0,2 4,9<br />
Panel B: backed‐SMEs<br />
Age 160 18 21,4* 15,5 2,0 71,0<br />
Sales (€ mill.) 573 13,2 18,9* 180,1 0,0 83,9<br />
Ebitda (€ mill) 572 1,7 2,6* 28,5 ‐1,5 12,8<br />
Total Assets (€ mill) 568 11,9 19,7* 27,0 0,3 141,0<br />
<strong>Equity</strong> (€ mill) 572 3,1 5,2* 72,7 0,0 31,5<br />
ROE 565 12,9 11,6 59,2 ‐102.7 81,5<br />
Intangibles (€ mill) 567 0,21 1,3* 30,3 0,0 16,4<br />
Tangibles (€ mill) 574 1,4 3,7* 62,8 0,0 25,8<br />
Leverage 571 0,7 0,7* 0,2 0,1 1,0<br />
Debt (€ mill) 572 6,1 9,4* 228,0 0,1 99,0<br />
Debt short (€ mill) 567 5,5 8,9* 131,0 0,0 59,2<br />
Gross margin (€ mill) 572 3,8 6,05* 7,2 63,0 44,7<br />
Debt Service (€ mill) 573 0,2 4,4* 7,2 0,0 3,2<br />
Corporate Taxes (€ mill) 574 0,4 0,66* 8,7 ‐0,4 4,4<br />
Growth 471 10,5 15,6 42,2 ‐92,5 191,2<br />
Number <strong>of</strong> employees 571 61 107* 13,1 4,0 560,0<br />
Value added x<br />
employee 529 56 67* 47,8 0,0 251,0<br />
Capex 449 26 36 71,1 ‐7,9 146,0<br />
Trade Credit 577 109,4 121,1* 150,0 0,0 93,6<br />
Net pr<strong>of</strong>it (€ mill) 564 0,3 0,6 13,9 ‐2,0 4,9<br />
- 30 -