

Maximum, Minimum, and Current Temperature Protocol - GLOBE
Maximum, Minimum, and Current Temperature Protocol - GLOBE
Maximum, Minimum, and Current Temperature Protocol - GLOBE

Create successful ePaper yourself
Turn your PDF publications into a flip-book with our unique Google optimized e-Paper software.
Looking at a graph of these data, such as Figure<br />
AT-MM-3, makes it easy to check them visually.<br />
Another check on the reasonableness of data<br />
from a single day is to compare them with data<br />
from near-by <strong>GLOBE</strong> schools or other sources of<br />
temperature data. Figure AT-MM-4 shows the<br />
data from a single day for 12 schools that are<br />
reasonably close to one another. Table AT-MM-<br />
1 gives the air temperature data for the schools<br />
shown in this figure. All the schools shown are<br />
in reasonable agreement.<br />
What do people look for in these<br />
data?<br />
In climate studies, scientists are interested in the<br />
average temperature over various time periods<br />
<strong>and</strong> in the extreme values. On most days, air<br />
temperature varies with the diurnal (daily) cycle<br />
of sunlight, <strong>and</strong> this variation is often larger than<br />
the change from day to day.<br />
In many places, air temperature varies significantly<br />
as weather systems move across the region in a<br />
succession of cold fronts <strong>and</strong> warm fronts. The<br />
exact timing of these weather systems varies<br />
from year to year so comparing temperatures<br />
from the same day in different years is not a good<br />
indication of climate variation. To really be able to<br />
compare year-to-year changes, you must average<br />
over multiple weather systems. A month is long<br />
enough to average out the effects of individual<br />
storms, but not so long that seasonal variations<br />
are averaged out.<br />
The average temperature for a day can be<br />
estimated by averaging the maximum <strong>and</strong><br />
minimum temperatures for that day. Research<br />
has shown that this estimate is generally within<br />
0.1˚ C of the actual average value. For the school<br />
we are considering on April 15, 1998:<br />
T max = 10.0˚ C<br />
T min = 2.0˚ C<br />
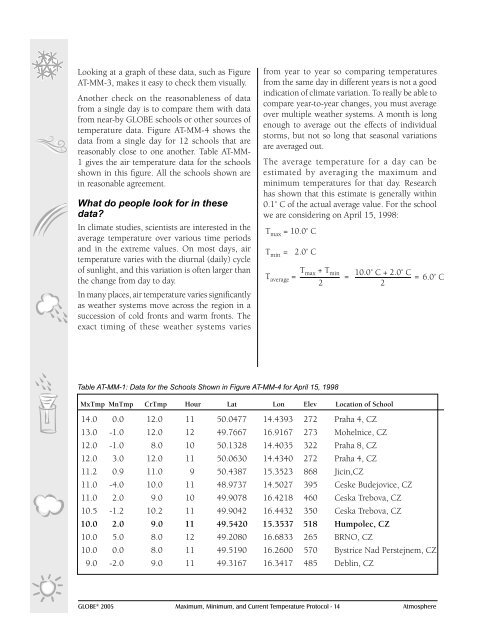
Table AT-MM-1: Data for the Schools Shown in Figure AT-MM-4 for April 15, 1998<br />
Tmax + Tmin Taverage = =<br />
10.0˚ C + 2.0˚ C<br />
= 6.0˚ C<br />
2<br />
2<br />
MxTmp MnTmp CrTmp Hour Lat Lon Elev Location of School<br />
14.0 0.0 12.0 11 50.0477 14.4393 272 Praha 4, CZ<br />
13.0 -1.0 12.0 12 49.7667 16.9167 273 Mohelnice, CZ<br />
12.0 -1.0 8.0 10 50.1328 14.4035 322 Praha 8, CZ<br />
12.0 3.0 12.0 11 50.0630 14.4340 272 Praha 4, CZ<br />
11.2 0.9 11.0 9 50.4387 15.3523 868 Jicin,CZ<br />
11.0 -4.0 10.0 11 48.9737 14.5027 395 Ceske Budejovice, CZ<br />
11.0 2.0 9.0 10 49.9078 16.4218 460 Ceska Trebova, CZ<br />
10.5 -1.2 10.2 11 49.9042 16.4432 350 Ceska Trebova, CZ<br />
10.0 2.0 9.0 11 49.5420 15.3537 518 Humpolec, CZ<br />
10.0 5.0 8.0 12 49.2080 16.6833 265 BRNO, CZ<br />
10.0 0.0 8.0 11 49.5190 16.2600 570 Bystrice Nad Perstejnem, CZ<br />
9.0 -2.0 9.0 11 49.3167 16.3417 485 Deblin, CZ<br />
<strong>GLOBE</strong> ® 2005 <strong>Maximum</strong>, <strong>Minimum</strong>, <strong>and</strong> <strong>Current</strong> <strong>Temperature</strong> <strong>Protocol</strong> - 14 Atmosphere


