Maximum, Minimum, and Current Temperature Protocol - GLOBE
Maximum, Minimum, and Current Temperature Protocol - GLOBE
Maximum, Minimum, and Current Temperature Protocol - GLOBE
You also want an ePaper? Increase the reach of your titles
YUMPU automatically turns print PDFs into web optimized ePapers that Google loves.
are good enough for her project as she will be<br />
combining the data from all five schools.<br />
Analyzing Data<br />
As a first step in getting the data from these<br />
schools, she generates a plot of the maximum<br />
temperature data for April 1998 from her school<br />
<strong>and</strong> the schools in Praha. She then creates a data<br />
table with all the values for this graph. She saves<br />
this information either by printing the table from<br />
the computer, cutting <strong>and</strong> pasting the table into<br />
a spreadsheet, or copying down the values by<br />
h<strong>and</strong>. She does the same thing for the minimum<br />
temperatures. Now she calculates the average of<br />
all the maximum <strong>and</strong> minimum temperatures<br />
reported by the schools in Praha for this month.<br />
She gets a value of 12.6˚ C. Since this is greater<br />
than the value for her school of 10.4˚ C, her<br />
hypothesis is supported.<br />
She wonders if averaging all the temperatures is<br />
correct, since on some days all five Praha schools<br />
provided data but on other days only one school<br />
reported. She decides to calculate the monthly<br />
average for each individual school <strong>and</strong> then<br />
average these five values. Her results for the five<br />
schools are 11.6˚ C, 12.1˚ C, 12.5˚ C, 13.0˚ C, <strong>and</strong><br />
14.4˚ C <strong>and</strong> the average of these values is 12.7˚<br />
C which is in good agreement with the original<br />
average she calculated for Praha of 12.6˚ C.<br />
She then proceeds to write-up her hypothesis,<br />
her procedure, <strong>and</strong> her conclusions <strong>and</strong> includes<br />
calculations she has done <strong>and</strong> graphs she has<br />
used or made. As a final note, she discusses<br />
additional tests of her hypothesis that she<br />
would like to investigate in the future including<br />
doing the comparison for April of another year<br />
or even doing the comparison for all months of<br />
the year 1998.<br />
Further Data Analysis<br />
If the student doing this project has been taught<br />
about square roots <strong>and</strong> some elementary statistics,<br />
she could go a bit further <strong>and</strong> examine the<br />
statistical errors in her calculations of monthly<br />
average temperatures. All of the schools involved<br />
in this example reported temperature to the<br />
nearest degree Celsius instead of to the nearest<br />
0.5˚ C. How can she tell? Well she notices that<br />
all of the values reported have 0 in the tenths<br />
place. If readings were taken to the nearest half<br />
degree, there should be some values with 5 in the<br />
tenths place. So, given the accuracy of <strong>GLOBE</strong><br />
instruments <strong>and</strong> the readings by the students, the<br />
error in the individual measurements is ± 1.0˚ C.<br />
The error in the average depends on the number of<br />
independent measurements included, so for each<br />
school the statistical error in the average is:<br />
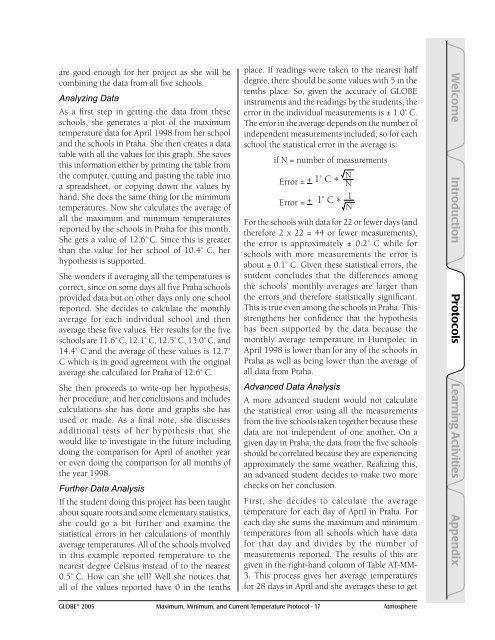
if N = number of measurements<br />
Error = + 1˚ C * N N<br />
Error = + 1˚ C * 1<br />
N<br />
For the schools with data for 22 or fewer days (<strong>and</strong><br />
therefore 2 x 22 = 44 or fewer measurements),<br />
the error is approximately ± 0.2˚ C while for<br />
schools with more measurements the error is<br />
about ± 0.1˚ C. Given these statistical errors, the<br />
student concludes that the differences among<br />
the schools’ monthly averages are larger than<br />
the errors <strong>and</strong> therefore statistically significant.<br />
This is true even among the schools in Praha. This<br />
strengthens her confidence that the hypothesis<br />
has been supported by the data because the<br />
monthly average temperature in Humpolec in<br />
April 1998 is lower than for any of the schools in<br />
Praha as well as being lower than the average of<br />
all data from Praha.<br />
Advanced Data Analysis<br />
A more advanced student would not calculate<br />
the statistical error using all the measurements<br />
from the five schools taken together because these<br />
data are not independent of one another. On a<br />
given day in Praha, the data from the five schools<br />
should be correlated because they are experiencing<br />
approximately the same weather. Realizing this,<br />
an advanced student decides to make two more<br />
checks on her conclusion.<br />
First, she decides to calculate the average<br />
temperature for each day of April in Praha. For<br />
each day she sums the maximum <strong>and</strong> minimum<br />
temperatures from all schools which have data<br />
for that day <strong>and</strong> divides by the number of<br />
measurements reported. The results of this are<br />
given in the right-h<strong>and</strong> column of Table AT-MM-<br />
3. This process gives her average temperatures<br />
for 28 days in April <strong>and</strong> she averages these to get<br />
<strong>GLOBE</strong> ® 2005 <strong>Maximum</strong>, <strong>Minimum</strong>, <strong>and</strong> <strong>Current</strong> <strong>Temperature</strong> <strong>Protocol</strong> - 17 Atmosphere<br />
Welcome Introduction <strong>Protocol</strong>s<br />
Learning Activities Appendix


