

Maximum, Minimum, and Current Temperature Protocol - GLOBE
Maximum, Minimum, and Current Temperature Protocol - GLOBE
Maximum, Minimum, and Current Temperature Protocol - GLOBE

Create successful ePaper yourself
Turn your PDF publications into a flip-book with our unique Google optimized e-Paper software.
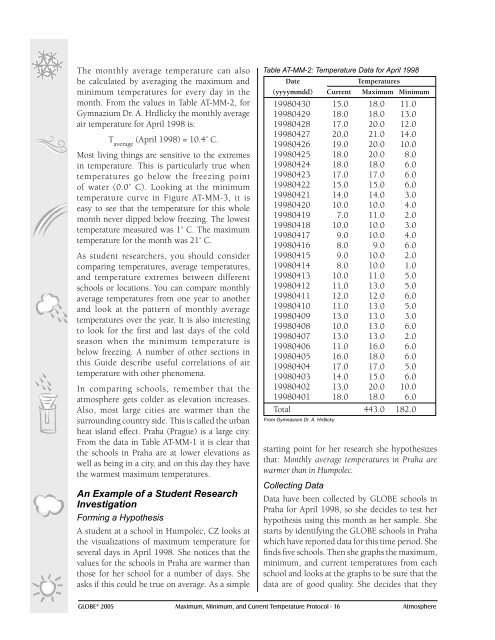
The monthly average temperature can also<br />
be calculated by averaging the maximum <strong>and</strong><br />
minimum temperatures for every day in the<br />
month. From the values in Table AT-MM-2, for<br />
Gymnazium Dr. A. Hrdlicky the monthly average<br />
air temperature for April 1998 is:<br />
T average (April 1998) = 10.4˚ C.<br />
Most living things are sensitive to the extremes<br />
in temperature. This is particularly true when<br />
temperatures go below the freezing point<br />
of water (0.0˚ C). Looking at the minimum<br />
temperature curve in Figure AT-MM-3, it is<br />
easy to see that the temperature for this whole<br />
month never dipped below freezing. The lowest<br />
temperature measured was 1˚ C. The maximum<br />
temperature for the month was 21˚ C.<br />
As student researchers, you should consider<br />
comparing temperatures, average temperatures,<br />
<strong>and</strong> temperature extremes between different<br />
schools or locations. You can compare monthly<br />
average temperatures from one year to another<br />
<strong>and</strong> look at the pattern of monthly average<br />
temperatures over the year. It is also interesting<br />
to look for the first <strong>and</strong> last days of the cold<br />
season when the minimum temperature is<br />
below freezing. A number of other sections in<br />
this Guide describe useful correlations of air<br />
temperature with other phenomena.<br />
In comparing schools, remember that the<br />
atmosphere gets colder as elevation increases.<br />
Also, most large cities are warmer than the<br />
surrounding country side. This is called the urban<br />
heat isl<strong>and</strong> effect. Praha (Prague) is a large city.<br />
From the data in Table AT-MM-1 it is clear that<br />
the schools in Praha are at lower elevations as<br />
well as being in a city, <strong>and</strong> on this day they have<br />
the warmest maximum temperatures.<br />
An Example of a Student Research<br />
Investigation<br />
Forming a Hypothesis<br />
A student at a school in Humpolec, CZ looks at<br />
the visualizations of maximum temperature for<br />
several days in April 1998. She notices that the<br />
values for the schools in Praha are warmer than<br />
those for her school for a number of days. She<br />
asks if this could be true on average. As a simple<br />
Table AT-MM-2: <strong>Temperature</strong> Data for April 1998<br />
Date <strong>Temperature</strong>s<br />
(yyyymmdd) <strong>Current</strong> <strong>Maximum</strong> <strong>Minimum</strong><br />
19980430 15.0 18.0 11.0<br />
19980429 18.0 18.0 13.0<br />
19980428 17.0 20.0 12.0<br />
19980427 20.0 21.0 14.0<br />
19980426 19.0 20.0 10.0<br />
19980425 18.0 20.0 8.0<br />
19980424 18.0 18.0 6.0<br />
19980423 17.0 17.0 6.0<br />
19980422 15.0 15.0 6.0<br />
19980421 14.0 14.0 3.0<br />
19980420 10.0 10.0 4.0<br />
19980419 7.0 11.0 2.0<br />
19980418 10.0 10.0 3.0<br />
19980417 9.0 10.0 4.0<br />
19980416 8.0 9.0 6.0<br />
19980415 9.0 10.0 2.0<br />
19980414 8.0 10.0 1.0<br />
19980413 10.0 11.0 5.0<br />
19980412 11.0 13.0 5.0<br />
19980411 12.0 12.0 6.0<br />
19980410 11.0 13.0 5.0<br />
19980409 13.0 13.0 3.0<br />
19980408 10.0 13.0 6.0<br />
19980407 13.0 13.0 2.0<br />
19980406 11.0 16.0 6.0<br />
19980405 16.0 18.0 6.0<br />
19980404 17.0 17.0 5.0<br />
19980403 14.0 15.0 6.0<br />
19980402 13.0 20.0 10.0<br />
19980401 18.0 18.0 6.0<br />
Total 443.0 182.0<br />
From Gymnasium Dr. A. Hrdlicky<br />
starting point for her research she hypothesizes<br />
that: Monthly average temperatures in Praha are<br />
warmer than in Humpolec.<br />
Collecting Data<br />
Data have been collected by <strong>GLOBE</strong> schools in<br />
Praha for April 1998, so she decides to test her<br />
hypothesis using this month as her sample. She<br />
starts by identifying the <strong>GLOBE</strong> schools in Praha<br />
which have reported data for this time period. She<br />
finds five schools. Then she graphs the maximum,<br />
minimum, <strong>and</strong> current temperatures from each<br />
school <strong>and</strong> looks at the graphs to be sure that the<br />
data are of good quality. She decides that they<br />
<strong>GLOBE</strong> ® 2005 <strong>Maximum</strong>, <strong>Minimum</strong>, <strong>and</strong> <strong>Current</strong> <strong>Temperature</strong> <strong>Protocol</strong> - 16 Atmosphere


