Insurance Risk Study - Aon
Insurance Risk Study - Aon
Insurance Risk Study - Aon

Create successful ePaper yourself
Turn your PDF publications into a flip-book with our unique Google optimized e-Paper software.
<strong>Insurance</strong> <strong>Risk</strong> <strong>Study</strong><br />
Modeling Dependence<br />
Dependence is a core component of economic capital<br />
modeling. <strong>Risk</strong> managers frequently discuss correlation,<br />
and this <strong>Study</strong> includes numerous correlation matrices.<br />
But correlation alone does not fully describe<br />
dependence. There are many ways to combine two<br />
variables to have the same linear correlation coefficient.<br />
For example, the familiar symmetric, elliptical contours<br />
of the normal copula can have the same linear<br />
correlation as a more pinched distribution, and<br />
pinching can occur either on the left, the right or both<br />
sides. The impact of dependence is most clearly seen in<br />
the distribution of the sum (or portfolio return) of the<br />
two variables, with extreme tail correlation producing<br />
an aggregate distribution with much fatter tails.<br />
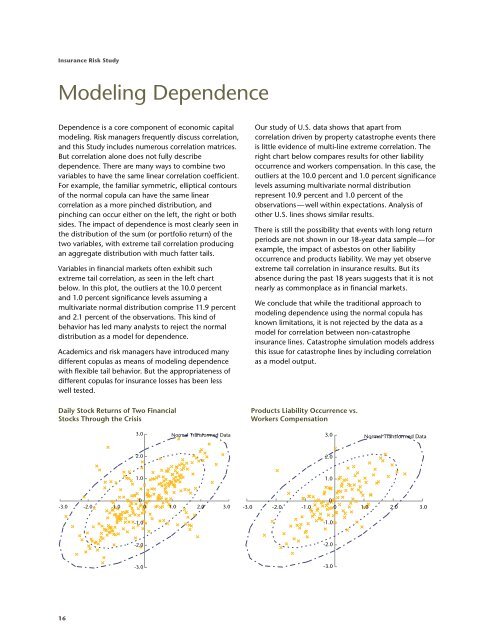
Variables in financial markets often exhibit such<br />
extreme tail correlation, as seen in the left chart<br />
below. In this plot, the outliers at the 10.0 percent<br />
and 1.0 percent significance levels assuming a<br />
multivariate normal distribution comprise 11.9 percent<br />
and 2.1 percent of the observations. This kind of<br />
behavior has led many analysts to reject the normal<br />
distribution as a model for dependence.<br />
Academics and risk managers have introduced many<br />
different copulas as means of modeling dependence<br />
with flexible tail behavior. But the appropriateness of<br />
different copulas for insurance losses has been less<br />
well tested.<br />
Daily Stock Returns of Two Financial<br />
Stocks Through the Crisis<br />
16<br />
3.0<br />
2.0<br />
1.0<br />
-1.0<br />
-2.0<br />
-3.0<br />
Normal Transformed Data<br />
0<br />
-3.0 -2.0 -1.0 0 1.0 2.0 3.0<br />
Our study of U.S. data shows that apart from<br />
correlation driven by property catastrophe events there<br />
is little evidence of multi-line extreme correlation. The<br />
right chart below compares results for other liability<br />
occurrence and workers compensation. In this case, the<br />
outliers at the 10.0 percent and 1.0 percent significance<br />
levels assuming multivariate normal distribution<br />
represent 10.9 percent and 1.0 percent of the<br />
observations — well within expectations. Analysis of<br />
other U.S. lines shows similar results.<br />
There is still the possibility that events with long return<br />
periods are not shown in our 18-year data sample — for<br />
example, the impact of asbestos on other liability<br />
occurrence and products liability. We may yet observe<br />
extreme tail correlation in insurance results. But its<br />
absence during the past 18 years suggests that it is not<br />
nearly as commonplace as in financial markets.<br />
We conclude that while the traditional approach to<br />
modeling dependence using the normal copula has<br />
known limitations, it is not rejected by the data as a<br />
model for correlation between non-catastrophe<br />
insurance lines. Catastrophe simulation models address<br />
this issue for catastrophe lines by including correlation<br />
as a model output.<br />
Products Liability Occurrence vs.<br />
Workers Compensation<br />
3.0<br />
2.0<br />
1.0<br />
-1.0<br />
-2.0<br />
-3.0<br />
Normal Transformed Data<br />
0<br />
-3.0 -2.0 -1.0 0 1.0 2.0 3.0