Insurance Risk Study - Aon
Insurance Risk Study - Aon
Insurance Risk Study - Aon

Create successful ePaper yourself
Turn your PDF publications into a flip-book with our unique Google optimized e-Paper software.
Contents<br />
3 | Foreword<br />
4 | Global <strong>Risk</strong> Parameters<br />
6 | Evaluating Solvency II Factors<br />
8 | U.S. <strong>Risk</strong> Parameters<br />
10 | Best of Times, Worst of Times<br />
12 | Correlation and the Pricing Cycle<br />
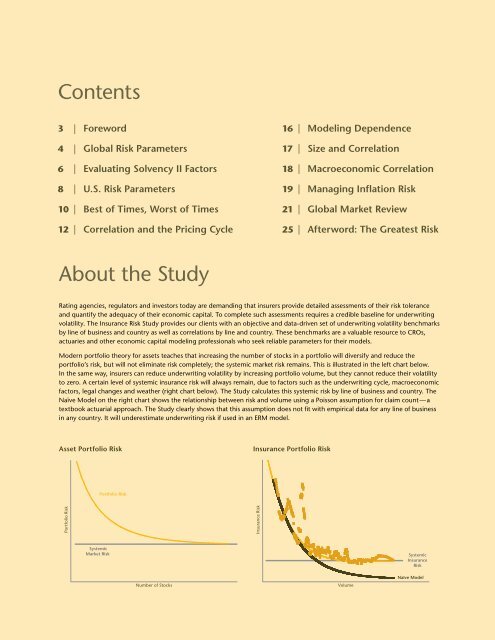
About the <strong>Study</strong><br />
Asset Portfolio <strong>Risk</strong><br />
Portfolio <strong>Risk</strong><br />
16 | Modeling Dependence<br />
17 | Size and Correlation<br />
18 | Macroeconomic Correlation<br />
19 | Managing Inflation <strong>Risk</strong><br />
21 | Global Market Review<br />
25 | Afterword: The Greatest <strong>Risk</strong><br />
Rating agencies, regulators and investors today are demanding that insurers provide detailed assessments of their risk tolerance<br />
and quantify the adequacy of their economic capital. To complete such assessments requires a credible baseline for underwriting<br />
volatility. The <strong>Insurance</strong> <strong>Risk</strong> <strong>Study</strong> provides our clients with an objective and data-driven set of underwriting volatility benchmarks<br />
by line of business and country as well as correlations by line and country. These benchmarks are a valuable resource to CROs,<br />
actuaries and other economic capital modeling professionals who seek reliable parameters for their models.<br />
Modern portfolio theory for assets teaches that increasing the number of stocks in a portfolio will diversify and reduce the<br />
portfolio’s risk, but will not eliminate risk completely; the systemic market risk remains. This is illustrated in the left chart below.<br />
In the same way, insurers can reduce underwriting volatility by increasing portfolio volume, but they cannot reduce their volatility<br />
to zero. A certain level of systemic insurance risk will always remain, due to factors such as the underwriting cycle, macroeconomic<br />
factors, legal changes and weather (right chart below). The <strong>Study</strong> calculates this systemic risk by line of business and country. The<br />
Naïve Model on the right chart shows the relationship between risk and volume using a Poisson assumption for claim count — a<br />
textbook actuarial approach. The <strong>Study</strong> clearly shows that this assumption does not fit with empirical data for any line of business<br />
in any country. It will underestimate underwriting risk if used in an ERM model.<br />
Portfolio <strong>Risk</strong><br />
<strong>Insurance</strong> Portfolio <strong>Risk</strong><br />
Systemic<br />
Market <strong>Risk</strong> Systemic<br />
<strong>Insurance</strong><br />
<strong>Risk</strong><br />
Number of Stocks<br />
<strong>Insurance</strong> <strong>Risk</strong><br />
Volume<br />
Naïve Model