Insurance Risk Study - Aon
Insurance Risk Study - Aon
Insurance Risk Study - Aon

Create successful ePaper yourself
Turn your PDF publications into a flip-book with our unique Google optimized e-Paper software.
<strong>Insurance</strong> <strong>Risk</strong> <strong>Study</strong><br />
Evaluating Solvency II Factors<br />
Solvency II is scheduled to take effect no later than<br />
January 1, 2013. The fifth quantitative impact study<br />
(QIS 5) is in progress with a deadline of October<br />
2010 for individual insurers and mid-November 2010<br />
for groups.<br />
QIS 5 is likely the key test for most insurers across<br />
Europe. The Standard Formula factors were designed to<br />
be appropriate for the entire market — meaning a<br />
typical company of average size — so larger insurers<br />
with greater diversification will find the formula<br />
generates conservative capital requirements. Moreover,<br />
in QIS 5, the formula reflects added concerns that<br />
emerged from the 2008 financial crisis. Insurers now<br />
have heightened incentives to develop full or partial<br />
internal models as an alternative to the Solvency II<br />
Standard Formula.<br />
At this stage, the most important aspect of preparing<br />
for Solvency II is correct parameterization, driven by<br />
access to data. Insurers may face serious challenges to<br />
their IT systems. They will need some reference point as<br />
they undertake the various Solvency II tests: evaluating<br />
the statistical quality of the data, calibrating and<br />
validating the models they are using.<br />
The non-life Solvency Capital Requirement (SCR) is<br />
predominantly driven by premium risk, reserve risk and<br />
catastrophe risk. Since many companies with<br />
catastrophe exposure purchase excess of loss<br />
reinsurance, premium and reserve risk will be the key<br />
drivers of capital.<br />
Solvency II vs. <strong>Insurance</strong> <strong>Risk</strong> <strong>Study</strong><br />
There are four key differences between the Solvency II<br />
factors and those in the <strong>Insurance</strong> <strong>Risk</strong> <strong>Study</strong>.<br />
Key Differences<br />
6<br />
Solvency II <strong>Insurance</strong> <strong>Risk</strong> <strong>Study</strong><br />
Standard deviations<br />
of gross loss ratios<br />
Based on loss ratios at<br />
end of first year<br />
Coefficients of variation<br />
of gross loss ratios<br />
Based on ultimate loss ratios<br />
Excludes catastrophe risk Includes catastrophe risk<br />
Average-sized company,<br />
parameter and process risk<br />
Large company,<br />
parameter risk only<br />
Standard Deviations vs. Coefficients of Variation<br />
In Solvency II, the premium risk factors are calculated<br />
as standard deviations of historical loss ratios. Within<br />
the Standard Formula, these standard deviations are<br />
applied on the total volume of premium rather than<br />
to the premium net of loadings for costs,<br />
commissions and profit.<br />
Whether this overestimates the risk, and thus the capital<br />
requirement, depends on the company and the line of<br />
business. Certainly the Regulator has made some<br />
conservative assumptions: expenses are assumed to<br />
have the same volatility as the losses, and no profit is<br />
assumed over the cycle. If insurers disagree with these<br />
assumptions they must apply for a partial internal model.<br />
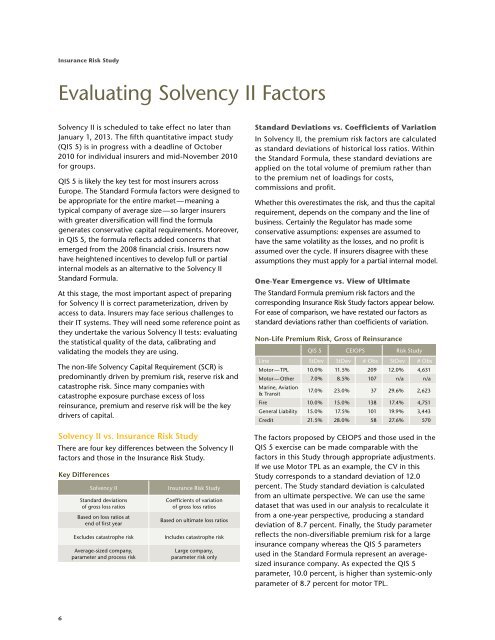
One-Year Emergence vs. View of Ultimate<br />
The Standard Formula premium risk factors and the<br />
corresponding <strong>Insurance</strong> <strong>Risk</strong> <strong>Study</strong> factors appear below.<br />
For ease of comparison, we have restated our factors as<br />
standard deviations rather than coefficients of variation.<br />
Non-Life Premium <strong>Risk</strong>, Gross of Reinsurance<br />
QIS 5 CEIOPS <strong>Risk</strong> <strong>Study</strong><br />
Line StDev StDev # Obs StDev # Obs<br />
Motor — TPL 10.0% 11.5% 209 12.0% 4,631<br />
Motor — Other 7.0% 8.5% 107 n/a n/a<br />
Marine, Aviation<br />
& Transit<br />
17.0% 23.0% 37 29.6% 2,623<br />
Fire 10.0% 15.0% 138 17.4% 4,751<br />
General Liability 15.0% 17.5% 101 19.9% 3,443<br />
Credit 21.5% 28.0% 58 27.6% 570<br />
The factors proposed by CEIOPS and those used in the<br />
QIS 5 exercise can be made comparable with the<br />
factors in this <strong>Study</strong> through appropriate adjustments.<br />
If we use Motor TPL as an example, the CV in this<br />
<strong>Study</strong> corresponds to a standard deviation of 12.0<br />
percent. The <strong>Study</strong> standard deviation is calculated<br />
from an ultimate perspective. We can use the same<br />
dataset that was used in our analysis to recalculate it<br />
from a one-year perspective, producing a standard<br />
deviation of 8.7 percent. Finally, the <strong>Study</strong> parameter<br />
reflects the non-diversifiable premium risk for a large<br />
insurance company whereas the QIS 5 parameters<br />
used in the Standard Formula represent an averagesized<br />
insurance company. As expected the QIS 5<br />
parameter, 10.0 percent, is higher than systemic-only<br />
parameter of 8.7 percent for motor TPL.