Analysis of Air Pollution Exposure of Individuals in - Clean Air Initiative
Analysis of Air Pollution Exposure of Individuals in - Clean Air Initiative
Analysis of Air Pollution Exposure of Individuals in - Clean Air Initiative

Create successful ePaper yourself
Turn your PDF publications into a flip-book with our unique Google optimized e-Paper software.
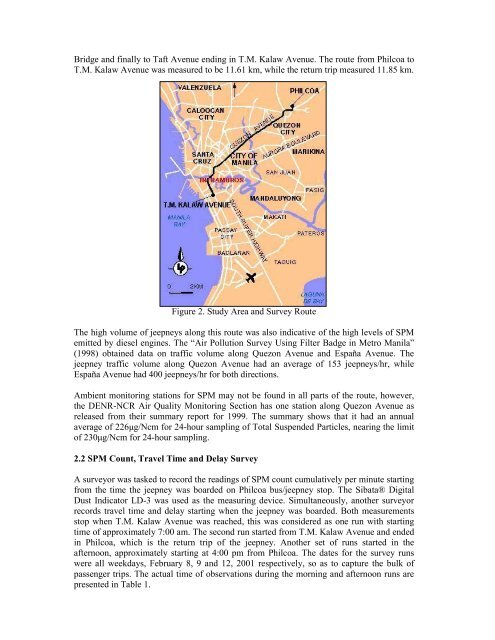
Bridge and f<strong>in</strong>ally to Taft Avenue end<strong>in</strong>g <strong>in</strong> T.M. Kalaw Avenue. The route from Philcoa to<br />
T.M. Kalaw Avenue was measured to be 11.61 km, while the return trip measured 11.85 km.<br />
Figure 2. Study Area and Survey Route<br />
The high volume <strong>of</strong> jeepneys along this route was also <strong>in</strong>dicative <strong>of</strong> the high levels <strong>of</strong> SPM<br />
emitted by diesel eng<strong>in</strong>es. The “<strong>Air</strong> <strong>Pollution</strong> Survey Us<strong>in</strong>g Filter Badge <strong>in</strong> Metro Manila”<br />
(1998) obta<strong>in</strong>ed data on traffic volume along Quezon Avenue and España Avenue. The<br />
jeepney traffic volume along Quezon Avenue had an average <strong>of</strong> 153 jeepneys/hr, while<br />
España Avenue had 400 jeepneys/hr for both directions.<br />
Ambient monitor<strong>in</strong>g stations for SPM may not be found <strong>in</strong> all parts <strong>of</strong> the route, however,<br />
the DENR-NCR <strong>Air</strong> Quality Monitor<strong>in</strong>g Section has one station along Quezon Avenue as<br />
released from their summary report for 1999. The summary shows that it had an annual<br />
average <strong>of</strong> 226µg/Ncm for 24-hour sampl<strong>in</strong>g <strong>of</strong> Total Suspended Particles, near<strong>in</strong>g the limit<br />
<strong>of</strong> 230µg/Ncm for 24-hour sampl<strong>in</strong>g.<br />
2.2 SPM Count, Travel Time and Delay Survey<br />
A surveyor was tasked to record the read<strong>in</strong>gs <strong>of</strong> SPM count cumulatively per m<strong>in</strong>ute start<strong>in</strong>g<br />
from the time the jeepney was boarded on Philcoa bus/jeepney stop. The Sibata® Digital<br />
Dust Indicator LD-3 was used as the measur<strong>in</strong>g device. Simultaneously, another surveyor<br />
records travel time and delay start<strong>in</strong>g when the jeepney was boarded. Both measurements<br />
stop when T.M. Kalaw Avenue was reached, this was considered as one run with start<strong>in</strong>g<br />
time <strong>of</strong> approximately 7:00 am. The second run started from T.M. Kalaw Avenue and ended<br />
<strong>in</strong> Philcoa, which is the return trip <strong>of</strong> the jeepney. Another set <strong>of</strong> runs started <strong>in</strong> the<br />
afternoon, approximately start<strong>in</strong>g at 4:00 pm from Philcoa. The dates for the survey runs<br />
were all weekdays, February 8, 9 and 12, 2001 respectively, so as to capture the bulk <strong>of</strong><br />
passenger trips. The actual time <strong>of</strong> observations dur<strong>in</strong>g the morn<strong>in</strong>g and afternoon runs are<br />
presented <strong>in</strong> Table 1.