Analysis of Air Pollution Exposure of Individuals in - Clean Air Initiative
Analysis of Air Pollution Exposure of Individuals in - Clean Air Initiative
Analysis of Air Pollution Exposure of Individuals in - Clean Air Initiative

You also want an ePaper? Increase the reach of your titles
YUMPU automatically turns print PDFs into web optimized ePapers that Google loves.
Speed (kph)<br />
Speed (kph)<br />
35<br />
30<br />
25<br />
20<br />
15<br />
10<br />
5<br />
0<br />
35<br />
30<br />
25<br />
20<br />
15<br />
10<br />
5<br />
0<br />
AM Philcoa - Kalaw Runs<br />
0 2 4 6 8 10 12 14<br />
Distance Covered (km)<br />
travel speed mean travel speed mean runn<strong>in</strong>g speed<br />
AM Kalaw to Philcoa Runs<br />
0 2 4 6 8 10 12 14<br />
Distance Covered (km)<br />
travel speed mean travel speed mean runn<strong>in</strong>g speed<br />
PM Philcoa - Kalaw Runs<br />
Philcoa - Kalaw Kalaw - Philcoa<br />
AM PM AM PM<br />
2/8/2001 65 59 45 77<br />
2/9/2001 62 63 56 67<br />
2/12/2001 64 77 50 81<br />
Average 64 66 50 75<br />
Speed (kph)<br />
35<br />
30<br />
25<br />
20<br />
15<br />
10<br />
5<br />
0<br />
0 2 4 6 8 10 12 14<br />
Distance Covered (km)<br />
travel speed mean travel speed mean runn<strong>in</strong>g speed<br />
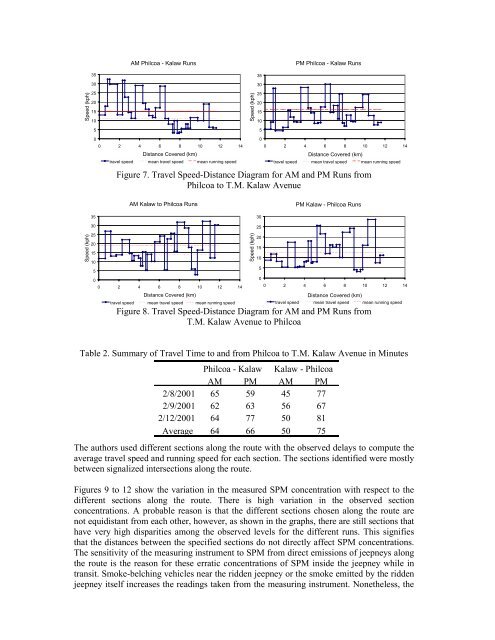
Figure 7. Travel Speed-Distance Diagram for AM and PM Runs from<br />
Philcoa to T.M. Kalaw Avenue<br />
Speed (kph)<br />
30<br />
25<br />
20<br />
15<br />
10<br />
5<br />
0<br />
PM Kalaw - Philcoa Runs<br />
0 2 4 6 8 10 12 14<br />
Distance Covered (km)<br />
travel speed mean travel speed mean runn<strong>in</strong>g speed<br />
Figure 8. Travel Speed-Distance Diagram for AM and PM Runs from<br />
T.M. Kalaw Avenue to Philcoa<br />
Table 2. Summary <strong>of</strong> Travel Time to and from Philcoa to T.M. Kalaw Avenue <strong>in</strong> M<strong>in</strong>utes<br />
The authors used different sections along the route with the observed delays to compute the<br />
average travel speed and runn<strong>in</strong>g speed for each section. The sections identified were mostly<br />
between signalized <strong>in</strong>tersections along the route.<br />
Figures 9 to 12 show the variation <strong>in</strong> the measured SPM concentration with respect to the<br />
different sections along the route. There is high variation <strong>in</strong> the observed section<br />
concentrations. A probable reason is that the different sections chosen along the route are<br />
not equidistant from each other, however, as shown <strong>in</strong> the graphs, there are still sections that<br />
have very high disparities among the observed levels for the different runs. This signifies<br />
that the distances between the specified sections do not directly affect SPM concentrations.<br />
The sensitivity <strong>of</strong> the measur<strong>in</strong>g <strong>in</strong>strument to SPM from direct emissions <strong>of</strong> jeepneys along<br />
the route is the reason for these erratic concentrations <strong>of</strong> SPM <strong>in</strong>side the jeepney while <strong>in</strong><br />
transit. Smoke-belch<strong>in</strong>g vehicles near the ridden jeepney or the smoke emitted by the ridden<br />
jeepney itself <strong>in</strong>creases the read<strong>in</strong>gs taken from the measur<strong>in</strong>g <strong>in</strong>strument. Nonetheless, the