Open-Data for Low Emission Development (in ... - Clean Air Initiative
Open-Data for Low Emission Development (in ... - Clean Air Initiative
Open-Data for Low Emission Development (in ... - Clean Air Initiative

Create successful ePaper yourself
Turn your PDF publications into a flip-book with our unique Google optimized e-Paper software.
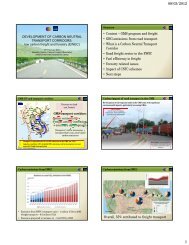
Million metric tons<br />
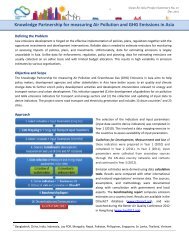
8. Asia AP/GHG Indicators Report:<br />
Philipp<strong>in</strong>es Energy Indicators<br />
TWh<br />
Total generation and consumption Electricity generation by<br />
source type (2010)<br />
80<br />
70<br />
60<br />
50<br />
40<br />
30<br />
20<br />
10<br />
GENERATION<br />
CONSUMPTION<br />
0<br />
2000 2002 2004 2006 2008 2010<br />
Total CO2, PM and SO2 emissions from<br />
1200<br />
electricity generation<br />
20000<br />
1000<br />
800<br />
600<br />
400<br />
200<br />
0<br />
0<br />
2000 2002 2004 2006 2008 2010<br />
PM emissions (thousand metric tons)<br />
SO2 emissions (thousand metric tons)<br />
CO2 emissions (million metric tons)<br />
15000<br />
10000<br />
5000<br />
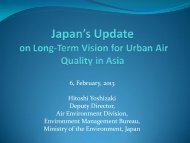
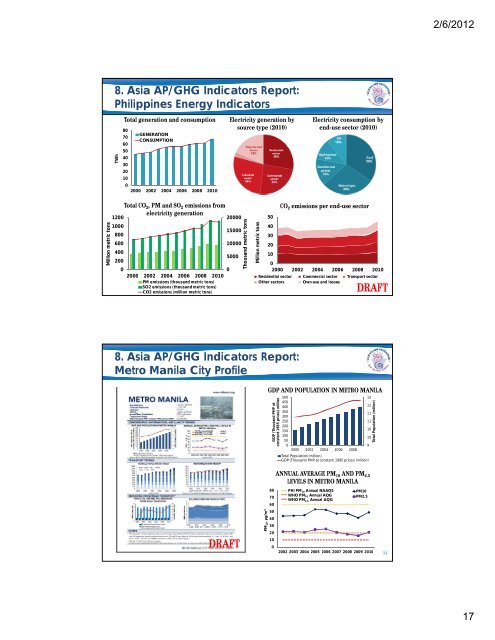
8. Asia AP/GHG Indicators Report:<br />
Metro Manila City Profile<br />
DRAFT<br />
Thousand metric tons<br />
Million metric tons<br />
50<br />
40<br />
30<br />
20<br />
10<br />
Electricity consumption by<br />
end-use sector (2010)<br />
CO 2 emissions per end-use sector<br />
0<br />
2000 2002 2004 2006 2008 2010<br />
Residential sector Commercial sector Transport sector<br />
Other sectors Own-use and losses<br />
PM 10 , µ g / m 3<br />
33 DRAFT<br />
GDP AND POPULATION IN METRO MANILA<br />
GDP (Thousand PHP at<br />
constant 1985 prices) million<br />
80<br />
70<br />
60<br />
50<br />
40<br />
30<br />
20<br />
10<br />
0<br />
500<br />
450<br />
400<br />
350<br />
300<br />
250<br />
200<br />
150<br />
100<br />
50<br />
0<br />
2000 2002 2004 2006 2008<br />
Total Population (million)<br />
GDP (Thousand PHP at constant 1985 prices) (million)<br />
ANNUAL AVERAGE PM 10 AND PM 2.5<br />
LEVELS IN METRO MANILA<br />
PHI PM 10 Annual NAAQS<br />
WHO PM 10 Annual AQG<br />
WHO PM 2.5 Annual AQG<br />
2002 2003 2004 2005 2006 2007 2008 2009 2010<br />
12<br />
12<br />
11<br />
11<br />
10<br />
10<br />
9<br />
PM10<br />
PM2.5<br />
Total Population (million)<br />
34<br />
2/6/2012<br />
17