Diagnosis of Pre-perimetric Glaucoma using Optical ... - KSOS
Diagnosis of Pre-perimetric Glaucoma using Optical ... - KSOS
Diagnosis of Pre-perimetric Glaucoma using Optical ... - KSOS

You also want an ePaper? Increase the reach of your titles
YUMPU automatically turns print PDFs into web optimized ePapers that Google loves.
March 2008 Saikumar et al. - OCT in <strong>Pre</strong>-permetric <strong>Glaucoma</strong> 39<br />
<strong>Diagnosis</strong> <strong>of</strong> <strong>Pre</strong>-<strong>perimetric</strong> <strong>Glaucoma</strong><br />
<strong>using</strong> <strong>Optical</strong> Coherence Tomography<br />
Dr. S J. Saikumar MS, Dr. Saphy Jose, Dr. Savita Bhat MS, Dr. Mahesh G. MS, FRCS, Dr. A. Giridhar MS<br />
Abstract<br />
Introduction<br />
Objective: To study the efficacy <strong>of</strong> <strong>Optical</strong> Coherence Tomography in pre <strong>perimetric</strong><br />
glaucoma.<br />
Methods: 76 glaucoma suspects with normal or borderline white on white visual fields<br />
underwent RNFL analysis with <strong>Optical</strong> Coherence Tomography (Stratus OCT version 4).<br />
Outcome measure: Borderline or definite RNFL thinning in the inferior or superior<br />
quadrants was taken as the main outcome measure.<br />
Results: Six out <strong>of</strong> seventy six glaucoma suspects showed RNFL changes in OCT suggestive<br />
<strong>of</strong> glaucoma giving the test a specificity <strong>of</strong> 92 %. All six patients had cup disc ratio <strong>of</strong> 0.6 or<br />
more and five out <strong>of</strong> six patients had IOP <strong>of</strong> 18 or more and positive family history <strong>of</strong> glaucoma.<br />
Conclusion: <strong>Optical</strong> Coherence Tomography is an useful tool for diagnosis <strong>of</strong> pre perimetry<br />
glaucoma especially in the presence <strong>of</strong> other risk factors like raised IOP, enlarged cup and<br />
family history <strong>of</strong> glaucoma.<br />
<strong>Glaucoma</strong> is an optic neuropathy characterized by a<br />
specific and progressive injury to the optic nerve and<br />
retinal nerve fiber layer 1 . Because the injury due to<br />
glaucoma is irreversible, early detection and prevention<br />
<strong>of</strong> glaucomatous RNFL loss is <strong>of</strong> vital importance.<br />
Examination <strong>of</strong> the optic nerve head and its surrounding<br />
nerve fiber layer is considered essential in both<br />
detection and monitoring <strong>of</strong> glaucoma. Damage to the<br />
RNFL has been shown to precede visual field loss. Upto<br />
30-50 % nerve fibre loss might have occurred before<br />
the first detectable field defect 2 . Hence, objective<br />
Giridhar Eye Institute, Ponneth Temple Road, Kadavanthra, Cochin 682 020<br />
E-mail: girieye@vsnl.com<br />
ORIGINAL<br />
ARTICLE<br />
methods <strong>of</strong> measuring these structures will aid<br />
ophthalmologists in making an accurate diagnosis.<br />
<strong>Optical</strong> Coherence Tomography (OCT) which was first<br />
described in 1991, is a high resolution cross sectional<br />
imaging technique that allows accurate measurement<br />
<strong>of</strong> the retinal nerve fiber layer 3 . With the ability to<br />
quantify the thickness <strong>of</strong> the RNFL with a resolution <strong>of</strong><br />
8 to 10 microns, clinicians potentially have a more objective<br />
tool in helping to diagnose glaucoma much earlier than<br />
visual fields. However, white on white perimetry is still<br />
considered the gold standard for diagnosis <strong>of</strong> glaucoma.<br />
AAO <strong>Pre</strong>ferred Practice Patterns still mentions that the<br />
diagnosis <strong>of</strong> glaucoma is based on appearance <strong>of</strong> the<br />
optic disc and standard achromatic perimetry 4 . In this<br />
current study glaucoma suspects who had normal or
40 Kerala Journal <strong>of</strong> Ophthalmology Vol. XX, No. 1<br />
borderline visual fields were subjected to RNFL analysis<br />
<strong>using</strong> <strong>Optical</strong> Coherence Tomography.<br />
Materials and Method<br />
The sudy was designed as a retrospective observational<br />
case series which included glaucoma suspects attending<br />
a tertiary care glaucoma centre.<br />
Study Population: 103 glaucoma suspects who<br />
underwent RNFL analysis on <strong>Optical</strong> Coherence<br />
Tomography were initially enrolled, out <strong>of</strong> which 76<br />
eyes <strong>of</strong> 76 patients fulfilled all criteria and were finally<br />
included in the study. Only one eye per person was<br />
included in the study. If one eye had abnormal fields<br />
and the other eye normal, the normal eye was included<br />
in the study. If both eyes were normal or both were<br />
borderline, the eye with the better PSD value on HFA<br />
was selected and assigned to the study.<br />
Complete ophthalmic examination including visual<br />
acuity, intraocular pressure, gonioscopy and optic disc<br />
evaluation was performed. All patients initially<br />
underwent either 30-2 full threshold or SITA - standard<br />
white on white perimetry. The time gap between<br />
perimetry and OCT was not more than two weeks.<br />
Patients with spherical refractive errors <strong>of</strong> more than<br />
6D, astigmatism more than 3 Dioptres, visual acuity<br />
worse than 6/12 were excluded from the study. Other<br />
exclusion criteria were secondary causes <strong>of</strong> raised IOP,<br />
abnormal disc appearance such as tilted discs and<br />
suspected neurological diseases which are likely to<br />
affect the field testing. Those patients with extensive<br />
peripapillary atrophy were also excluded from the study.<br />
Definition <strong>of</strong> glaucoma suspect: For the purpose<br />
<strong>of</strong> this study a glaucoma suspect was defined as the<br />
presence <strong>of</strong> an abnormal disc appearance consistent<br />
with glaucoma as determined by an experienced<br />
clinician. Disc asymmetry <strong>of</strong> 0.2 or more was also<br />
included in the definition <strong>of</strong> glaucoma suspect.<br />
Observation procedures: All selected patients had<br />
a reliable visual field on Humphrey Visual Field<br />
Analyzer. Reliable fields were defined as fixation loss<br />
rate <strong>of</strong> less than 33 % and false positive and false negative<br />
error rates <strong>of</strong> less than 20 %. Normal and borderline<br />
definitions were based on the glaucoma hemi field test.<br />
OCT measurements: The test was performed after<br />
dilation <strong>of</strong> the pupil to at least 5 millimetre. Three<br />
measurements were performed for each eye. Only<br />
measurements with signal strengths <strong>of</strong> six or more were<br />
accepted as reliable for this study.<br />
Outcome Measures: Definite RNFL thinning (shaded<br />
as red) or borderline RNFL thinning (shaded as yellow)<br />
in either the inferior or superior portion <strong>of</strong> the disc<br />
was taken as the main outcome measure. Charts with<br />
only temporal or nasal thinning were excluded from<br />
the study.<br />
Statistical Analysis: The Fisher exact test was used to<br />
assess the statistical significance <strong>of</strong> glaucomatous<br />
changes in OCT in the presence <strong>of</strong> other risk factors<br />
like raised IOP, family history <strong>of</strong> glaucoma and enlarged<br />
cup-disc ratio. Odds ratio was also calculated for the<br />
above mentioned risk factors.<br />
Results<br />
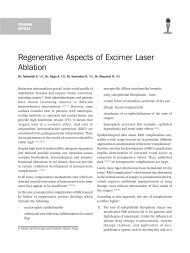
After all exclusions, 76 eyes <strong>of</strong> 76 patients were enrolled<br />
in the study, <strong>of</strong> which 51 were males and 25 were<br />
females. The age group distribution is shown in Figure1.<br />
Fig. 1. Age group distribution <strong>of</strong> the study population<br />
A total <strong>of</strong> 6 patients had abnormal OCT among the<br />
76 patients enrolled in the study.15 patients had a<br />
positive family history <strong>of</strong> glaucoma in either their first<br />
degree or second-degree relative and out <strong>of</strong> these 5<br />
had abnormal OCT. Only one person with abnormal<br />
OCT had no family history <strong>of</strong> glaucoma. The difference<br />
between the positive family history group and the<br />
negative family history group was statistically<br />
significant (p value 0.001, Fisher exact test). The odds<br />
<strong>of</strong> having an abnormal OCT was 36 times in persons<br />
having a positive family history <strong>of</strong> glaucoma.<br />
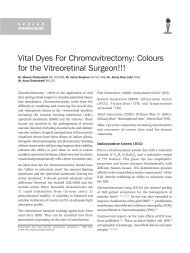
A total <strong>of</strong> 47 persons had a CD ratio <strong>of</strong> 0.6 or more, out<br />
<strong>of</strong> which 17 had CDR <strong>of</strong> more than 0.8 (Figure 2).<br />
5 out <strong>of</strong> 6 OCT positive persons had a CDR <strong>of</strong> 0.8 or<br />
more, and one had a CDR <strong>of</strong> 0.7. When a CDR <strong>of</strong> 0.6<br />
was taken as the cut-<strong>of</strong>f, the chance for having an
March 2008 Saikumar et al. - OCT in <strong>Pre</strong>-permetric <strong>Glaucoma</strong> 41<br />
abnormal OCT was not statistically significant (p value<br />
0.0768, Fisher exact test). But when CDR <strong>of</strong> 0.8 was<br />
taken as the cut-<strong>of</strong>f, the chances <strong>of</strong> having an abnormal<br />
OCT was statistically significant (p value 0.0017, Fisher<br />
exact test). Persons with a CDR <strong>of</strong> 0.8 or more are<br />
22 times more likely to have an abnormal OCT,<br />
compared to those having a CDR <strong>of</strong> 0.7 or less.<br />
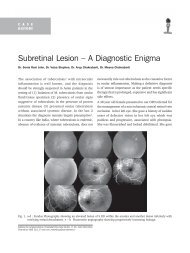
The mean IOP <strong>of</strong> the 76 eyes enrolled in the study was<br />
16.29. 26 patients had an IOP <strong>of</strong> 18 or more, out <strong>of</strong><br />
which only 7 eyes had an IOP <strong>of</strong> 22 mm Hg or more<br />
(Figure 3). 5 out <strong>of</strong> the 6 patients who had an abnormal<br />
OCT had IOP more than 18 mm Hg. With 18 mm Hg as<br />
the cut-<strong>of</strong>f, the chance <strong>of</strong> having an abnormal OCT was<br />
statistically significant (p value 0.0161, Fisher exact<br />
Fig. 2. Distribution <strong>of</strong> cup disc ratio in the study population<br />
test). The odds <strong>of</strong> having an abnormal OCT was 11<br />
times more in persons with an IOP <strong>of</strong> more than 18<br />
when compared to those with IOP <strong>of</strong> 17 or less.<br />
OCT in glaucoma is a very effective tool in identifying<br />
the true negatives. It shows that 70 out <strong>of</strong> 76 eyes was<br />
proven as not having glaucomatous damage. This gives<br />
the test a specificity <strong>of</strong> 92 %.<br />
Fig. 3. Distribution <strong>of</strong> IOP in the study population<br />
4 eyes had inferior thinning and 2 had superior thinning.<br />
No biarcuate thinning was seen in any <strong>of</strong> the six cases.<br />
5 eyes out <strong>of</strong> 6 had definite thinning <strong>of</strong> RNFL (shaded as<br />
red) and I had borderline thinning (shaded as yellow).<br />
In the 70 persons with normal OCT, mean RNFL<br />
thickness was 119.3 and 124 in the superior and inferior<br />
quadrants respectively. Compared to this, the same<br />
Table 1 showing mean superior and inferior RNFL<br />
thickness in patients with normal and abnormal OCT<br />
values were 79 and 75.33 respectively in the 6 patients<br />
with abnormal OCT. (Table 1)<br />
Discussion<br />
Mean superior Mean inferior<br />
RNFL thickness RNFL thickness<br />
(in microns) (in microns)<br />
Patients with 119.3 124<br />
normal OCT<br />
Patients with 79 75.33<br />
abnormal OCT<br />
We have studied 76 eyes <strong>of</strong> 76 patients who were<br />
clinically found to have some suspicion <strong>of</strong> <strong>Glaucoma</strong>.<br />
The numbers were slightly smaller compared to a few<br />
other studies 5, 6 . Ours was an observational study and<br />
there was no control group, which were used in other<br />
studies 5, 6 . In the study by Kanamori et al 6 normal<br />
population, glaucoma suspects, ocular Hypertensives<br />
and glaucoma patients were included in the study and<br />
compared. We were only studying the ability <strong>of</strong> the<br />
OCT in picking up <strong>Pre</strong> <strong>perimetric</strong> glaucoma in suspected<br />
cases.<br />
The role <strong>of</strong> family history has been highlighted in many<br />
studies 7,8,9 although the incidence <strong>of</strong> MYOC mutation<br />
among Indian primary open angle glaucoma patients<br />
has been found to be lower compared to certain other<br />
parts <strong>of</strong> the world 10 . In our study, in glaucoma suspects<br />
with normal fields, those with positive family history<br />
<strong>of</strong> glaucoma are 36 times more likely to have an<br />
abnormality in OCT when compared to those with no<br />
family history <strong>of</strong> glaucoma.<br />
Cup – disc ratio has been used to define glaucoma<br />
suspects in many other studies 11 . Lalezary et al 11 have
42 Kerala Journal <strong>of</strong> Ophthalmology Vol. XX, No. 1<br />
used stereo photographs to classify the study<br />
population into normal and glaucoma suspects. In our<br />
study the classification has been done by an experienced<br />
glaucoma specialist by <strong>using</strong> 78 D lens biomicroscopy.<br />
In our study, the specificity was a healthy 92 %, which<br />
means the OCT is a good tool to rule out disease.<br />
Sensitivity was not calculated in our study since this<br />
requires a normal age-matched control group. Budenz<br />
et al showed a sensitivity <strong>of</strong> 84 % and a specificity <strong>of</strong><br />
98 % in their study on <strong>perimetric</strong> glaucomas 12 .<br />
As expected the mean RNFL thickness in the inferior<br />
and superior quadrant was significantly lower in the<br />
abnormal OCT group compared to the normal OCT group.<br />
Kanamori et al have studied the temporal and nasal<br />
thickness also along with the superior and inferior 6 .<br />
We felt that many errors may crop up if the nasal and<br />
temporal thickness was included. Also the inferior and<br />
superior poles were the first affected in early glaucoma.<br />
The normal OCT showed the characteristic double-hump<br />
pattern which is in agreement with other human 6 and<br />
histologic studies 13 .<br />
Self assessment <strong>of</strong> this study – STARD<br />
guidelines<br />
Standards for Reporting <strong>of</strong> Diagnostic Accuracy<br />
(STARD) is an internationally accepted method <strong>of</strong><br />
assessing a study conducted on a diagnostic equipment.<br />
A recent report on the quality <strong>of</strong> reporting <strong>of</strong> diagnostic<br />
accuracy was conducted with 30 published articles. The<br />
STARD guideline consists <strong>of</strong> 25 points which are to be<br />
fulfilled for a good diagnostic study 14 . In this meta<br />
analysis only 26 % <strong>of</strong> the papers reported more than<br />
half <strong>of</strong> the STARD items. Our study has reported<br />
11 out <strong>of</strong> the 25 STARD items, and this compares well<br />
with many published articles on diagnostic accuracy <strong>of</strong><br />
OCT in diagnosis <strong>of</strong> early glaucoma.<br />
Conclusion<br />
<strong>Optical</strong> Coherence Tomography is a useful tool for pre<br />
<strong>perimetric</strong> diagnosis <strong>of</strong> glaucoma. The usefulness <strong>of</strong><br />
this tool increases in the presence <strong>of</strong> other risk factors<br />
like family history <strong>of</strong> glaucoma, large cup disc ratio<br />
and high intra ocular pressure. The specificity <strong>of</strong> this<br />
tool in our study was 92 % which makes it a good tool<br />
to rule out those who do not have glaucoma.<br />
Comparative studies with the other imaging tools like<br />
HRT and GDx are needed in our population to<br />
determine which is the best tool for diagnosis <strong>of</strong> early<br />
glaucoma.<br />
References<br />
1. Sommer A, Miller NR, Pollack I et al. The nerve fiber<br />
layer in the diagnosis <strong>of</strong> glaucoma. Arch Ophthalmol<br />
1977; 95: 2149-2156.<br />
2. Quigley HA, Addicks EM, Green R. Optic nerve damage<br />
in human <strong>Glaucoma</strong>. III: Quantitative correlation <strong>of</strong><br />
nerve fiber loss and visual field defect in glaucoma.<br />
Arch Ophthalmol 1982; 100: 135-146.<br />
3. Huang D, Swanson EA, Lin CP et al. <strong>Optical</strong> Coherence<br />
Tomography. Science 1991; 254: 1178-81.<br />
4. American Academy <strong>of</strong> Ophthalmology <strong>Pre</strong>ferred<br />
Practice Patterns Committee, <strong>Glaucoma</strong> Panel. Primary<br />
Open Angle <strong>Glaucoma</strong> Suspect. San Francisco. 2002.<br />
5. Nouri-Mahdavi K, H<strong>of</strong>fman D, Tannenbaum DP et al.<br />
Identifying early glaucoma with <strong>Optical</strong> Coherence<br />
Tomography. Am J Ophthalmol 2004; 137: 228-235.<br />
6. Kanamori A, Nakamura M, Escano MFT et al. Evaluation<br />
<strong>of</strong> the <strong>Glaucoma</strong>tous damage on Retinal Nerve Fiber<br />
Thickness measured by <strong>Optical</strong> Coherence Tomography.<br />
Am J Ophthalmol 2003; 135: 513-520<br />
7. McNought AI, Allen JG, Healy DL et al. Accuracy and<br />
implications <strong>of</strong> a reported family history <strong>of</strong> glaucoma.<br />
Experience from the <strong>Glaucoma</strong> Inheritance study. Arch<br />
Ophthalmol 2000 July; 118(7): 900-904.<br />
8. Wu J, Hewitt AW, Green CM et al. Disease severity <strong>of</strong><br />
familial glaucoma compared with sporadic glaucoma.<br />
Arch Ophthalmol 2006 July 124 (7): 950-954.<br />
9. Leske MC, Wu SY, Hennis A et al. Risk factors for<br />
incident glaucoma – The Barbados Eye Study.<br />
Ophthalmology July 2007.<br />
10. Sripriya S, Uthra S, Sangeetha R et al. Low frequency<br />
<strong>of</strong> MYOC mutations in Indian POAG patients. Clin Genet<br />
2004 Apr; 56 (4): 333-337.<br />
11. Lalezary M, Medeiros FA, Weinreb RN et al. Baseline<br />
<strong>Optical</strong> Coherence Tomography predicts the development<br />
<strong>of</strong> <strong>Glaucoma</strong>tous change in <strong>Glaucoma</strong> Suspects. Am J<br />
Ophthalmol 2006; 142:576 e1 – 576 e8.<br />
12. Budenz DL, Michael A, Chang RT et al. Sensitivity and<br />
Specificity <strong>of</strong> the Stratus OCT for Perimetric <strong>Glaucoma</strong>.<br />
Ophthalmology 2005; 112: 3-9.<br />
13. Varma R, Skaf M, Barron E. Retinal nerve fiber thickness<br />
in normal human eyes. Ophthalmology 1996; 103:<br />
2114-2119.<br />
14. Johnson ZK, Siddiqui MAR, Azuara-Blanco A. The<br />
Quality <strong>of</strong> reporting <strong>of</strong> Diagnostic Accuracy studies <strong>of</strong><br />
<strong>Optical</strong> Coherence Tomography studies in <strong>Glaucoma</strong>.<br />
Ophthalmology 2007; 114: 1607-1612.