Pavement Structural Analysis of the Design Recommendations for ...
Pavement Structural Analysis of the Design Recommendations for ...
Pavement Structural Analysis of the Design Recommendations for ...

Create successful ePaper yourself
Turn your PDF publications into a flip-book with our unique Google optimized e-Paper software.
<strong>Pavement</strong> <strong>Structural</strong> <strong>Analysis</strong> August 2004<br />
Report No. 15953-2/1 ARA-ERES Consultants<br />
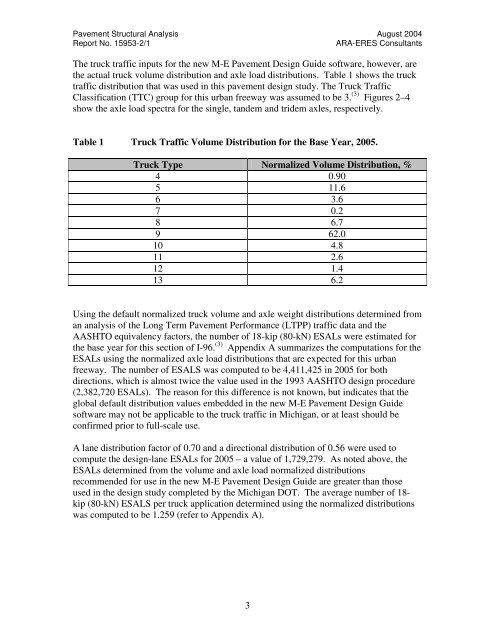
The truck traffic inputs <strong>for</strong> <strong>the</strong> new M-E <strong>Pavement</strong> <strong>Design</strong> Guide s<strong>of</strong>tware, however, are<br />
<strong>the</strong> actual truck volume distribution and axle load distributions. Table 1 shows <strong>the</strong> truck<br />
traffic distribution that was used in this pavement design study. The Truck Traffic<br />
Classification (TTC) group <strong>for</strong> this urban freeway was assumed to be 3. (3) Figures 2–4<br />
show <strong>the</strong> axle load spectra <strong>for</strong> <strong>the</strong> single, tandem and tridem axles, respectively.<br />
Table 1 Truck Traffic Volume Distribution <strong>for</strong> <strong>the</strong> Base Year, 2005.<br />
Truck Type Normalized Volume Distribution, %<br />
4 0.90<br />
5 11.6<br />
6 3.6<br />
7 0.2<br />
8 6.7<br />
9 62.0<br />
10 4.8<br />
11 2.6<br />
12 1.4<br />
13 6.2<br />
Using <strong>the</strong> default normalized truck volume and axle weight distributions determined from<br />
an analysis <strong>of</strong> <strong>the</strong> Long Term <strong>Pavement</strong> Per<strong>for</strong>mance (LTPP) traffic data and <strong>the</strong><br />
AASHTO equivalency factors, <strong>the</strong> number <strong>of</strong> 18-kip (80-kN) ESALs were estimated <strong>for</strong><br />
<strong>the</strong> base year <strong>for</strong> this section <strong>of</strong> I-96. (3) Appendix A summarizes <strong>the</strong> computations <strong>for</strong> <strong>the</strong><br />
ESALs using <strong>the</strong> normalized axle load distributions that are expected <strong>for</strong> this urban<br />
freeway. The number <strong>of</strong> ESALS was computed to be 4,411,425 in 2005 <strong>for</strong> both<br />
directions, which is almost twice <strong>the</strong> value used in <strong>the</strong> 1993 AASHTO design procedure<br />
(2,382,720 ESALs). The reason <strong>for</strong> this difference is not known, but indicates that <strong>the</strong><br />
global default distribution values embedded in <strong>the</strong> new M-E <strong>Pavement</strong> <strong>Design</strong> Guide<br />
s<strong>of</strong>tware may not be applicable to <strong>the</strong> truck traffic in Michigan, or at least should be<br />
confirmed prior to full-scale use.<br />
A lane distribution factor <strong>of</strong> 0.70 and a directional distribution <strong>of</strong> 0.56 were used to<br />
compute <strong>the</strong> design-lane ESALs <strong>for</strong> 2005 – a value <strong>of</strong> 1,729,279. As noted above, <strong>the</strong><br />
ESALs determined from <strong>the</strong> volume and axle load normalized distributions<br />
recommended <strong>for</strong> use in <strong>the</strong> new M-E <strong>Pavement</strong> <strong>Design</strong> Guide are greater than those<br />
used in <strong>the</strong> design study completed by <strong>the</strong> Michigan DOT. The average number <strong>of</strong> 18kip<br />
(80-kN) ESALS per truck application determined using <strong>the</strong> normalized distributions<br />
was computed to be 1.259 (refer to Appendix A).<br />
3