Current State of Cross-Border Banking - Vrije Universiteit Amsterdam
Current State of Cross-Border Banking - Vrije Universiteit Amsterdam
Current State of Cross-Border Banking - Vrije Universiteit Amsterdam
You also want an ePaper? Increase the reach of your titles
YUMPU automatically turns print PDFs into web optimized ePapers that Google loves.
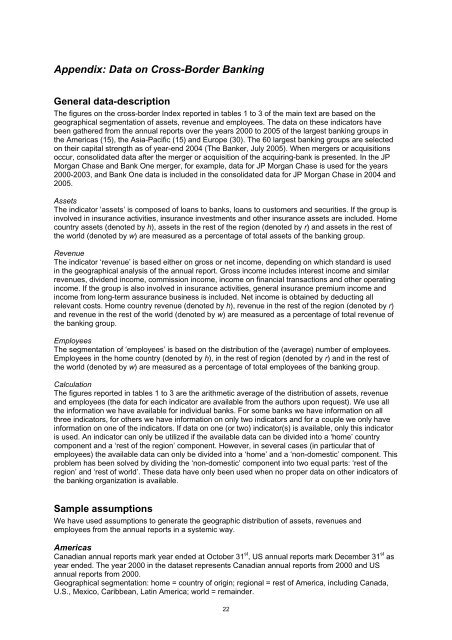
Appendix: Data on <strong>Cross</strong>-<strong>Border</strong> <strong>Banking</strong><br />
General data-description<br />
The figures on the cross-border Index reported in tables 1 to 3 <strong>of</strong> the main text are based on the<br />
geographical segmentation <strong>of</strong> assets, revenue and employees. The data on these indicators have<br />
been gathered from the annual reports over the years 2000 to 2005 <strong>of</strong> the largest banking groups in<br />
the Americas (15), the Asia-Pacific (15) and Europe (30). The 60 largest banking groups are selected<br />
on their capital strength as <strong>of</strong> year-end 2004 (The Banker, July 2005). When mergers or acquisitions<br />
occur, consolidated data after the merger or acquisition <strong>of</strong> the acquiring-bank is presented. In the JP<br />
Morgan Chase and Bank One merger, for example, data for JP Morgan Chase is used for the years<br />
2000-2003, and Bank One data is included in the consolidated data for JP Morgan Chase in 2004 and<br />
2005.<br />
Assets<br />
The indicator ‘assets’ is composed <strong>of</strong> loans to banks, loans to customers and securities. If the group is<br />
involved in insurance activities, insurance investments and other insurance assets are included. Home<br />
country assets (denoted by h), assets in the rest <strong>of</strong> the region (denoted by r) and assets in the rest <strong>of</strong><br />
the world (denoted by w) are measured as a percentage <strong>of</strong> total assets <strong>of</strong> the banking group.<br />
Revenue<br />
The indicator ‘revenue’ is based either on gross or net income, depending on which standard is used<br />
in the geographical analysis <strong>of</strong> the annual report. Gross income includes interest income and similar<br />
revenues, dividend income, commission income, income on financial transactions and other operating<br />
income. If the group is also involved in insurance activities, general insurance premium income and<br />
income from long-term assurance business is included. Net income is obtained by deducting all<br />
relevant costs. Home country revenue (denoted by h), revenue in the rest <strong>of</strong> the region (denoted by r)<br />
and revenue in the rest <strong>of</strong> the world (denoted by w) are measured as a percentage <strong>of</strong> total revenue <strong>of</strong><br />
the banking group.<br />
Employees<br />
The segmentation <strong>of</strong> ‘employees’ is based on the distribution <strong>of</strong> the (average) number <strong>of</strong> employees.<br />
Employees in the home country (denoted by h), in the rest <strong>of</strong> region (denoted by r) and in the rest <strong>of</strong><br />
the world (denoted by w) are measured as a percentage <strong>of</strong> total employees <strong>of</strong> the banking group.<br />
Calculation<br />
The figures reported in tables 1 to 3 are the arithmetic average <strong>of</strong> the distribution <strong>of</strong> assets, revenue<br />
and employees (the data for each indicator are available from the authors upon request). We use all<br />
the information we have available for individual banks. For some banks we have information on all<br />
three indicators, for others we have information on only two indicators and for a couple we only have<br />
information on one <strong>of</strong> the indicators. If data on one (or two) indicator(s) is available, only this indicator<br />
is used. An indicator can only be utilized if the available data can be divided into a ‘home’ country<br />
component and a ‘rest <strong>of</strong> the region’ component. However, in several cases (in particular that <strong>of</strong><br />
employees) the available data can only be divided into a ‘home’ and a ‘non-domestic’ component. This<br />
problem has been solved by dividing the ‘non-domestic’ component into two equal parts: ‘rest <strong>of</strong> the<br />
region’ and ‘rest <strong>of</strong> world’. These data have only been used when no proper data on other indicators <strong>of</strong><br />
the banking organization is available.<br />
Sample assumptions<br />
We have used assumptions to generate the geographic distribution <strong>of</strong> assets, revenues and<br />
employees from the annual reports in a systemic way.<br />
Americas<br />
Canadian annual reports mark year ended at October 31 st , US annual reports mark December 31 st as<br />
year ended. The year 2000 in the dataset represents Canadian annual reports from 2000 and US<br />
annual reports from 2000.<br />
Geographical segmentation: home = country <strong>of</strong> origin; regional = rest <strong>of</strong> America, including Canada,<br />
U.S., Mexico, Caribbean, Latin America; world = remainder.<br />
22


