Current State of Cross-Border Banking - Vrije Universiteit Amsterdam
Current State of Cross-Border Banking - Vrije Universiteit Amsterdam
Current State of Cross-Border Banking - Vrije Universiteit Amsterdam

You also want an ePaper? Increase the reach of your titles
YUMPU automatically turns print PDFs into web optimized ePapers that Google loves.
downward trend <strong>of</strong> international (regional and global) business is statistically significant at the 5% level<br />
(p = 0.0292).<br />
Insert table 3. Index for the <strong>Cross</strong>-<strong>Border</strong> Business <strong>of</strong> Top 30 European <strong>Banking</strong> Groups<br />
European banks have a far smaller domestic orientation with a domestic component <strong>of</strong> about 54% in<br />
table 3. Both regional business (20 to 23%) and global business (about 25%) is rather large. While<br />
there is no clear up- or downtrend in the domestic component, there is a clear increase in regional<br />
business at the expense <strong>of</strong> global business. The increase <strong>of</strong> regional business in Europe from 20% in<br />
2000 to 23% in 2005 is statistically significant at the 1% level (p = 0.0014). The decrease <strong>of</strong> global<br />
business is statistically significant at the 10% level (p = 0.0875). It is remarkable that regional business<br />
has been growing over the last 6 years, while most European countries have experienced a recession<br />
during this period (with the exception <strong>of</strong> Spain and the UK which have had a major economic<br />
expansion during this period).<br />
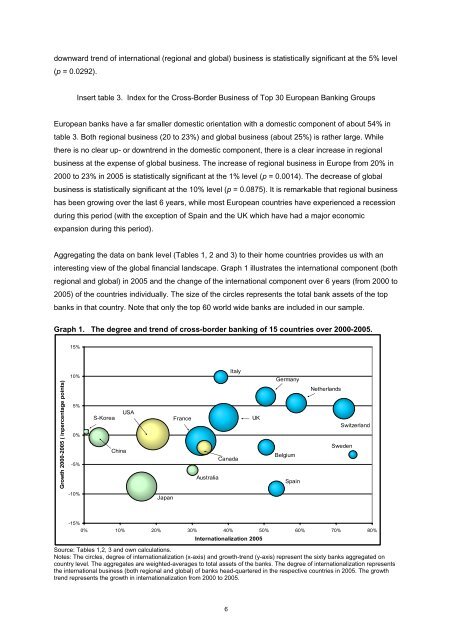
Aggregating the data on bank level (Tables 1, 2 and 3) to their home countries provides us with an<br />
interesting view <strong>of</strong> the global financial landscape. Graph 1 illustrates the international component (both<br />
regional and global) in 2005 and the change <strong>of</strong> the international component over 6 years (from 2000 to<br />
2005) <strong>of</strong> the countries individually. The size <strong>of</strong> the circles represents the total bank assets <strong>of</strong> the top<br />
banks in that country. Note that only the top 60 world wide banks are included in our sample.<br />
Graph 1. The degree and trend <strong>of</strong> cross-border banking <strong>of</strong> 15 countries over 2000-2005.<br />
Growth 2000-2005 ( inpercentage points)<br />
15%<br />
10%<br />
5%<br />
0%<br />
-5%<br />
-10%<br />
-15%<br />
S-Korea<br />
China<br />
USA<br />
Japan<br />
France<br />
Australia<br />
Italy<br />
Canada<br />
UK<br />
Germany<br />
Belgium<br />
Spain<br />
Netherlands<br />
Switzerland<br />
Sweden<br />
0% 10% 20% 30% 40% 50% 60% 70% 80%<br />
Internationalization 2005<br />
Source: Tables 1,2, 3 and own calculations.<br />
Notes: The circles, degree <strong>of</strong> internationalization (x-axis) and growth-trend (y-axis) represent the sixty banks aggregated on<br />
country level. The aggregates are weighted-averages to total assets <strong>of</strong> the banks. The degree <strong>of</strong> internationalization represents<br />
the international business (both regional and global) <strong>of</strong> banks head-quartered in the respective countries in 2005. The growth<br />
trend represents the growth in internationalization from 2000 to 2005.<br />
6