SOCIOLOGY EDUCATION - American Sociological Association
SOCIOLOGY EDUCATION - American Sociological Association
SOCIOLOGY EDUCATION - American Sociological Association

Create successful ePaper yourself
Turn your PDF publications into a flip-book with our unique Google optimized e-Paper software.
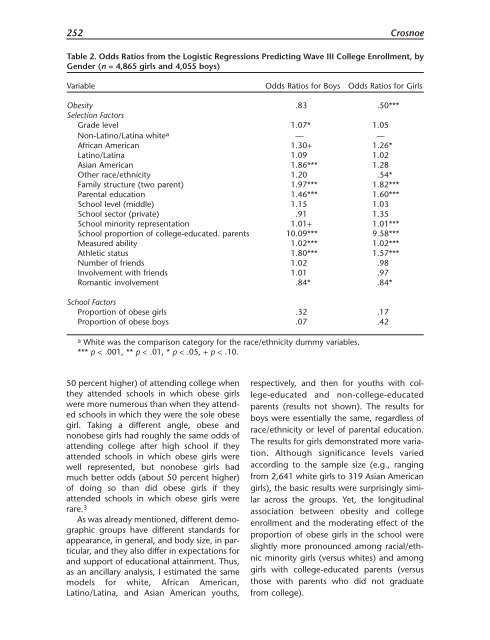
252 Crosnoe<br />
Table 2. Odds Ratios from the Logistic Regressions Predicting Wave III College Enrollment, by<br />
Gender (n = 4,865 girls and 4,055 boys)<br />
Variable Odds Ratios for Boys Odds Ratios for Girls<br />
Obesity .83 .50***<br />
Selection Factors<br />
Grade level 1.07* 1.05<br />
Non-Latino/Latina white a — —<br />
African <strong>American</strong> 1.30+ 1.26*<br />
Latino/Latina 1.09 1.02<br />
Asian <strong>American</strong> 1.86*** 1.28<br />
Other race/ethnicity 1.20 .54*<br />
Family structure (two parent) 1.97*** 1.82***<br />
Parental education 1.46*** 1.60***<br />
School level (middle) 1.15 1.03<br />
School sector (private) .91 1.35<br />
School minority representation 1.01+ 1.01***<br />
School proportion of college-educated. parents 10.09*** 9.58***<br />
Measured ability 1.02*** 1.02***<br />
Athletic status 1.80*** 1.57***<br />
Number of friends 1.02 .98<br />
Involvement with friends 1.01 .97<br />
Romantic involvement .84* .84*<br />
School Factors<br />
Proportion of obese girls .32 .17<br />
Proportion of obese boys .07 .42<br />
a White was the comparison category for the race/ethnicity dummy variables.<br />
*** p < .001, ** p < .01, * p < .05, + p < .10.<br />
50 percent higher) of attending college when<br />
they attended schools in which obese girls<br />
were more numerous than when they attended<br />
schools in which they were the sole obese<br />
girl. Taking a different angle, obese and<br />
nonobese girls had roughly the same odds of<br />
attending college after high school if they<br />
attended schools in which obese girls were<br />
well represented, but nonobese girls had<br />
much better odds (about 50 percent higher)<br />
of doing so than did obese girls if they<br />
attended schools in which obese girls were<br />
rare. 3<br />
As was already mentioned, different demographic<br />
groups have different standards for<br />
appearance, in general, and body size, in particular,<br />
and they also differ in expectations for<br />
and support of educational attainment. Thus,<br />
as an ancillary analysis, I estimated the same<br />
models for white, African <strong>American</strong>,<br />
Latino/Latina, and Asian <strong>American</strong> youths,<br />
respectively, and then for youths with college-educated<br />
and non-college-educated<br />
parents (results not shown). The results for<br />
boys were essentially the same, regardless of<br />
race/ethnicity or level of parental education.<br />
The results for girls demonstrated more variation.<br />
Although significance levels varied<br />
according to the sample size (e.g., ranging<br />
from 2,641 white girls to 319 Asian <strong>American</strong><br />
girls), the basic results were surprisingly similar<br />
across the groups. Yet, the longitudinal<br />
association between obesity and college<br />
enrollment and the moderating effect of the<br />
proportion of obese girls in the school were<br />
slightly more pronounced among racial/ethnic<br />
minority girls (versus whites) and among<br />
girls with college-educated parents (versus<br />
those with parents who did not graduate<br />
from college).