SOCIOLOGY EDUCATION - American Sociological Association
SOCIOLOGY EDUCATION - American Sociological Association
SOCIOLOGY EDUCATION - American Sociological Association

You also want an ePaper? Increase the reach of your titles
YUMPU automatically turns print PDFs into web optimized ePapers that Google loves.
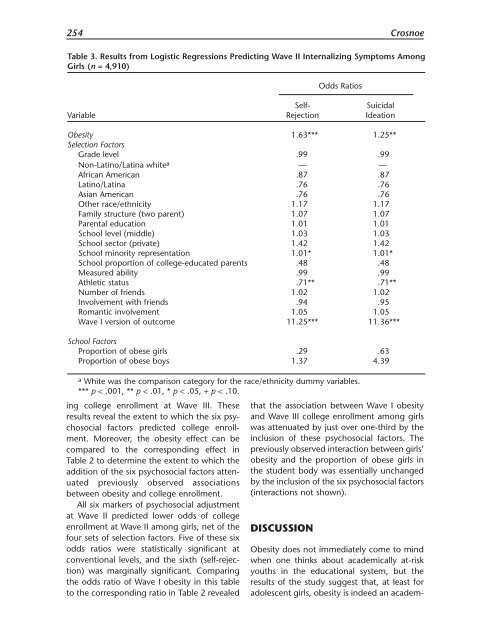
254 Crosnoe<br />
Table 3. Results from Logistic Regressions Predicting Wave II Internalizing Symptoms Among<br />
Girls (n = 4,910)<br />
ing college enrollment at Wave III. These<br />
results reveal the extent to which the six psychosocial<br />
factors predicted college enrollment.<br />
Moreover, the obesity effect can be<br />
compared to the corresponding effect in<br />
Table 2 to determine the extent to which the<br />
addition of the six psychosocial factors attenuated<br />
previously observed associations<br />
between obesity and college enrollment.<br />
All six markers of psychosocial adjustment<br />
at Wave II predicted lower odds of college<br />
enrollment at Wave II among girls, net of the<br />
four sets of selection factors. Five of these six<br />
odds ratios were statistically significant at<br />
conventional levels, and the sixth (self-rejection)<br />
was marginally significant. Comparing<br />
the odds ratio of Wave I obesity in this table<br />
to the corresponding ratio in Table 2 revealed<br />
that the association between Wave I obesity<br />
and Wave III college enrollment among girls<br />
was attenuated by just over one-third by the<br />
inclusion of these psychosocial factors. The<br />
previously observed interaction between girls’<br />
obesity and the proportion of obese girls in<br />
the student body was essentially unchanged<br />
by the inclusion of the six psychosocial factors<br />
(interactions not shown).<br />
DISCUSSION<br />
Odds Ratios<br />
Self- Suicidal<br />
Variable Rejection Ideation<br />
Obesity 1.63*** 1.25**<br />
Selection Factors<br />
Grade level .99 .99<br />
Non-Latino/Latina white a — —<br />
African <strong>American</strong> .87 .87<br />
Latino/Latina .76 .76<br />
Asian <strong>American</strong> .76 .76<br />
Other race/ethnicity 1.17 1.17<br />
Family structure (two parent) 1.07 1.07<br />
Parental education 1.01 1.01<br />
School level (middle) 1.03 1.03<br />
School sector (private) 1.42 1.42<br />
School minority representation 1.01* 1.01*<br />
School proportion of college-educated parents .48 .48<br />
Measured ability .99 .99<br />
Athletic status .71** .71**<br />
Number of friends 1.02 1.02<br />
Involvement with friends .94 .95<br />
Romantic involvement 1.05 1.05<br />
Wave I version of outcome 11.25*** 11.36***<br />
School Factors<br />
Proportion of obese girls .29 .63<br />
Proportion of obese boys 1.37 4.39<br />
a White was the comparison category for the race/ethnicity dummy variables.<br />
*** p < .001, ** p < .01, * p < .05, + p < .10.<br />
Obesity does not immediately come to mind<br />
when one thinks about academically at-risk<br />
youths in the educational system, but the<br />
results of the study suggest that, at least for<br />
adolescent girls, obesity is indeed an academ-