The Revised CONSORT Statement for Reporting Randomized Trials
The Revised CONSORT Statement for Reporting Randomized Trials
The Revised CONSORT Statement for Reporting Randomized Trials
You also want an ePaper? Increase the reach of your titles
YUMPU automatically turns print PDFs into web optimized ePapers that Google loves.
Academia and Clinic <strong>The</strong> <strong>CONSORT</strong> <strong>Statement</strong>: Explanation and Elaboration<br />
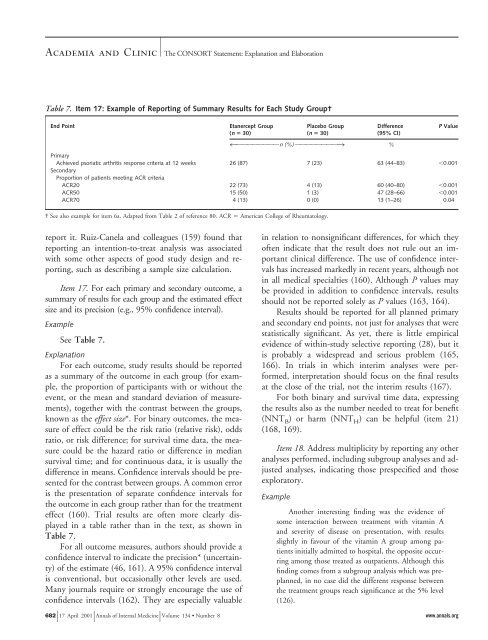
Table 7. Item 17: Example of <strong>Reporting</strong> of Summary Results <strong>for</strong> Each Study Group†<br />
End Point Etanercept Group<br />
(n 30)<br />
report it. Ruiz-Canela and colleagues (159) found that<br />
reporting an intention-to-treat analysis was associated<br />
with some other aspects of good study design and reporting,<br />
such as describing a sample size calculation.<br />
Item 17. For each primary and secondary outcome, a<br />
summary of results <strong>for</strong> each group and the estimated effect<br />
size and its precision (e.g., 95% confidence interval).<br />
Example<br />
See Table 7.<br />
Explanation<br />
For each outcome, study results should be reported<br />
as a summary of the outcome in each group (<strong>for</strong> example,<br />
the proportion of participants with or without the<br />
event, or the mean and standard deviation of measurements),<br />
together with the contrast between the groups,<br />
known as the effect size*. For binary outcomes, the measure<br />
of effect could be the risk ratio (relative risk), odds<br />
ratio, or risk difference; <strong>for</strong> survival time data, the measure<br />
could be the hazard ratio or difference in median<br />
survival time; and <strong>for</strong> continuous data, it is usually the<br />
difference in means. Confidence intervals should be presented<br />
<strong>for</strong> the contrast between groups. A common error<br />
is the presentation of separate confidence intervals <strong>for</strong><br />
the outcome in each group rather than <strong>for</strong> the treatment<br />
effect (160). Trial results are often more clearly displayed<br />
in a table rather than in the text, as shown in<br />
Table 7.<br />
For all outcome measures, authors should provide a<br />
confidence interval to indicate the precision* (uncertainty)<br />
of the estimate (46, 161). A 95% confidence interval<br />
is conventional, but occasionally other levels are used.<br />
Many journals require or strongly encourage the use of<br />
confidence intervals (162). <strong>The</strong>y are especially valuable<br />
in relation to nonsignificant differences, <strong>for</strong> which they<br />
often indicate that the result does not rule out an important<br />
clinical difference. <strong>The</strong> use of confidence intervals<br />
has increased markedly in recent years, although not<br />
in all medical specialties (160). Although P values may<br />
be provided in addition to confidence intervals, results<br />
should not be reported solely as P values (163, 164).<br />
Results should be reported <strong>for</strong> all planned primary<br />
and secondary end points, not just <strong>for</strong> analyses that were<br />
statistically significant. As yet, there is little empirical<br />
evidence of within-study selective reporting (28), but it<br />
is probably a widespread and serious problem (165,<br />
166). In trials in which interim analyses were per<strong>for</strong>med,<br />
interpretation should focus on the final results<br />
at the close of the trial, not the interim results (167).<br />
For both binary and survival time data, expressing<br />
the results also as the number needed to treat <strong>for</strong> benefit<br />
(NNT B) or harm (NNT H) can be helpful (item 21)<br />
(168, 169).<br />
Item 18. Address multiplicity by reporting any other<br />
analyses per<strong>for</strong>med, including subgroup analyses and adjusted<br />
analyses, indicating those prespecified and those<br />
exploratory.<br />
Example<br />
Placebo Group<br />
(n 30)<br />
Difference<br />
(95% CI)<br />
4OOOOOOOO n (%) OOOOOOOO3<br />
%<br />
Primary<br />
Achieved psoriatic arthritis response criteria at 12 weeks<br />
Secondary<br />
Proportion of patients meeting ACR criteria<br />
26 (87) 7 (23) 63 (44–83) 0.001<br />
ACR20 22 (73) 4 (13) 60 (40–80) 0.001<br />
ACR50 15 (50) 1 (3) 47 (28–66) 0.001<br />
ACR70 4 (13) 0 (0) 13 (1–26) 0.04<br />
† See also example <strong>for</strong> item 6a. Adapted from Table 2 of reference 80. ACR American College of Rheumatology.<br />
Another interesting finding was the evidence of<br />
some interaction between treatment with vitamin A<br />
and severity of disease on presentation, with results<br />
slightly in favour of the vitamin A group among patients<br />
initially admitted to hospital, the opposite occurring<br />
among those treated as outpatients. Although this<br />
finding comes from a subgroup analysis which was preplanned,<br />
in no case did the different response between<br />
the treatment groups reach significance at the 5% level<br />
(126).<br />
682 17 April 2001 Annals of Internal Medicine Volume 134 • Number 8 www.annals.org<br />
P Value


