Gugrajah_Yuvaan_ Ramesh_2003.pdf
Gugrajah_Yuvaan_ Ramesh_2003.pdf
Gugrajah_Yuvaan_ Ramesh_2003.pdf
You also want an ePaper? Increase the reach of your titles
YUMPU automatically turns print PDFs into web optimized ePapers that Google loves.
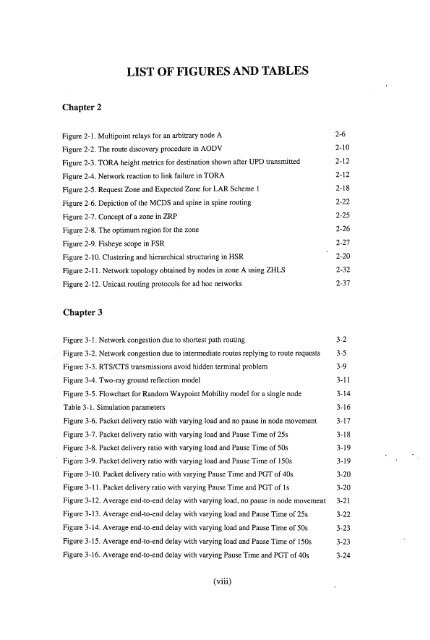
Chapter 2<br />
LIST OF FIGURES AND TABLES<br />
Figure 2-1. Multipoint relays for an arbitrary node A<br />
Figure 2-2. The route discovery procedure in AODV<br />
Figure 2-3. TORA height metrics for destination shown after UPD transmitted<br />
Figure 2-4. Network reaction to link failure in TORA<br />
Figure 2-5. Request Zone and Expected Zone for LAR Scheme I<br />
Figure 2-6. Depiction of the MCDS and spine in spine routing<br />
Figure 2-7. Concept ofa zone in ZRP<br />
Figure 2-8. The optimum region for the zone<br />
Figure 2-9. Fisheye scope in FSR<br />
Figure 2-10. Clustering and hierarchical structuring in HSR<br />
Figure 2-11. Network topology obtained by nodes in zone A using ZHLS<br />
Figure 2-12. Unicast routing protocols for ad hoc networks<br />
Chapter 3<br />
2-6<br />
2-10<br />
2-12<br />
2-12<br />
2-18<br />
2-22<br />
2-25<br />
2-26<br />
2-27<br />
2-20<br />
2-32<br />
Figure 3-1. Network congestion due to shortest path routing 3-2<br />
Figure 3-2. Network congestion due to intermediate routes replying to route requests 3-5<br />
Figure 3-3. RTS/CTS transmissions avoid hidden terminal problem 3-9<br />
Figure 3-4. Two-ray ground reflection model 3-11<br />
Figure 3-5. Flowchart for Random Waypoint Mobility model for a single node 3-14<br />
Table 3-1. Simulation parameters 3-16<br />
Figure 3-6. Packet delivery ratio with varying load and no pause in node movement 3-17<br />
Figure 3-7. Packet delivery ratio with varying load and Pause Time of 25s 3-18<br />
Figure 3-8. Packet delivery ratio with varying load and Pause Time of 50s 3-19<br />
Figure 3-9. Packet delivery ratio with varying load and Pause Time of 1505 3-19<br />
Figure 3-10. Packet delivery ratio with varying Pause Time and PGT of 40s 3-20<br />
Figure 3-11. Packet delivery ratio with varying Pause Time and PGT of Is 3-20<br />
Figure 3-12. Average end-to-end delay with varying load, no pause in node movement 3-21<br />
Figure 3-13. Average end-to-end delay with varying load and Pause Time of 25s 3-22<br />
Figure 3-14. Average end-to-end delay with varying load and Pause Time of 50s 3-23<br />
Figure 3-15. Average end-to-end delay with varying load and Pause Time of 150s 3-23<br />
Figure 3-16. Average end-to-end delay with varying Pause Time and PGT of 40s 3-24<br />
(viii)<br />
2-37


