
Create successful ePaper yourself
Turn your PDF publications into a flip-book with our unique Google optimized e-Paper software.
English Maths. 2nd Year, Bilingual Section at Modesto Navarro. La Solana.<br />
EXAMPLE: BARS DIAGRAM.<br />
1. In a survey about soft drinks which young people drink, the results have been:<br />
KIND OF SOFT DRINK NUMBER OF YOUNG PEOPLE<br />
ORANGE 20<br />
LEMON 25<br />
COLA 35<br />
TROPICAL FRUITS 15<br />
Represent the information using a bars diagram .<br />
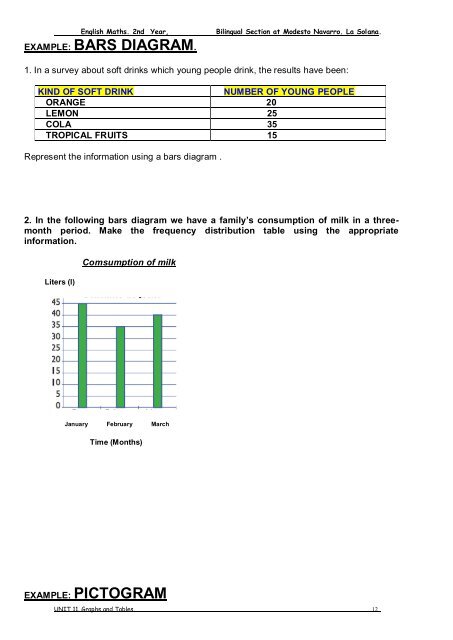
2. In the following bars diagram we have a family’s consumption of milk in a threemonth<br />
period. Make the frequency distribution table using the appropriate<br />
information.<br />
Liters (l)<br />
Comsumption of milk<br />
January February March<br />
Time (Months)<br />
EXAMPLE: PICTOGRAM<br />
UNIT 11. Graphs and Tables. 12