
You also want an ePaper? Increase the reach of your titles
YUMPU automatically turns print PDFs into web optimized ePapers that Google loves.
English Maths. 2nd Year, Bilingual Section at Modesto Navarro. La Solana.<br />
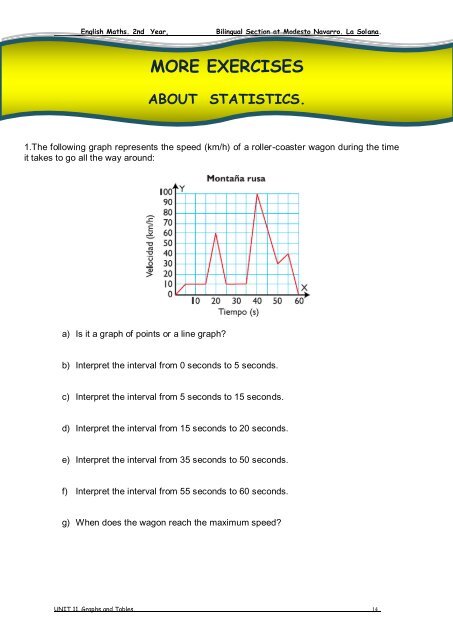
1.The following graph represents the speed (km/h) of a roller-coaster wagon during the time<br />
it takes to go all the way around:<br />
a) Is it a graph of points or a line graph?<br />
MORE EXERCISES<br />
ABOUT STATISTICS.<br />
b) Interpret the interval from 0 seconds to 5 seconds.<br />
c) Interpret the interval from 5 seconds to 15 seconds.<br />
d) Interpret the interval from 15 seconds to 20 seconds.<br />
e) Interpret the interval from 35 seconds to 50 seconds.<br />
f) Interpret the interval from 55 seconds to 60 seconds.<br />
g) When does the wagon reach the maximum speed?<br />
UNIT 11. Graphs and Tables. 14