
You also want an ePaper? Increase the reach of your titles
YUMPU automatically turns print PDFs into web optimized ePapers that Google loves.
English Maths. 2nd Year, Bilingual Section at Modesto Navarro. La Solana.<br />
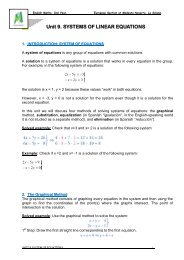
Unit 11. GRAPHS AND STATISTICS.<br />
1.CARTESIAN COORDINATES.<br />
Let’s watch the following videos to revise something about plotting points in the<br />
Cartesian axes.<br />
Video 1: http://www.youtube.com/watch?v=7h74ad7IWiI&feature=related<br />
Video 2: http://www.brightstorm.com/math/algebra/graphs-and-functions/plottingpoints-and-naming-quadrants<br />
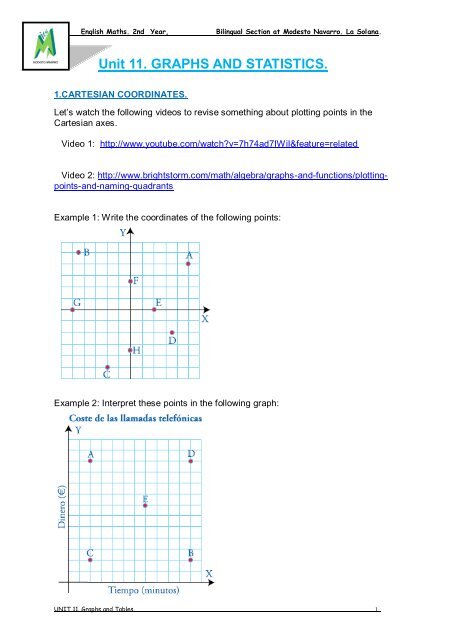
Example 1: Write the coordinates of the following points:<br />
Example 2: Interpret these points in the following graph:<br />
UNIT 11. Graphs and Tables. 1
English Maths. 2nd Year, Bilingual Section at Modesto Navarro. La Solana.<br />
2. INTERPRETATION GRAPHS.<br />
Example 1: Write everything you can about the graph:<br />
Example 2: Write everything you can about the graph:<br />
Example 3: Write everything you can about the graph:<br />
UNIT 11. Graphs and Tables. 2
English Maths. 2nd Year, Bilingual Section at Modesto Navarro. La Solana.<br />
Example 4: Page 267, exercise 4.<br />
a) ………………………<br />
b) ………………………<br />
c) ………………………<br />
Example 5. Page 267, exercise 5.<br />
Example 6: Page 267, exercise 6.<br />
a) ………………………<br />
b) ………………………<br />
c) ………………………<br />
d) ………………………<br />
e) ………………………..<br />
UNIT 11. Graphs and Tables. 3
English Maths. 2nd Year, Bilingual Section at Modesto Navarro. La Solana.<br />
2. SOMETHING ABOUT STATISTICS.<br />
2.1. What are data?<br />
Data are a collection of facts, such as values or measurements.<br />
They can be numbers, words, measurements, observations or even just descriptions<br />
of things.<br />
2.2. Qualitative vs Quantitative<br />
Data can be qualitative or quantitative.<br />
Qualitative data is descriptive information (it describes something)<br />
Quantitative data, is numerical information (numbers).<br />
And Quantitative data can also be Discrete or Continuous:<br />
Discrete data can only take certain values (like whole numbers)<br />
Continuous data can take any value (within a range)<br />
Put simply: Discrete data are counted, Continuous data are measured.<br />
Example: What do we know about Arrow the Dog?<br />
Qualitative:<br />
He is brown and black<br />
He has long hair<br />
He has lots of energy<br />
Quantitative:<br />
Discrete:<br />
o He has 4 legs<br />
o He has 2 brothers<br />
Continuous:<br />
o He weighs 25.5 kg<br />
o He is 565 mm tall<br />
To help you remember think "Quantitative is about Quantity"<br />
2.3. Collecting<br />
Data can be collected in many ways. The simplest way is direct observation.<br />
UNIT 11. Graphs and Tables. 4
English Maths. 2nd Year, Bilingual Section at Modesto Navarro. La Solana.<br />
Example: you want to find how many cars pass by a certain point on a road in a 10minute<br />
interval.<br />
So: simply stand at that point on the road, and count the cars that pass by in that<br />
interval.<br />
You can also collect data by doing a survey.<br />
2.4. Census or Sample<br />
A Census is when you collect data for every member of the group (the whole<br />
"population").<br />
A Sample is when you collect data just from selected members of the group.<br />
Example: there are 120 people in your local football club.<br />
You can ask everyone (all 120) what their age is. That is a census.<br />
Or you could just choose the people that are there this afternoon. That is a sample.<br />
A census is accurate, but hard to do. A sample is not as accurate, but may be good<br />
enough, and it is a lot easier.<br />
QUESTION 1. Which one of the following are quantitative data?<br />
A . She is black and white.<br />
B. She has two ears.<br />
C. She has short hair.<br />
D. She has a long tail.<br />
QUESTION 2. Which one of the following are continuous data?<br />
A. She has two eyes.<br />
B. She has five kittens.<br />
C. She weighs 5.4 kg.<br />
D. She has four paws.<br />
QUESTION 3. Which one of the following are discrete data?<br />
A. He is 45.2 cm long.<br />
B. She is 22.3 cm high.<br />
C. She weighs 5.4 kg.<br />
D. She has 30 teeth.<br />
QUESTION 4. A census collects information about:<br />
(Don't worry if you get it wrong ... you can learn from your mistakes.)<br />
A. All members of the population.<br />
B. All adult members of the population.<br />
UNIT 11. Graphs and Tables. 5
English Maths. 2nd Year, Bilingual Section at Modesto Navarro. La Solana.<br />
C. A large sample of the population.<br />
D. A small sample of the population.<br />
2.5. FREQUENCY DISTRIBUTION TABLE.<br />
When you collect data in a statistic study a table of frequency is used to sum up and<br />
organise the information. Look at the following example:<br />
Example: Asking the pupils in 1º B how many brothers and sisters they have got, we<br />
get the following answers:<br />
Let’s fill the gaps in the table:<br />
Nº Brothers Absolute Frequency Relative Frequency<br />
2.6. Finding a Central Value<br />
When you have two or more numbers it is useful to find a value for the "centre".<br />
Example: what is the central value for 3 and 7?<br />
Answer: Half-way in-between, which is 5.<br />
You can calculate it by adding 3 and 7 and then dividing the result by 2:<br />
(3+7) / 2 = 10/2 = 5<br />
UNIT 11. Graphs and Tables. 6
English Maths. 2nd Year, Bilingual Section at Modesto Navarro. La Solana.<br />
What about 3 or more numbers?<br />
You can use the same idea when you have 3 or more numbers:<br />
Example: what is the central value of 3, 7 and 8?<br />
Answer: You calculate it by adding 3, 7 and 8 and then dividing the results by 3<br />
(because there are 3 numbers):<br />
(3+7+8) / 3 = 18/3 = 6<br />
Notice that we divided by 3 because we had 3 numbers ... very important!<br />
2.7. The Mean or Average.<br />
So far we have been calculating the Mean (or the Average):<br />
Mean: Add up the numbers and divide by how many numbers there are.<br />
But sometimes the Mean can be misleading (it can lead you to come to a wrong<br />
conclusion):<br />
Example: Birthday Activities<br />
Uncle Bob wants to know the average age at the party, to choose an activity.<br />
There will be 6 kids aged 13, and also 5 babies aged 1.<br />
Add up all the ages, and divide by 11 (because there are 11 numbers):<br />
(13+13+13+13+13+13+1+1+1+1+1) / 11 = 7.5...<br />
The mean age is about 7½, so he gets a Jumping Castle!<br />
The 13 year olds are embarrassed,<br />
and the 1-year olds can't jump!<br />
The Mean was accurate, but in this case it was not useful.<br />
UNIT 11. Graphs and Tables. 7
English Maths. 2nd Year, Bilingual Section at Modesto Navarro. La Solana.<br />
2.8. The Median<br />
But you could also use the Median: simply list all numbers in order and choose the<br />
middle one:<br />
Example: Birthday Activities (continued)<br />
List the ages in order:<br />
1, 1, 1, 1, 1, 13, 13, 13, 13, 13, 13<br />
Choose the middle number:<br />
1, 1, 1, 1, 1, 13, 13, 13, 13, 13, 13<br />
The Median age is 13 ... so let's have a Disco!<br />
Sometimes there are two middle numbers. Just average them:<br />
Example: What is the Median of 3, 4, 7, 9, 12, 15<br />
There are two numbers in the middle:<br />
3, 4, 7, 9, 12, 15<br />
So we average them:<br />
(7+9) / 2 = 16/2 = 8<br />
The Median is 8<br />
2.9. The Mode<br />
The Mode is the value that occurs most often:<br />
Example: Birthday Activities (continued)<br />
Group the numbers so we can count them:<br />
1, 1, 1, 1, 1, 13, 13, 13, 13, 13, 13<br />
"13" occurs 6 times, "1" occurs only 5 times, so the mode is 13.<br />
However, the Mode can be tricky, there can sometimes be more than one Mode.<br />
Example: What is the Mode of 3, 4, 4, 5, 6, 6, 7<br />
Well ... 4 occurs twice but 6 also occurs twice.<br />
So both 4 and 6 are modes.<br />
UNIT 11. Graphs and Tables. 8
English Maths. 2nd Year, Bilingual Section at Modesto Navarro. La Solana.<br />
When there are two modes in a series of numbers it is called "bimodal", when there<br />
are three or more modes we call it "multimodal".<br />
Conclusion<br />
There are other ways of measuring central values, but Mean, Median and Mode are<br />
the most common.<br />
Use the one that best suits your data. Or better still, use all three!<br />
QUESTION 5. In his end-of-year exams, Joe scored the following:<br />
Science 3.4<br />
English 9.<br />
History 8.7<br />
Math 3.4<br />
Geography 5.5<br />
What was the mean?<br />
What was the median?<br />
What was the mode?<br />
QUESTION 6. The table below shows the average temperatures for London, England, for each<br />
month of the year.<br />
a)What is the mean of these values?<br />
b) What is the median of these values?<br />
UNIT 11. Graphs and Tables. 9
English Maths. 2nd Year, Bilingual Section at Modesto Navarro. La Solana.<br />
c) What is the mode of these values?<br />
EXERCISE 7. Exercise 9. Page 269.<br />
EXERCISE 10.<br />
UNIT 11. Graphs and Tables. 10
English Maths. 2nd Year, Bilingual Section at Modesto Navarro. La Solana.<br />
Sam’s team has scored the following numbers of goals in their recent matches:<br />
2, 3, 1, 2, 1, 3, 2, 3, 4, 5, 4, 2, 2, 3<br />
a) Calculate the frequency distribution table.<br />
b) Calculate the average or mean.<br />
c) Calculate the median.<br />
d) Calculate the mode.<br />
2.9. GRAPHS<br />
UNIT 11. Graphs and Tables. 11
English Maths. 2nd Year, Bilingual Section at Modesto Navarro. La Solana.<br />
EXAMPLE: BARS DIAGRAM.<br />
1. In a survey about soft drinks which young people drink, the results have been:<br />
KIND OF SOFT DRINK NUMBER OF YOUNG PEOPLE<br />
ORANGE 20<br />
LEMON 25<br />
COLA 35<br />
TROPICAL FRUITS 15<br />
Represent the information using a bars diagram .<br />
2. In the following bars diagram we have a family’s consumption of milk in a threemonth<br />
period. Make the frequency distribution table using the appropriate<br />
information.<br />
Liters (l)<br />
Comsumption of milk<br />
January February March<br />
Time (Months)<br />
EXAMPLE: PICTOGRAM<br />
UNIT 11. Graphs and Tables. 12
English Maths. 2nd Year, Bilingual Section at Modesto Navarro. La Solana.<br />
Make a pictogram which represents the number of cars sold by a dealer.<br />
TIME(YEAR) 2001 2002 2003 2004 2005 2006<br />
Nº CARS 40 45 50 45 60 50<br />
EXAMPLE: SECTORS DIAGRAM<br />
Make a sectors diagram using the following information:<br />
DAY Nº OF DAYS<br />
Cloudy 4<br />
Sunny spells 8<br />
Rainy 5<br />
Sunny 13<br />
UNIT 11. Graphs and Tables. 13
English Maths. 2nd Year, Bilingual Section at Modesto Navarro. La Solana.<br />
1.The following graph represents the speed (km/h) of a roller-coaster wagon during the time<br />
it takes to go all the way around:<br />
a) Is it a graph of points or a line graph?<br />
MORE EXERCISES<br />
ABOUT STATISTICS.<br />
b) Interpret the interval from 0 seconds to 5 seconds.<br />
c) Interpret the interval from 5 seconds to 15 seconds.<br />
d) Interpret the interval from 15 seconds to 20 seconds.<br />
e) Interpret the interval from 35 seconds to 50 seconds.<br />
f) Interpret the interval from 55 seconds to 60 seconds.<br />
g) When does the wagon reach the maximum speed?<br />
UNIT 11. Graphs and Tables. 14
English Maths. 2nd Year, Bilingual Section at Modesto Navarro. La Solana.<br />
2. In the laboratory we heat a piece of ice and we get the following graph, where<br />
the temperature and the time are linked:<br />
a) How many degrees centigrade does the temperature increase in the first minute?<br />
b) How many degrees does it increase in the second minute? Can you explain the<br />
reason?<br />
3. This is the graph that represents the temperature of water when we make coffee:<br />
a) Is it a graph of points or a line graph?<br />
b) Interpret the interval from 0 to 4 minutes.<br />
c) Interpret the interval from 4 to 6 minutes.<br />
UNIT 11. Graphs and Tables. 15
English Maths. 2nd Year, Bilingual Section at Modesto Navarro. La Solana.<br />
d) Interpret the interval from 6 minutes.<br />
e) If we drink coffee 13 minutes after making it, what temperature is it?<br />
4. Would you know how to draw the Cartesian axes?<br />
5. This is the graph of the price in a parking lot:<br />
a) Is it a graph of points or a line graph?<br />
b) Interpret the interval from 0 to 1 hour.<br />
c) If we have a car parked for 2 hours, how much is it?<br />
d) If we have a car parked for 2 hours and 59 minutes, how much is it?<br />
UNIT 11. Graphs and Tables. 16