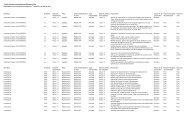
Standard Life Canadian Equity Class
Standard Life Canadian Equity Class
Standard Life Canadian Equity Class

You also want an ePaper? Increase the reach of your titles
YUMPU automatically turns print PDFs into web optimized ePapers that Google loves.
hile neither market has taken a<br />
strong direction upwards nor<br />
downwards, 2011 has shown there are<br />
lingering concerns throughout the<br />
globe that may cause more volatility,<br />
and perhaps, more concerns for<br />
investors. Investors have not yet<br />
forgotten about the difficult year that<br />
was 2009.<br />
16 The Quarterly Review<br />
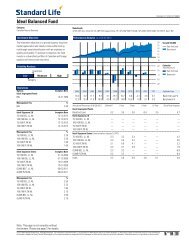
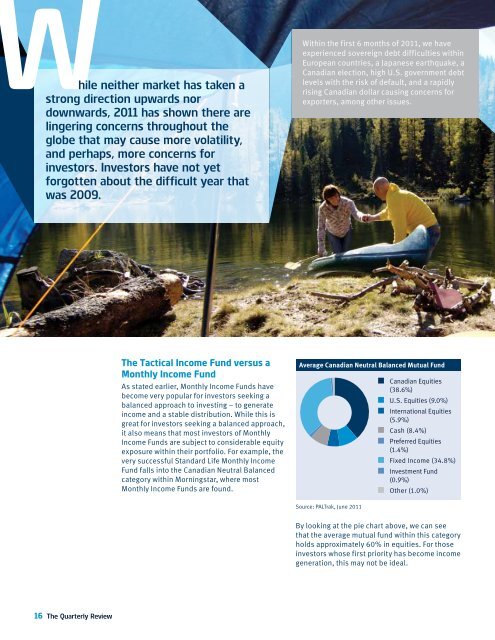
The Tactical Income Fund versus a<br />
Monthly Income Fund<br />
As stated earlier, Monthly Income Funds have<br />
become very popular for investors seeking a<br />
balanced approach to investing – to generate<br />
income and a stable distribution. While this is<br />
great for investors seeking a balanced approach,<br />
it also means that most investors of Monthly<br />
Income Funds are subject to considerable equity<br />
exposure within their portfolio. For example, the<br />
very successful <strong>Standard</strong> <strong>Life</strong> Monthly Income<br />
Fund falls into the <strong>Canadian</strong> Neutral Balanced<br />
category within Morningstar, where most<br />
Monthly Income Funds are found.<br />
Within the first 6 months of 2011, we have<br />
experienced sovereign debt difficulties within<br />
European countries, a Japanese earthquake, a<br />
<strong>Canadian</strong> election, high U.S. government debt<br />
levels with the risk of default, and a rapidly<br />
rising <strong>Canadian</strong> dollar causing concerns for<br />
exporters, among other issues.<br />
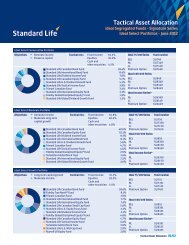
Average <strong>Canadian</strong> Neutral Balanced Mutual Fund<br />
Source: PALTrak, June 2011<br />
<strong>Canadian</strong> Equities<br />
(38.6%)<br />
U.S. Equities (9.0%)<br />
International Equities<br />
(5.9%)<br />
Cash (8.4%)<br />
Preferred Equities<br />
(1.4%)<br />
Fixed Income (34.8%)<br />
Investment Fund<br />
(0.9%)<br />
Other (1.0%)<br />
By looking at the pie chart above, we can see<br />
that the average mutual fund within this category<br />
holds approximately 60% in equities. For those<br />
investors whose first priority has become income<br />
generation, this may not be ideal.