Standard Life Canadian Equity Class
Standard Life Canadian Equity Class
Standard Life Canadian Equity Class

You also want an ePaper? Increase the reach of your titles
YUMPU automatically turns print PDFs into web optimized ePapers that Google loves.
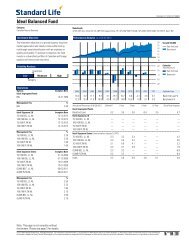
<strong>Standard</strong> <strong>Life</strong> Global Dividend Growth Fund<br />
Category<br />
Global <strong>Equity</strong><br />
Investment Objective<br />
The fund seeks to provide both capital growth and<br />
income. The fund invests primarily in a globally<br />
diversified portfolio of equity ,equity-type securities and<br />
other income producing investments.<br />
Volatility Analysis<br />
Investment<br />
Low Moderate<br />
Category<br />
High<br />
Operations<br />
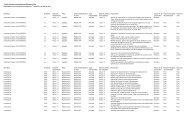
Series Load Structure Fund Code<br />
A Defer Sales Charge SLM074<br />
A Front End Charge SLM274<br />
A Low Load Charge SLM174<br />
E No Sales or Redem SLM874<br />
F No Sales or Redem SLM974<br />
L No Sales or Redem SLM474<br />
T Defer Sales Charge SLM074T<br />
T Front End Charge SLM274T<br />
T Low Load Charge SLM174T<br />
A Inception 07-02-2004<br />
E Inception 07-02-2004<br />
F Inception 07-06-2006<br />
L Inception 07-02-2004<br />
T Inception 07-08-2008<br />
A Management Fee 2.00%<br />
E Management Fee 1.50%<br />
F Management Fee 1.00%<br />
L Management Fee 1.15%<br />
T Management Fee 2.00%<br />
Disclaimer<br />
** Not annualized<br />
For advisor use only. This document is not<br />
intended for public distribution.<br />
Note: This page is not complete without<br />
disclaimers. Please refer to the end of this<br />
document for details.<br />
<strong>Standard</strong> <strong>Life</strong> Mutual Funds Ltd.<br />
Benchmark<br />
MSCI World Index (CA$)<br />
Performance Analysis as of 06-30-2011<br />
Published: 07-20-2011 | PC 5695<br />
18 Growth $10,000<br />
16<br />
Series A<br />
14<br />
Benchmark<br />
12<br />
10<br />
8<br />
6<br />
©2011 Morningstar Research Inc. All Rights Reserved. The information contained herein: (1) is proprietary to Morningstar and/or its content providers; (2) may not be copied or distributed; and (3) is not warranted to<br />
be accurate, complete or timely. Neither Morningstar nor its content providers are responsible for any damages or losses arising from any use of this information. Past performance is no guarantee of future results. ?<br />
30<br />
15<br />
0<br />
-15<br />
-30<br />
Calendar<br />
Year Returns %<br />
Series A<br />
Benchmark<br />
2001 2002 2003 2004 2005 2006 2007 2008 2009 2010 YTD Calendar Year<br />
— — — — 5.2 16.3 -2.5 -24.0 5.4 1.1 1.9 Series A %<br />
-11.3 -20.4 9.4 6.9 7.3 20.2 -7.1 -25.4 11.1 6.5 2.6 Benchmark %<br />
Annualized Returns as of 06-30-2011 3 Month** 1 Year 3 Year 5 Year 10 Year Since Fund Inception<br />
Series A 0.7 16.8 -2.9 -1.6 — 0.0<br />
Series E 0.8 17.3 -2.4 -1.1 — 0.6<br />
Series F 1.0 18.0 -1.9 — — -0.6<br />
Series L 1.0 18.2 -1.7 -0.4 — 1.2<br />
Series T 0.7 16.8 — — — -2.4<br />
Index -0.1 19.1 -0.6 0.0 -0.1 1.7<br />
Portfolio Analysis<br />
Composition % Assets<br />
Cash<br />
Fixed Income<br />
<strong>Canadian</strong> <strong>Equity</strong><br />
US <strong>Equity</strong><br />
International <strong>Equity</strong><br />
Other<br />
0.0<br />
0.0<br />
2.2<br />
33.0<br />
64.8<br />
0.0<br />
Top Ten Holdings % Assets<br />
Apple, Inc.<br />
BHP Billiton PLC<br />
Pfizer Inc<br />
Cenovus Energy, Inc.<br />
Japan Tobacco Inc.<br />
PepsiCo, Inc.<br />
Occidental Petroleum Corporation<br />
Booker Group PLC<br />
Nippon Telegraph and Telephon<br />
AT&T, Inc.<br />
Total Number of Portfolio Holdings<br />
Total Number of Underlying Holdings<br />
Total Number of Stock Holdings<br />
Total Number of Bond Holdings<br />
2.8<br />
2.4<br />
2.2<br />
2.2<br />
2.1<br />
2.0<br />
2.0<br />
2.0<br />
1.8<br />
1.8<br />
74<br />
74<br />
73<br />
0<br />
Global <strong>Equity</strong> Sectors % Net Assets<br />
Utilities 4.8<br />
Energy 8.0<br />
Financials 19.4<br />
Materials 6.0<br />
Consumer Discretionary 15.0<br />
Consumer Staples 11.8<br />
Telecommunication Services 3.5<br />
Industrials 13.0<br />
Health Care 4.9<br />
Information Technology 10.7<br />
Unclassified 3.0<br />
Top 10 Countries % Assets<br />
United States 33.0<br />
United Kingdom 20.6<br />
Japan 8.5<br />
France 7.6<br />
Germany 6.3<br />
Switzerland 5.3<br />
Portugal 2.7<br />
Australia 2.5<br />
Netherlands 2.5<br />
Others 11.0<br />
The Quarterly Review 29