

Electrochemical reduction of NOx - DTU Orbit
Electrochemical reduction of NOx - DTU Orbit
Electrochemical reduction of NOx - DTU Orbit

Create successful ePaper yourself
Turn your PDF publications into a flip-book with our unique Google optimized e-Paper software.
Department <strong>of</strong> Energy Conversion and Storage<br />
Technical University <strong>of</strong> Denmark<br />
<strong>Electrochemical</strong> <strong>reduction</strong> <strong>of</strong> <strong>NOx</strong><br />
PhD Thesis<br />
Marie Lund Traulsen<br />
April 2012
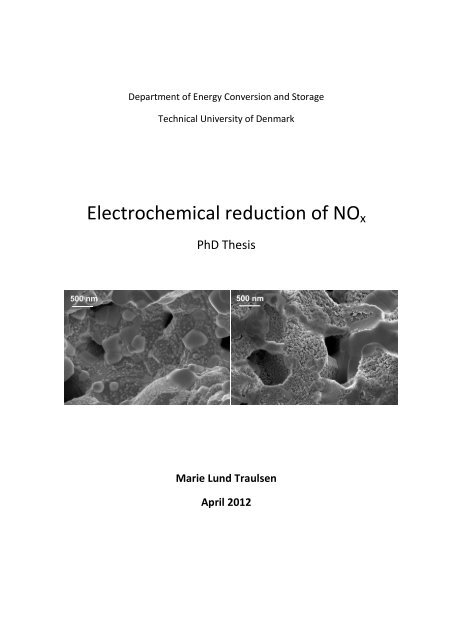
Cover: La0.85Sr0.15MnO3-δ-Ce0.9Gd0.1O1.95 electrode <strong>of</strong> a porous 11-layer cell stack impregnated with<br />
BaO. On this kind <strong>of</strong> electrode 60% <strong>NOx</strong> conversion was achieved in a gas composition <strong>of</strong> 1000 ppm<br />
NO + 10% O2 at 400 °C. The image to the left shows the electrode microstructure before test and<br />
the image to the right the microstructure after test.
Preface<br />
Preface<br />
This thesis is submitted to the Technical University <strong>of</strong> Denmark to finalise the PhD study<br />
<strong>Electrochemical</strong> Reduction <strong>of</strong> <strong>NOx</strong> which was carried out from 1 st May 2009 to 30 th April 2012. The<br />
PhD study was financed by the Danish Strategic Research Council under contract no. 09-065186.<br />
The project was hosted by the Fuel Cell and Solid State Chemistry Division at Risø <strong>DTU</strong>, which due<br />
to organisational changes became part <strong>of</strong> the newly established Department <strong>of</strong> Energy Conversion<br />
and Storage at Technical University <strong>of</strong> Denmark from the 1 st January 2012. These organisational<br />
changes had no influence on the accomplishment <strong>of</strong> the PhD project.<br />
The PhD project was supervised by senior scientist Kent Kammer Hansen and the daily work was<br />
carried out in the Gas Purification Work Group.<br />
After three years <strong>of</strong> PhD studies I owe thanks to many colleagues, who have been a great help<br />
during the project. This help has been greatly appreciated and invaluable for the completion <strong>of</strong> the<br />
project.<br />
Especially I would like to thank:<br />
− my supervisor Kent Kammer Hansen for patient encouragement during the project and for<br />
giving me time and space to grow as a researcher.<br />
− the entire Gas Purification Work Group for being excellent colleagues both during work<br />
and during relaxed lunch conversations.<br />
− the technical staff, who many times have helped me solving both predicted and<br />
unpredicted practical issues.<br />
Marie Lund Traulsen, Roskilde, Denmark, April 2012<br />
i
Abstract<br />
Abstract<br />
NO and NO2 (collectively referred to as <strong>NOx</strong>) are air pollutants, and the largest single contributor to<br />
<strong>NOx</strong> pollution is automotive exhaust. This study investigates electrochemical de<strong>NOx</strong>, a technology<br />
which aims to remove <strong>NOx</strong> from automotive diesel exhaust by electrochemical <strong>reduction</strong> <strong>of</strong> <strong>NOx</strong> to<br />
N2 and O2. The focus in this study is on improving the activity and selectivity <strong>of</strong> solid oxide<br />
electrodes for electrochemical de<strong>NOx</strong> by addition <strong>of</strong> <strong>NOx</strong> storage compounds to the electrodes.<br />
Two different composite electrodes, La0.85Sr0.15MnO3-δ-Ce0.9Gd0.1O1.95 (LSM15-CGO10) and<br />
La0.85Sr0.15FeO3-δ-Ce0.9Gd0.1O1.95 (LSF15-CGO10), have been investigated in combination with three<br />
different <strong>NOx</strong> storage compounds: BaO, K2O and MnOx. The main focus in the investigation has<br />
been on conversion measurements and electrochemical characterization, the latter by means <strong>of</strong><br />
electrochemical impedance spectroscopy and cyclic voltammetry. In addition, infrared<br />
spectroscopy has been performed to study how <strong>NOx</strong> adsorption on the electrodes is affected by<br />
the presence <strong>of</strong> the aforementioned <strong>NOx</strong> storage compounds. Furthermore, non-tested and tested<br />
electrode microstructures have been thoroughly evaluated by scanning electron microscopy.<br />
The studies reveal addition <strong>of</strong> MnOx or K2O to the electrodes cause severe degradation problems,<br />
and addition <strong>of</strong> these compounds is thus unsuitable for electrode improvement. In contrast,<br />
addition <strong>of</strong> BaO to LSM15-CGO10 electrodes is shown to have a very positive impact on the <strong>NOx</strong><br />
conversion. The increased <strong>NOx</strong> conversion, following the BaO addition, is attributed to a<br />
combination <strong>of</strong> 1) a decreased electrode polarisation resistance and 2) an altered <strong>NOx</strong> adsorption.<br />
The <strong>NOx</strong> conversion is observed to increase strongly with polarisation, and during 9 V polarisation<br />
<strong>of</strong> an 11-layer porous cell stack, 60% <strong>NOx</strong> conversion in a mixture <strong>of</strong> 1000 ppm NO and 10% O2 is<br />
achieved at 400 °C on entirely ceramic electrodes.<br />
This project thus demonstrates electrochemical de<strong>NOx</strong> is possible without the presence <strong>of</strong> noble<br />
metals at realistic operating conditions. However, several questions remain, among these how the<br />
the BaO interacts with the solid oxide electrodes and how the electrochemical cell is optimally<br />
operated during electrochemical de<strong>NOx</strong>.<br />
ii
Dansk resumé<br />
Dansk resumé<br />
<strong>NOx</strong> er en fællesbetegnelse for gasserne NO og NO2. <strong>NOx</strong> udledning bidrager til luftforureningen,<br />
og det største enkeltbidrag til <strong>NOx</strong> forureningen stammer fra biludstødning. I dette projekt<br />
studeres teknologien elektrokemisk de<strong>NOx</strong>, som er rettet mod rensning af dieseludstødning ved<br />
hjælp af elektrokemisk reduktion af <strong>NOx</strong> til N2 og O2. Fokus i projektet er på forbedring af fastoxid<br />
elektroders aktivitet og selektivitet i forhold til elektrokemisk de<strong>NOx</strong>, forbedringen forsøges<br />
opnået ved tilføjelse af <strong>NOx</strong> lagrings forbindelser til elektroderne.<br />
To forskellige typer komposit elektroder, La0.85Sr0.15MnO3-δ-Ce0.9Gd0.1O1.95 (LSM15-CGO10) og<br />
La0.85Sr0.15FeO3-δ-Ce0.9Gd0.1O1.95 (LSF15-CGO10), er blevet undersøgt i kombination med tre<br />
forskellige <strong>NOx</strong> lagrings forbindelser: BaO, K2O og MnOx. Hovedfokus i undersøgelsen har været på<br />
omsætningsmålinger og elektrokemisk karakterisering, sidstnævnte ved hjælp elektrokemisk<br />
impedans spektroskopi og cyklisk voltammetri. Derudover er der udført infrarød spektroskopi for<br />
at undersøge, hvordan <strong>NOx</strong> adsorptionen på elektroderne påvirkes af tilstedeværelsen af de<br />
førnævnte <strong>NOx</strong> lagrings forbindelser. Endelig er mikrostrukturen af testede og ikke-testede<br />
elektroder blevet grundigt undersøgt med scanning elektron mikroskopi.<br />
Undersøgelsen viser, at tilføjelse af MnOx og K2O er uegnet til forbedring af elektroderne, da<br />
tilstedeværelse af MnOx og K2O medfører en fatal degradering. Derimod har tilføjelse af BaO til<br />
elektroderne en klart positiv effekt på <strong>NOx</strong> omsætningen. Den øgede <strong>NOx</strong> omsætning som følge af<br />
BaO tilsætning kan tilskrives en kombination af 1) en sænkning af elektrodens polariserings-<br />
modstand og 2) en ændring i <strong>NOx</strong> adsorptionen. <strong>NOx</strong> omsætningen stiger kraftigt med stigende<br />
polarisering og ved 9 V polarisering ved 400 °C af en 11-lags, porøs cellestak opnås 60 % <strong>NOx</strong><br />
omsætning i en blanding bestående af 1000 ppm NO og 10 % O2, denne omsætning opnås på<br />
udelukkende keramiske elektroder.<br />
Dette projekt demonstrerer dermed, at elektrokemisk de<strong>NOx</strong> er mulig under realistiske forhold<br />
uden brug af ædelmetaller. Flere spørgsmål savner dog stadig et svar, heriblandt hvordan BaO<br />
interagerer med fastoxid elektroderne samt hvordan en elektrokemisk celle skal drives optimalt<br />
under elektrokemisk de<strong>NOx</strong>.<br />
iii
Table <strong>of</strong> Contents<br />
Table <strong>of</strong> Contents<br />
1 Introduction ........................................................................................................................... 1<br />
1.1 <strong>NOx</strong> pollution .................................................................................................................. 2<br />
1.2 <strong>NOx</strong> removal from automotive exhaust ........................................................................... 3<br />
1.3 Objective and lay-out <strong>of</strong> the thesis ................................................................................. 8<br />
2 Materials .............................................................................................................................. 11<br />
2.1 Material Choice ............................................................................................................ 11<br />
2.2 Impregnation ................................................................................................................ 13<br />
2.3 Materials compatibility ................................................................................................. 14<br />
2.4 Material properties ...................................................................................................... 15<br />
3 Experimental ........................................................................................................................ 16<br />
3.1 Test set-ups for electrochemical characterisation ......................................................... 16<br />
3.2 Fabrication <strong>of</strong> electrodes .............................................................................................. 19<br />
3.3 Impregnation ................................................................................................................ 20<br />
3.4 <strong>Electrochemical</strong> characterisation .................................................................................. 21<br />
3.5 Gas Analysis .................................................................................................................. 21<br />
3.6 FTIR spectroscopy ......................................................................................................... 23<br />
3.7 Microscopy ................................................................................................................... 23<br />
4 Diffuse Reflectance Infrared Fourier Transform Study <strong>of</strong> <strong>NOx</strong> Adsorption on CGO10<br />
Impregnated with K2O or BaO ...................................................................................................... 24<br />
4.1 Abstract ........................................................................................................................ 24<br />
4.2 Introduction ................................................................................................................. 24<br />
4.3 Experimental Methods ................................................................................................. 27<br />
4.4 Results and discussion .................................................................................................. 29<br />
4.5 Conclusions .................................................................................................................. 47<br />
4.6 Acknowledgement ........................................................................................................ 47<br />
5 Improvement <strong>of</strong> LSM15-CGO10 electrodes for electrochemical removal <strong>of</strong> <strong>NOx</strong> by KNO3 and<br />
MnOx impregnation ..................................................................................................................... 48<br />
5.1 Abstract ........................................................................................................................ 48<br />
5.2 Introduction ................................................................................................................. 48<br />
iv
Table <strong>of</strong> Contents<br />
5.3 Experimental ................................................................................................................ 50<br />
5.4 Results .......................................................................................................................... 52<br />
5.5 Discussion .................................................................................................................... 69<br />
5.6 Conclusion .................................................................................................................... 81<br />
5.7 Acknowledgements ...................................................................................................... 81<br />
6 <strong>NOx</strong>-conversion on Porous LSF15-CGO10 Cell Stacks with KNO3 or K2O Impregnation ........... 82<br />
6.1 Abstract ........................................................................................................................ 82<br />
6.2 Introduction ................................................................................................................. 82<br />
6.3 Experimental ................................................................................................................ 85<br />
6.4 Results and Discussion .................................................................................................. 88<br />
6.5 Conclusion ...................................................................................................................101<br />
6.6 Acknowledgements .....................................................................................................101<br />
7 <strong>NOx</strong>-conversion on LSF15-CGO10 cell stacks with BaO impregnation ...................................102<br />
7.1 Experimental ...............................................................................................................102<br />
7.2 Results .........................................................................................................................103<br />
7.3 Discussion ...................................................................................................................112<br />
7.4 Conclusion ...................................................................................................................114<br />
8 <strong>NOx</strong>-conversion on LSM15-CGO10 cell stacks with BaO impregnation ..................................115<br />
8.1 Abstract .......................................................................................................................115<br />
8.2 Introduction ................................................................................................................115<br />
8.3 Experimental ...............................................................................................................117<br />
8.4 Results .........................................................................................................................119<br />
8.5 Discussion ...................................................................................................................131<br />
8.6 Conclusion ...................................................................................................................135<br />
8.7 Acknowledgement .......................................................................................................135<br />
9 <strong>NOx</strong>-conversion on LSM15-CGO10 cell stacks with K2O impregnation ..................................136<br />
9.1 Experimental ...............................................................................................................136<br />
9.2 Results .........................................................................................................................137<br />
9.3 Discussion ...................................................................................................................146<br />
9.4 Conclusion ...................................................................................................................149<br />
v
Table <strong>of</strong> Contents<br />
10 Measurements on LSM15-CGO10 electrodes in a 3-electrode set-up...................................150<br />
10.1 Introduction ................................................................................................................150<br />
10.2 Experimental ...............................................................................................................150<br />
10.3 Results .........................................................................................................................151<br />
10.4 Discussion ...................................................................................................................166<br />
10.5 Conclusion ...................................................................................................................170<br />
11 Construction <strong>of</strong> an in situ XANES test house ........................................................................171<br />
11.1 Introduction ................................................................................................................171<br />
11.2 Theory .........................................................................................................................172<br />
11.3 Experimental ...............................................................................................................175<br />
11.4 Results .........................................................................................................................179<br />
11.5 Discussion ...................................................................................................................182<br />
11.6 Conclusion ...................................................................................................................184<br />
12 Overall Discussion, Conclusion and Outlook ........................................................................185<br />
12.1 Discussion ...................................................................................................................185<br />
12.2 Conclusion ...................................................................................................................190<br />
12.3 Outlook .......................................................................................................................191<br />
References ..................................................................................................................................193<br />
Appendix A .................................................................................................................................209<br />
vi
1 Introduction<br />
1 Introduction<br />
<strong>NOx</strong> is the collective name for the compounds NO (nitric oxide) and NO2 (nitrogen dioxide), which<br />
both are atmospheric pollutants 1 . The largest single contributor to <strong>NOx</strong> emission in Europe is road<br />
transport, which in 2008 was responsible for 39.6% <strong>of</strong> the total European <strong>NOx</strong> emissions 2 . In order<br />
to decrease the <strong>NOx</strong> emissions from road transport increasingly stricter emission limits has been<br />
imposed on the <strong>NOx</strong> emission during the last 20 years 3 which has established a need for<br />
technologies, which can remove <strong>NOx</strong> from automotive exhaust, just as excess hydrocarbons and<br />
CO needs to be removed. This project is related to the development <strong>of</strong> a new technology for <strong>NOx</strong><br />
removal from automotive diesel exhaust, the name <strong>of</strong> the technology is electrochemical de<strong>NOx</strong>.<br />
The project deals with studies and improvement <strong>of</strong> the catalyst/electrodes used during<br />
electrochemical de<strong>NOx</strong>, as the activity and selectivity <strong>of</strong> the electrodes must be improved before<br />
the technology can be developed into a commercial state 4 . In a future perspective the goal is to<br />
expand the electrochemical de<strong>NOx</strong> technology to also include electrochemical oxidation <strong>of</strong><br />
hydrocarbon and soot, and thus develop a technology, which in one single component can clean<br />
automotive diesel exhaust from both <strong>NOx</strong>, hydrocarbons and soot. This is however the future goal,<br />
and as stated the focus in this project is only on electrochemical de<strong>NOx</strong>.<br />
In this introduction chapter the formation <strong>of</strong> the <strong>NOx</strong> in diesel engines will be briefly explained and<br />
an overview will be given <strong>of</strong> alternative technologies for <strong>NOx</strong> removal from diesel exhaust.<br />
Thereafter a literature survey <strong>of</strong> the development within electrochemical de<strong>NOx</strong> will be given.<br />
1
1.1 <strong>NOx</strong> pollution<br />
1 Introduction<br />
NO is formed in high-compression internal combustion engines in three ways 5 : 1) by oxidation <strong>of</strong><br />
nitrogen-containing hydrocarbons in the fuel; 2) by reaction between fuel hydrocarbons and N2<br />
and subsequent oxidation, or 3) by reaction between N2 and O2 in the air through the Zeldovich<br />
mechanism. The majority <strong>of</strong> the NO in engine exhaust is formed by the Zeldovich mechanism, in<br />
which activated N* and O*creates a chain reaction as described by equation 1.1 and 1.2 6 :<br />
N2+O* → NO + N* (1.1)<br />
N*+O2→ NO + O*<br />
After the NO has been formed part <strong>of</strong> the NO will react with O2 and form NO2 according to the<br />
equilibrium:<br />
2 NO + O2 2 NO2.<br />
The <strong>NOx</strong> concentration in the exhaust and the ratio between NO and NO2 depend on the engine<br />
and the driving mode <strong>of</strong> the engine, but typically a total <strong>NOx</strong> concentration in the range 300-1200<br />
ppm 7, 8 is expected <strong>of</strong> which 5-10% is NO2 5, 9, 10 . With respect to the impact <strong>of</strong> <strong>NOx</strong> on health and<br />
environment, NO2 is the most harmful substance, as NO2 may contribute to the formation <strong>of</strong> acid<br />
rain and cause respiratory problems when the concentration is >0.3 ppm 11 . Furthermore both NO<br />
and NO2 participate in the formation <strong>of</strong> photochemical smog, which is damaging to plants and<br />
detrimental to human health 11 . Due to these negative impacts <strong>of</strong> <strong>NOx</strong> on health and environment,<br />
increasingly stricter emission limits have been imposed on the <strong>NOx</strong> emission from automotive<br />
exhaust. In the U.S this has been done by the introduction <strong>of</strong> the TIER 1-2 emission standards and<br />
in Europe by the introduction <strong>of</strong> the Euro 1-6 emission standards 12 . For illustration, the <strong>NOx</strong><br />
emission standards according to Euro 1-6 are stated in table Table 1. The dramatic decrease in the<br />
allowable <strong>NOx</strong> emission means <strong>NOx</strong>-removal technologies become a necessity as engine control <strong>of</strong><br />
diesel engines previously used to reduce the <strong>NOx</strong> emission no longer is enough to comply with the<br />
<strong>NOx</strong> emission standards 13 .<br />
2<br />
(1.2)<br />
(1.3)
1 Introduction<br />
3, 12<br />
Table 1. Emission standards for diesel personal cars and long distance vehicles in Europe<br />
Standard Implementation Year <strong>NOx</strong> [g/km]<br />
Euro 1 1992 0.90*<br />
Euro 2 1996 0.67*<br />
Euro 3 2000 0.50<br />
Euro 4 2005 0.25<br />
Euro 5 2008 0.18<br />
Euro 6 2013 0.08<br />
*Regulations set a standard for the sum <strong>of</strong> HC and NO x emissions. The value quoted in the table is an inferred value<br />
based on typical HC/NO x split.<br />
1.2 <strong>NOx</strong> removal from automotive exhaust<br />
The exhaust gas from gasoline cars is efficiently cleaned for <strong>NOx</strong>, hydrocarbons and CO by means<br />
<strong>of</strong> the three-way-catalyst (TWC) 14 . The TWC does not work for cleaning <strong>of</strong> diesel engine exhaust<br />
due the higher air/fuel ratio in diesel engines, which means exhaust from diesel engines contain<br />
10-15% O2 7 . For this reason other technologies have been developed or are under development<br />
for <strong>NOx</strong>-removal from diesel exhaust, the three dominant technologies being selective catalytic<br />
<strong>reduction</strong> with ammonia (NH3-SCR), selective catalytic <strong>reduction</strong> with hydro-carbons (HC-SCR) and<br />
the <strong>NOx</strong>-storage and <strong>reduction</strong> (NSR) catalyst 7, 14 .<br />
1.2.1 NH3-SCR<br />
NH3-SCR is based on the <strong>reduction</strong> <strong>of</strong> NO and NO2 with NH3 according to the reaction schemes 7 :<br />
4 NO + 4 NH3 + O2 →4 N2 + 6 H2O<br />
6 NO2 + 8 NH3 + O2 →7 N2 + 12 H2O<br />
The NH3-SCR process was originally developed for stationary sources and then later developed<br />
further for mobile sources 14 . Typically the catalyst consist <strong>of</strong> a TiO2 monolith on which the active<br />
catalyst V2O5 is deposited together with different promoters (WO3 or MoO3) 7, 14 . The ammonia is<br />
usually supplied in the form <strong>of</strong> an aqueous urea-solution (AdBlue®). However recently a<br />
technology has been developed in which the ammonia is stored in solid form (AdAmmine) and<br />
3<br />
(1.4)<br />
(1.5)
1 Introduction<br />
then evaporated to gasous NH3 before reaction in the SCR catalyst 15 . Even though <strong>NOx</strong> conversion<br />
higher than 95% can be achieved with NH3-SCR 16 , the technology has a significant drawback as it is<br />
necessary to have a separate supply system for the ammonia. Furthermore the ammonia supply<br />
must be carefully controlled to prevent ammonia slip in the exhaust. Despite <strong>of</strong> these drawbacks<br />
NH3-SCR is expected to be dominant technology for diesel exhaust cleaning in the future in<br />
combination with particle filters and oxidation catalysts units 3, 13 .<br />
1.2.2 HC-SCR<br />
As explained in the previous section one <strong>of</strong> the disadvantages by NH3-SCR is the necessity <strong>of</strong><br />
adding a separate ammonia supply system. In order to avoid a separate supply system for the<br />
addition <strong>of</strong> a <strong>NOx</strong> reductant, it has been suggested to use excess hydrocarbons from the fuel as the<br />
<strong>NOx</strong> reductant in the technology named HC-SCR.<br />
The overall reaction scheme for the <strong>reduction</strong> <strong>of</strong> <strong>NOx</strong> to N2 with hydrocarbons is illustrated with<br />
propene as an example:<br />
2 NO + 3.5 O2 + C3H6 → N2 + 3 CO2 + 3 H2O (1.6)<br />
In the investigation <strong>of</strong> suitable catalysts for HC-SCR the main focus has been on zeolite-catalysts 17 ,<br />
especially the ZSM-5 zeolite, and on noble metals, especially Ag, on alumina support 18 . Despite the<br />
extensive research in HC-SCR, the technology has not reached commercialization yet, mainly due<br />
to unsolved problems with activity and catalyst stability 17, 18 .<br />
1.2.3 NSR catalysis<br />
The NSR catalyst for <strong>NOx</strong> removal from diesel exhaust was developed by Toyota in 1990’s 19 . The<br />
catalyst consist <strong>of</strong> a precious metal and a <strong>NOx</strong> storage compound (typically BaO) on an alumina<br />
support, and for the catalyst to work the engine must be cycled between 2 operating modes: 1)<br />
normal lean operation <strong>of</strong> the engine, during which the <strong>NOx</strong> in the exhaust is stored as nitrate on<br />
the <strong>NOx</strong>-storage compound, 2) operation with excess fuel-to-air ratio during which the excess fuel<br />
is used for <strong>reduction</strong> <strong>of</strong> the nitrate into N2. The storage and <strong>reduction</strong> <strong>of</strong> <strong>NOx</strong> is described by the<br />
following two equations 20 :<br />
4
O<br />
1 Introduction<br />
2<br />
2<br />
<strong>NOx</strong> storage: NO→<br />
NO 2 →Ba(NO<br />
3 ) 2<br />
(1.7)<br />
Pt<br />
HC, H2<br />
, CO<br />
Reduction: ) ⎯⎯⎯⎯→ BaO + NO → N + CO + H O (1.8)<br />
Ba(NO3 2<br />
2<br />
2 2 2<br />
Pt<br />
5<br />
O<br />
Ba<br />
HC, H2<br />
, CO<br />
Even though the NSR catalyst has been introduced on the Japanese market 20 , the technology has<br />
some drawbacks/challenges to be solved with respect to fuel penalty, sensitivity to fuel sulfur<br />
levels and control under transient engine operation 21 .<br />
1.2.4 <strong>Electrochemical</strong> de<strong>NOx</strong><br />
<strong>Electrochemical</strong> de<strong>NOx</strong> is the <strong>NOx</strong> removal technology studied in this project. The principle in<br />
electrochemical de<strong>NOx</strong> is, the <strong>NOx</strong> is reduced to N2 in an electrochemical cell by means <strong>of</strong> the<br />
electrons supplied to the cell. Thereby addition <strong>of</strong> reductants becomes unnecessary. Typically<br />
electrochemical cells similar to solid oxide fuel cells are used, which means the electrolyte is an<br />
oxygen ion conductor and the desired reactions on the cathode and anode become:<br />
Cathode: NO + 2 e - → 0.5 N2 + O 2-<br />
Anode: O 2- → 0.5 O2 + 2 e -<br />
(1.9)<br />
(1.10)<br />
A competitive reaction on cathode in oxygen containing atmosphere is the <strong>reduction</strong> <strong>of</strong> O2<br />
(equation 1.11), which will lead to a waste <strong>of</strong> energy during electrochemical de<strong>NOx</strong>.<br />
0.5 O2 + 2 e - → O 2-<br />
(1.11)<br />
The idea electrochemical <strong>reduction</strong> could be used for <strong>NOx</strong> removal was initiated when<br />
Pancharatnam et al. in 1975 discovered NO could be reduced on polarised zirconia surfaces 22 . The<br />
active site for the <strong>NOx</strong> <strong>reduction</strong> was suggested to be F-centers i ,22 , which was later confirmed in a<br />
i An F-center is an oxygen ion vacancy with one electron trapped.
1 Introduction<br />
study by Gür et al. 23 , but since these studies were made in the absence <strong>of</strong> oxygen, they were <strong>of</strong><br />
little relevance for <strong>NOx</strong> removal in oxygen containing atmospheres, i.e. at conditions realistic for<br />
exhaust gasses. In a review <strong>of</strong> the application <strong>of</strong> ceramic membranes Cicero et al. reported in 1990<br />
the Helipump Corporation had developed an electrochemical membrane which could remove <strong>NOx</strong><br />
in the presence <strong>of</strong> up to 8% O2 24 . The electrochemical membrane/cell had an yttria stabilized<br />
zirconia electrolyte and transition metal based electrodes, and was reported to remove up to 91%<br />
<strong>NOx</strong> 24 , but unfortunately no further details were given on the experiments conducted and the<br />
electrode materials used. In 1995 Reinhardt et al. performed studies <strong>of</strong> the reaction between O2,<br />
NO and NO2 on LSM electrodes with yttria stabilized zirconia (YSZ) electrolyte and found the O2<br />
exchange reaction on the LSM was very slow below 600 °C, while addition <strong>of</strong> 1000-3000 ppm NO<br />
increased the current densities significantly in oxygen containing atmosphere due to reactions<br />
with NO2 on the electrode surface 25 . Hibino et al. reported in 1994-1995 experiments on <strong>NOx</strong><br />
conversions in oxidizing atmosphere on YSZ based cells with Pd electrodes 26, 27 , and later the<br />
studies were expanded to include Rh, Au, and Pt 28 . The results by Hibino et al. showed Pd was the<br />
best electrode material at 800 °C, and in the presence <strong>of</strong> 1500 ppm NO and 3% O2 15% NO<br />
conversion could be obtained with current efficiency ≈1% 28 . Furthermore it was shown by Hibino<br />
et al. both <strong>NOx</strong> conversion and current efficiency decreased dramatically with increasing O2<br />
content, and the use <strong>of</strong> AC voltage rather than DC voltage would decrease the degradation <strong>of</strong> the<br />
electrochemical cell 28 . Walsh et al. studied the NO <strong>reduction</strong> at a slighter lower temperature range<br />
compared to Hibino et al., namely at 500-600 °C rather than 700-800 °C, and studied Ir and Pt<br />
electrodes on YSZ electrolytes 29, 30 . On the Ir electrodes Walsh et al. demonstrated the selectivity<br />
towards <strong>NOx</strong> <strong>reduction</strong> compared to O2 <strong>reduction</strong> increased with decreasing temperature 29 , while<br />
on the Pt electrodes it was demonstrated the NO conversion increased with NO concentration,<br />
polarisation and temperature 30 . Bredikhin et al. also studied <strong>NOx</strong> conversion in an electrochemical<br />
cell with YSZ electrolyte and Pt electrodes, but in the work by Bredikhin et al. the Pt cathode was<br />
covered by a Ni-YSZ or LSCF(La1-xSrxFe1-yCoyO3)-YSZ electrode layer and a strong dependency <strong>of</strong> the<br />
<strong>NOx</strong> conversion on the microstructure <strong>of</strong> this layer was found 31, 32 . While the studies described so<br />
far all used a precious metal electrode, apart from the work briefly reported by Cicero et al. 24 , the<br />
cylic voltammetry studies made by Hansen et al. in 2000 indicated that transition metal oxides<br />
without addition <strong>of</strong> noble metals could be used for electrochemical <strong>NOx</strong> <strong>reduction</strong>, and especially<br />
LSM15 appeared promising 33-35 . It was also demonstrated by Hansen et al. the redox properties <strong>of</strong><br />
6
1 Introduction<br />
the electrode material was crucial for the NO <strong>reduction</strong> 35 . The work by Hansen et al. was further<br />
elaborated by Werchmeister al., who demonstrated by careful impedance analysis NO2 is an<br />
important reaction intermediate for electrochemical de<strong>NOx</strong> on LSM, LSF and LSCF electrodes 36-38 .<br />
Furthermore Werchmeister et al. made conversion studies on LSM-CGO cells, and found that<br />
impregnation with CeO2, CGO10 and CPO20 (Ce0.8Pr0.2O1.9) increased the <strong>NOx</strong> conversion, however<br />
at 400 °C in 1000 ppm NO + 5% O2 the <strong>NOx</strong> conversion was only 1% with a current efficiency <strong>of</strong><br />
2% 37, 39 .<br />
1.2.5 <strong>Electrochemical</strong> de<strong>NOx</strong> combined with a <strong>NOx</strong> storage compound<br />
A subgroup <strong>of</strong> the studies on electrochemical de<strong>NOx</strong> deals with electrochemical de<strong>NOx</strong> in<br />
combination with a compound for <strong>NOx</strong> storage, as known from the NSR catalyst. One <strong>of</strong> the first<br />
reports on combined electrochemical de<strong>NOx</strong> and <strong>NOx</strong> storage was made in 2002, where Kobayashi<br />
et al. reported increased <strong>NOx</strong> conversion when a Pt/BaO/Al2O3 layer was added on top <strong>of</strong> a Pt<br />
cathode on a YSZ electrolyte 40 . Li et al. reported in 2005 on a <strong>NOx</strong> storage-<strong>reduction</strong><br />
electrochemical catalyst consisting <strong>of</strong> dense YSZ tube on which a thin Pt film was deposited and<br />
impregnated with BaO 41 . But rather than using the potential to affect the <strong>NOx</strong> conversion, Li et al.<br />
used the electrode potential to monitor the progress <strong>of</strong> the <strong>NOx</strong>-storage on BaO, the storage was<br />
observed in the temperature range 350-400 °C 41 . MacLeod et al. used thin porous Pt, Pd or Rh<br />
electrodes on electrolytes <strong>of</strong> Na-β’’alumina and K-β’’alumina, and during polarisation a decrease in<br />
the <strong>NOx</strong> concentration was observed, which was suggested to be due <strong>NOx</strong> storage/nitrate<br />
formation, a suggestion which was confirmed by IR spectroscopy showing KNO3 and KNO2<br />
formation 42 . In a set-up with a cone-shaped point electrode Simonsen et al. made cyclic<br />
voltammetry studies on <strong>NOx</strong> <strong>reduction</strong> on LSM15 electrodes combined with BaO, and the results<br />
indicated BaO addition would increase the <strong>NOx</strong> conversion on LSM electrodes 43 . In the work by<br />
Hamamoto et al. YSZ and CGO based cells with NiO+Pt or LSM+Pt electrodes were investigated for<br />
electrochemical de<strong>NOx</strong> 44, 45 . Hamamoto et al. studied the effect <strong>of</strong> a <strong>NOx</strong>-storage compound added<br />
in a separate adsorbent layer on top <strong>of</strong> the electrode and found an adsorbent layer with K<br />
increased the NO conversion and current efficiency significantly more than adsorbent layers with<br />
Na or Cs 44 . Furthermore increasing the oxygen concentration from 0.5 to 10% decreased the NO<br />
conversion, even though 50% NO still was converted in the presence <strong>of</strong> 10% O2 44 . The adsorbent<br />
layer used by Hamamoto et al. contained 3 wt% Pt and an increase in NO conversion was observed<br />
7
1 Introduction<br />
when a square-wave voltage was applied rather than DC voltage 44 . In a series <strong>of</strong> papers Lucas-<br />
Consuegra et al. reported on an electrochemically assisted NSR catalyst consisting <strong>of</strong> a Pt/K-βAl2O3<br />
cell 46-48 . The Pt/K-βAl2O3 cell investigated by Lucas-Consuegra et al. showed the best performance<br />
at 300 °C, and two different forms <strong>of</strong> nitrate were identified to be formed during the storage<br />
process: a weakly bonded surface nitrate and a bulk nitrate 46 . Furthermore the influence <strong>of</strong> water<br />
in the gas was investigated, and even though the performance <strong>of</strong> the catalyst decreased during<br />
wet conditions, the decrease was not detrimental 46, 47 . Yoshinobu et al. reported recently studies<br />
on electrochemical de<strong>NOx</strong> in combination with electrochemical oxidation <strong>of</strong> particulate matter<br />
(PM); the studies were made both in a disk-electrode set-up and in a honeycomb module tested in<br />
real diesel engine exhaust 49 . The electrodes investigated were composite electrodes <strong>of</strong> Pt or Ag in<br />
combination with YSZ or CGO 49 . The addition <strong>of</strong> BaO to the electrodes was proven to be crucial for<br />
the <strong>NOx</strong> conversion, however in the presence <strong>of</strong> CO2 a performance decrease was observed due to<br />
the formation <strong>of</strong> BaCO3 49 . During the tests in real engine exhaust 97 wt% <strong>of</strong> the PM was removed<br />
and 74% <strong>of</strong> the <strong>NOx</strong> was reduced at a fuel penalty <strong>of</strong> 9%, which are promising results, however a<br />
higher <strong>NOx</strong> conversion and lower fuel penalty must be achieved for the technology to become<br />
commercially attractive 49 .<br />
1.3 Objective and lay-out <strong>of</strong> the thesis<br />
This projects deals with electrochemical de<strong>NOx</strong>, a method under development for <strong>NOx</strong> removal<br />
from automotive diesel engines. The objective <strong>of</strong> the PhD project is to investigate how the <strong>NOx</strong><br />
conversion during electrochemical de<strong>NOx</strong> is affected, when <strong>NOx</strong>-storage compounds are added to<br />
noble metal-free ceramic electrodes. The investigation is centered around three main questions:<br />
1) How much is the activity and selectivity <strong>of</strong> the ceramic electrodes towards <strong>NOx</strong> conversion<br />
affected by the addition <strong>of</strong> a <strong>NOx</strong> storage compound?<br />
2) What are the optimal conditions for <strong>NOx</strong> conversion on ceramic electrodes combined with<br />
<strong>NOx</strong> storage compounds?<br />
3) Which mechanisms/reaction steps are included in the oxidation/storage <strong>of</strong> <strong>NOx</strong> on the<br />
electrodes and the subsequent <strong>reduction</strong>?<br />
8
1 Introduction<br />
The main focus <strong>of</strong> the project is on conversion measurements and electrochemical<br />
characterization, primarily by means <strong>of</strong> electrochemical impedance spectroscopy (EIS).<br />
Furthermore scanning electron microscopy (SEM) is used to study the microstructure <strong>of</strong> the<br />
electrodes before and after testing. In addition to this an infrared spectroscopy study is performed<br />
to investigate the <strong>NOx</strong> adsorption on electrode materials without and with the addition <strong>of</strong> a <strong>NOx</strong>-<br />
storage compound. Finally a small sub-project was made on the development <strong>of</strong> a set-up for<br />
performing in situ X-ray absorption studies on ceramic electrodes.<br />
The thesis contains 12 chapters and one appendix, four <strong>of</strong> the chapters and the appendix are<br />
manuscripts accepted for publication in scientific journals. The content <strong>of</strong> chapters and appendix is<br />
the following:<br />
Chapter 1: The introduction chapter contains a description <strong>of</strong> the <strong>NOx</strong> formation in diesel<br />
engines, a brief overview <strong>of</strong> technologies for <strong>NOx</strong> removal from automotive<br />
exhaust, and a literature survey <strong>of</strong> electrochemical de<strong>NOx</strong> studies.<br />
Chapter 2: The choice <strong>of</strong> electrode materials and <strong>NOx</strong> storage compounds investigated in this<br />
project is explained, and literature findings regarding the properties and<br />
compatibility <strong>of</strong> the investigated materials are summarized.<br />
Chapter 3: An overview is given <strong>of</strong> the experimental test set-ups and techniques used in the<br />
project, with the X-ray absorption experiments as the one exception, as these<br />
experiments only are described in chapter 11.<br />
Chapter 4: The manuscript “Diffuse Reflectance Infrared Fourier Transform Study <strong>of</strong> <strong>NOx</strong><br />
Adsorption on CGO10 Impregnated with K2O or BaO” accepted for publication in<br />
The Journal <strong>of</strong> Physical Chemistry A. The authors <strong>of</strong> the manuscript are Marie<br />
Lund Traulsen, Hanna Härelind Ingelsten and Kent Kammer Hansen.<br />
Chapter 5: The manuscript “Improvement <strong>of</strong> LSM15-CGO10 Electrodes for <strong>Electrochemical</strong><br />
Removal <strong>of</strong> <strong>NOx</strong> by KNO3 and MnOx Impregnation” accepted for publication in<br />
Journal <strong>of</strong> the <strong>Electrochemical</strong> Society. The authors <strong>of</strong> the manuscript are Marie<br />
Lund Traulsen and Kent Kammer Hansen.<br />
9
1 Introduction<br />
Chapter 6: The manuscript “<strong>NOx</strong> conversion on porous LSF15-CGO10 cell stacks with KNO3 or<br />
K2O impregnation” accepted for publication in Journal <strong>of</strong> Solid State<br />
Electrochemistry. The authors <strong>of</strong> the manuscript are Marie Lund Traulsen, Frantz<br />
Bræstrup and Kent Kammer Hansen.<br />
Chapter 7: Describes results from measurements on porous LSF15-CGO10 cell stacks with<br />
BaO impregnation and thus supplements the results described in Chapter 6.<br />
Chapter 8: The manuscript “<strong>NOx</strong> conversion on LSM15-CGO10 cell stacks with BaO<br />
impregnation” accepted for publication in Journal <strong>of</strong> Materials Chemistry. The<br />
authors <strong>of</strong> the manuscript are Marie Lund Traulsen, Kjeld Bøhm Andersen and<br />
Kent Kammer Hansen.<br />
Chapter 9: Describes the results from measurements on LSM15-CGO10 cell stacks with K2O<br />
impregnation and thus supplements the results described in Chapter 8.<br />
Chapter 10: Describes experiments performed in 3-electrode set-up on LSM15 electrodes<br />
without and with BaO.<br />
Chapter 11: Describes a small project made in cooperation with Anke Hagen, Bjørn Sejr<br />
Johansen and Ragnar Kiebach on construction <strong>of</strong> an in situ XANES testhouse for<br />
measurements on solid oxide electrodes.<br />
Chapter 12: Overall discussion, conclusion and outlook.<br />
Appendix A: Manuscript “Spectroelectrochemical Cell for In Situ Studies <strong>of</strong> solid Oxide Fuel<br />
Cells”. The article was based on the project described in Chapter 11 and the<br />
authors <strong>of</strong> article are Anke Hagen, Marie Lund Traulsen, Ragnar Kiebach and Bjørn<br />
Sejr Johansen.<br />
10
2 Materials<br />
2 Materials<br />
In this project two different electrode compositions were investigated for electrochemical de<strong>NOx</strong>,<br />
namely LSM15-CGO10 and LSF15-CGO10. The selectivity and activity <strong>of</strong> these electrodes towards<br />
electrochemical de<strong>NOx</strong> was attempted improved by addition <strong>of</strong> <strong>NOx</strong>-storage compound, as known<br />
from NSR-catalysis, to the electrodes. Three different <strong>NOx</strong>-storage materials were investigated, the<br />
main focus was on BaO and K2O with a few additional experiments performed on MnOx, all storage<br />
compounds were added to the electrodes by impregnation. ln this chapter the reason for choosing<br />
each <strong>of</strong> the mentioned materials will be explained, and a short comment will be made on the<br />
impregnation method. Furthermore the literature on the compatibility and properties <strong>of</strong> the<br />
investigated materials will be briefly reviewed.<br />
2.1 Material Choice<br />
2.1.1 LSM15<br />
LSM has for many years been the favourite material for solid oxide fuel cell cathodes, mainly due<br />
to the activity <strong>of</strong> LSM towards oxygen <strong>reduction</strong>, the good thermal and chemical compatibility<br />
with the commonly used YSZ electrolyte and the high stability <strong>of</strong> the material 50 . Numerous studies<br />
have for this reason been made on LSM, with focus on conductivity 51-53 , the oxygen <strong>reduction</strong><br />
reaction mechanism 54, 55 , defect structure 56, 57 , effect <strong>of</strong> polarisation 58-60 and the compatibility <strong>of</strong><br />
the LSM with electrolyte materials 61 . In addition to activity towards oxygen <strong>reduction</strong> LSM has<br />
also been shown to have activity towards <strong>NOx</strong> <strong>reduction</strong> 34, 35, 39 and when the strontium dopant<br />
levels x=0.05, 0.15, 0.25, 0.35 and 0.50 were compared, LSM15 was observed to have the highest<br />
performance with respect to <strong>NOx</strong> <strong>reduction</strong> 34 . As LSM15 is a well-investigated cathode material<br />
which has shown activity towards <strong>NOx</strong> <strong>reduction</strong>, and since LSM15 had the largest <strong>NOx</strong>-<strong>reduction</strong><br />
activity compared to LSM with other Sr-dopant levels, LSM15 was chosen as one <strong>of</strong> the electrode<br />
materials investigated in this work.<br />
2.1.2 LSF15<br />
Even though LSM has shown activity towards <strong>NOx</strong>-<strong>reduction</strong>, one <strong>of</strong> the concerns related to using<br />
LSM for electrochemical de<strong>NOx</strong> is that LSM cathodes in general show low performances below 800<br />
°C 62 . As an alternative SOFC cathode material for operation at lower temperatures LSF has been<br />
11
2 Materials<br />
investigated and shown promising results 63-65 . The better performance <strong>of</strong> the LSF electrodes<br />
compared to the LSM electrodes at lower temperatures may to a large extent be explained by the<br />
fact that the LSF is a mixed ionic-electronic conductor 66 , while LSM is considered an electronic<br />
conductor 52, 53 . With respect to electrochemical de<strong>NOx</strong> some initial investigations have shown<br />
nitrous oxide (N2O) is reduced on LSF electrodes, with the largest activity observed for the LSF15<br />
when the strontium dopant levels x=0.05, 0.15, 0.25 and 0.35 were compared 67 , and furthermore<br />
reactivity between NO and LSF has been demonstrated 38 . Due to the indications that LSF<br />
electrodes may be able to convert <strong>NOx</strong>, and the expected higher performance <strong>of</strong> LSF electrodes<br />
compared to LSM electrodes in the temperature range investigated, LSF15 was chosen as one <strong>of</strong><br />
the electrode materials investigated in this work.<br />
2.1.3 CGO10<br />
In solid oxide fuel cells, which usually are operated in the temperature range 600-900 °C, the most<br />
commonly used electrolyte is YSZ. In electrochemical de<strong>NOx</strong> the desired operating temperature is<br />
lower compared to solid oxide fuel cells, namely around 300 °C. For this reason CGO10 was chosen<br />
as electrolyte material, since CGO10 has been identified to be superior to YSZ as electrolyte below<br />
600 °C 68 .<br />
2.1.4 BaO<br />
BaO was chosen as <strong>NOx</strong>-storage compound, as BaO is the most commonly used <strong>NOx</strong>-storage<br />
compound in conventional NSR catalysis 21 and <strong>NOx</strong>-storage on BaO for this reason is thoroughly<br />
described in literature 69-71 . The work by Simonsen et al. 43 indicated LSM15 combined with BaO<br />
could be an efficient catalyst for electrochemical de<strong>NOx</strong>, and furthermore studies by Li et al. 41 and<br />
Yoshinobu et al. 49 showed increased <strong>NOx</strong> conversion when electrochemical de<strong>NOx</strong> was combined<br />
with BaO. However, both Li et al. 41 and Yoshinobu et al. 49 used Pt in combination with BaO in their<br />
electrodes for electrochemical de<strong>NOx</strong>, whereas this project investigates electrochemical de<strong>NOx</strong> in<br />
purely ceramic electrodes without addition <strong>of</strong> any precious metals.<br />
2.1.5 K2O<br />
K2O was investigated as a <strong>NOx</strong> storage compound in this work for several reasons: Firstly, because<br />
K2O has been shown to act as a <strong>NOx</strong> storage compound during NSR catalysis 72, 73 and shown<br />
promising results during electrochemical de<strong>NOx</strong> 42, 46, 47 ; and secondly because K is a commonly<br />
12
2 Materials<br />
used promoter in conventional heterogenous catalysis 74 and has been shown to increase<br />
simultaneous <strong>NOx</strong> and soot removal 75, 76 . Impregnation with K2O is for this reason <strong>of</strong> interest for<br />
electrochemical de<strong>NOx</strong> combined with a <strong>NOx</strong> storage compound, both with respect to the <strong>NOx</strong><br />
conversion itself, but also in the perspective <strong>of</strong> developing the technology into a stage, which also<br />
involves soot/excess hydrocarbon removal from the exhaust.<br />
2.1.6 MnOx<br />
MnOx was added as a <strong>NOx</strong>-storage compound as MnOx has shown capability to store <strong>NOx</strong> 77 .<br />
Furthermore impregnation with MnOx is expected to cause a general increase in electrode<br />
performance, since Mn can exist in a number <strong>of</strong> oxidation states, and for this reason is the redox<br />
active center in perovskites used for redox catalysis 78 and has been proven to affect the oxygen<br />
<strong>reduction</strong> reaction on electrodes 79 . As for K2O, addition <strong>of</strong> MnOx may also be <strong>of</strong> interest for a<br />
future combination <strong>of</strong> electrochemical de<strong>NOx</strong> with electrochemical hydrocarbon oxidation, as<br />
MnOx is an active hydrocarbon oxidation catalyst 80-82 .<br />
2.2 Impregnation<br />
Impregnation ii was the method used for addition <strong>of</strong> the <strong>NOx</strong> storage compounds to the electrodes<br />
in this work. In conventional heterogeneous catalysis impregnation is a standard method for<br />
addition <strong>of</strong> a more active catalyst component to a less active support material 83 and in NSR<br />
catalysts the BaO is usually introduced into the catalyst by impregnation 84, 85 . In the 1990’es the<br />
first papers were published on preparation/modification <strong>of</strong> solid oxide electrodes by means <strong>of</strong><br />
impregnation 86, 87 . As impregnation in the first studies appeared to improve the electrode<br />
performance significantly, many research groups have since then been working with impregnation<br />
on solid oxide electrodes and the number <strong>of</strong> publications in the field has increased dramatically,<br />
for extensive reviews on solid oxide electrode impregnation see for instance Jiang 88 or Vohs et<br />
al. 89 .<br />
ii The terms “impregnation” and “infiltration” are both used in literature for the same process, in this thesis<br />
“impregnation” will consistently be used.<br />
13
2.3 Materials compatibility<br />
2 Materials<br />
One <strong>of</strong> the major concerns when impregnating the <strong>NOx</strong>-storage compounds into the electrodes is<br />
whether the storage compounds may react with the electrode materials. This concern is not<br />
significant with respect MnOx impregnation on LSM electrodes, as the LSM used for the LSM<br />
electrodes from the beginning was synthesized as being slightly overstochiometric with respect to<br />
MnOx, and thus already contained some MnOx. However with respect to both K2O and BaO<br />
impregnation on LSM15-CGO10 and LSF15-CGO10 electrodes the risk <strong>of</strong> alternative phase<br />
formation should be taken more seriously. In the work by Simonsen et al. 43 no reaction between<br />
BaO and LSM15 was observed, when a mixture <strong>of</strong> these two materials had been sintered for 12 h<br />
at 1250 °C, and neither was any reaction between Ba-containing materials and LSM observed in<br />
the work by Ai et al. 90 or Jin et al. 91 which altogether indicates no reaction between the BaO and<br />
the LSM should be expected. This is however contradicted by the study made by Yang et al. 92 ,<br />
which showed diffusion <strong>of</strong> Ba from BSCF (Ba1-xSrxFe1-yCoyO3) into LSM. In conclusion, even though<br />
most studies indicate there will be no reaction between LSM and BaO, this cannot be entirely<br />
excluded. With respect to reactivity between BaO and CGO, several studies report on the use <strong>of</strong><br />
Ba-containing electrodes together with CGO electrolytes, but none <strong>of</strong> the studies show reaction<br />
between Ba and CGO as long as the temperature stays below 900 °C 93-95 . To the best <strong>of</strong> the<br />
author’s knowledge no studies are reported on the compatibility between LSM and KNO3/K2O. The<br />
best study for comparison is for this reason likely the study by Kim et al. 96 , in which Mn3O4<br />
impregnated with 0.5 wt% K was investigated as an hydrocarbon oxidation catalyst. The study<br />
showed no new phase formation after impregnation and calcination <strong>of</strong> the sample; however XPS<br />
indicated the K impregnated had increased the defect concentration in the Mn3O4 96 . Furthermore a<br />
number <strong>of</strong> potassium containing manganese compounds are known to exist, namely potassium<br />
permanganate (KMnO4) and potassium manganate (K2MnO4) 1 , which possibly could form during<br />
reaction between K and excess manganese in the electrode. With respect to the combination <strong>of</strong><br />
LSF15 with BaO and K2O no information was found in literature, however due to the similarity in<br />
oxidation state and ionic radii <strong>of</strong> Mn and Fe ions in LSM15 and LSF15 respectively, similar<br />
behaviour with respect to BaO and K2O may be expected.<br />
14
2.4 Material properties<br />
2 Materials<br />
In addition to a possible reaction between electrode materials and impregnated <strong>NOx</strong>-storage<br />
compounds as described in the previous section, there is also the possibility the presence <strong>of</strong> the<br />
<strong>NOx</strong>-storage compounds may significantly alter the current passage through the electrodes and<br />
the cell stacks, especially if the impregnated compounds have a much higher conductivity than the<br />
electrodes and form an interconnected network through the cell stacks. Furthermore if the <strong>NOx</strong>-<br />
storage compounds are molten at the operating temperatures during electrochemical de<strong>NOx</strong>, an<br />
increased risk <strong>of</strong> degradation/coalescence must be expected. For these reasons it is important to<br />
know both the conductivities <strong>of</strong> electrode materials and the <strong>NOx</strong>-storage compounds, and the<br />
melting points <strong>of</strong> the <strong>NOx</strong>-storage compounds. The relevant conductivities and melting points<br />
found from literature are stated in Table 2. No conductivities could be found for K2O and BaO;<br />
likely since these two oxides can be considered insulators. When the conductivities in Table 2 are<br />
compared, the conductivities for LSF15 and LSM15 are consistently highest. By comparison <strong>of</strong> the<br />
conductivities for CGO10 and KNO3 it is evident, that in sections <strong>of</strong> an electrochemical cell with<br />
only CGO10, for instance through a porous CGO electrolyte, an easier current path may be<br />
established through molten KNO3 at 350-500 °C. In the temperature range 300-500 °C investigated<br />
for electrochemical de<strong>NOx</strong> it is also clear from Table 2, that only KNO3 will be present as a melt,<br />
while the other <strong>NOx</strong> storage compounds will remain in solid form.<br />
Table 2. Conductivities and melting points electrode materials and <strong>NOx</strong>-storage compounds.<br />
Compound Conductivity Ref. Melting point 97<br />
[S/cm]<br />
[°C]<br />
LSM15 90-110 (300-600 °C)<br />
52, 53<br />
LSF15 110 (500 °C)<br />
98<br />
CGO10 0.005 (500 °C)<br />
68, 99<br />
K2O -<br />
KNO3 0.660-1.094 (350-500 °C)<br />
BaO -<br />
Ba(NO3)2<br />
MnOx<br />
1x10⁻⁶ (300 °C)<br />
5x10 -7 - 3x10 -3 S/cm 2 at RT(MnO2)<br />
15<br />
740<br />
100 334<br />
1973<br />
101 590<br />
Mn(NO3)2 - *<br />
*Melting point cannot be determined, as Mn(NO 3) 2 decomposes to MnO x before melting 103<br />
102 1842 (MnO), 1567 (Mn3O4),<br />
1080 (Mn2O3)
3 Experimental<br />
3 Experimental<br />
In this chapter an overview is given <strong>of</strong> the experiments conducted to investigate the effect <strong>of</strong> <strong>NOx</strong><br />
storage compounds on electrochemical de<strong>NOx</strong>. The overview includes the different test set-ups<br />
used for the electrochemical characterisation <strong>of</strong> the electrodes, the fabrication <strong>of</strong> the electrodes<br />
including addition <strong>of</strong> the <strong>NOx</strong> storage materials to the electrodes and the experimental techniques<br />
used to characterise the electrodes.<br />
3.1 Test set-ups for electrochemical characterisation<br />
Three different test-set-ups were used for electrochemical testing <strong>of</strong> the electrodes. The test-set-<br />
ups were:<br />
1) Symmetric cell test set-up<br />
2) Porous cell stack test set-up<br />
3) 3-electrode pellet (3EP) test set-up<br />
In general it applies for all the set-ups they can be used for electrochemical testing <strong>of</strong> solid oxide<br />
electrodes at temperatures up to 500 °C in atmospheres containing <strong>NOx</strong> gases, oxygen and argon<br />
in various proportions.<br />
3.1.1 Symmetric cell test set-up<br />
In Figure 1a a sketch <strong>of</strong> a symmetric cell mounted for electrochemical testing is shown, and Figure<br />
1b shows the set-up used for simultaneous testing <strong>of</strong> 4 symmetric cells. The set-up is placed inside<br />
a raku furnace and sealed; whereafter testing can be performed at elevated temperatures in<br />
controlled atmospheres. The advantage <strong>of</strong> the symmetric cell test set-up is it allows for<br />
simultaneous test <strong>of</strong> 4 cells, and since the symmetric cells are fairly easy to fabricate, the<br />
symmetric cell test set-up allows for fast screening <strong>of</strong> many electrode materials. The disadvantage<br />
<strong>of</strong> the symmetric cell test set-up is it is not suitable for gas analysis, which means any conversion<br />
<strong>of</strong> <strong>NOx</strong> during the measurements is not detected, and the set-up can only be used for<br />
electrochemical characterisation <strong>of</strong> electrodes without use <strong>of</strong> a reference electrode.<br />
16
3 Experimental<br />
Figure 1. Symmetric cell test set-up a) sketch <strong>of</strong> set-up for single symmetric cell, b) Image <strong>of</strong> test<br />
set-up for simultaneous testing <strong>of</strong> 4 symmetric cells.<br />
3.1.2 Porous cell stack test set-up.<br />
The principle <strong>of</strong> the porous cell stack test set-up is shown in Figure 2. The porous cell stacks consist<br />
<strong>of</strong> 11 alternating layers <strong>of</strong> porous electrode and electrolyte, corresponding to a stack <strong>of</strong> 5 single<br />
cells. The outer electrodes <strong>of</strong> the porous cell stack are covered by a gold current collector and the<br />
stack is mounted in between two vertical alumina tubes. The alumina tubes contain channels for<br />
the gas flow and measurement probes, which are used for the electrochemical characterisation<br />
and polarisation <strong>of</strong> the cell stacks. The principle is, the gas flow passes through the porous cell<br />
stack, and the large contact area between gas flow and electrode layers assures a high conversion<br />
<strong>of</strong> the <strong>NOx</strong> gasses, if the electrode is active enough. The outlet gas from the porous cell stack is<br />
analysed by a mass spectrometer and a chemiluminiscence detector, which each will be described<br />
in further detail in section 3.5. The advantage <strong>of</strong> the porous stack test set-up is, it allows for gas<br />
analysis <strong>of</strong> the outlet gas in combination with electrochemical characterisation, the disadvantage<br />
is the lack <strong>of</strong> a reference electrode in the set-up limits the electrochemical characterisation.<br />
Current<br />
collector<br />
Alumina<br />
tube<br />
Glass<br />
tube<br />
Gas in<br />
Gas out<br />
Figure 2. Schematic <strong>of</strong> porous cell stack setup<br />
17<br />
Electrolyte<br />
Electrode
3.1.3 3-electrode pellet set-up<br />
3 Experimental<br />
In Figure 3 a principle sketch <strong>of</strong> the 3 electrode pellet (3EP) set-up is shown. The geometric design<br />
<strong>of</strong> the 3EP was determined in the work by Winkler et al. 104 as a very well suited design for<br />
characterisation <strong>of</strong> solid oxide electrodes due to the assurance <strong>of</strong> a uniform current distribution at<br />
the working electrode. The 3EP set-up makes it possible to perform electrochemical<br />
characterisation by use <strong>of</strong> reference electrode with a well-defined potential, which means the<br />
exact potential <strong>of</strong> the working electrode during the measurements may be determined.<br />
Furthermore the outlet gas from the working electrode in this set-up can be analysed to detect<br />
<strong>NOx</strong>-conversion. During this project the outlet gas was analysed by chemiluminiscence detector,<br />
which will be described further in section 3.5. The advantage <strong>of</strong> the 3EP set-up is it allows for a<br />
detailed electrochemical characterisation <strong>of</strong> the solid oxide electrode in combination with gas<br />
conversion measurements. The disadvantage is the 3EPs are fairly time-consuming to produce and<br />
only one 3EP can be tested at a time.<br />
Figure 3. Set-up <strong>of</strong> 3-electrode pellet, note in this work CGO electrolyte was used instead <strong>of</strong> YSZ<br />
electrolyte as stated in the image.<br />
18
3.2 Fabrication <strong>of</strong> electrodes<br />
3 Experimental<br />
The tested solid oxide electrodes were fabricated in two different ways. For testing in symmetric<br />
cell test-set-up and 3EP experiments the electrodes were screen-printed onto a dense electrolyte<br />
tape or pellet respectively. For testing in the porous cell stack test-set-up the electrodes were tape<br />
casted and laminated together with likewise tape casted electrolyte layers. The most significant<br />
differences between the screen-printed and the tape casted electrodes is the porosity <strong>of</strong> the<br />
electrodes, due to the addition <strong>of</strong> poreformers during fabrication <strong>of</strong> the tape casted electrodes.<br />
The difference in porosity is illustrated by comparison between the screen-printed electrode in<br />
Figure 4 and the tape casted electrode in Figure 5. More details on fabrication <strong>of</strong> the screen-<br />
printed electrodes and tape casted electrodes are given in the experimental sections in chapter 5<br />
and chapter 6 respectively.<br />
Figure 4. Microstructure <strong>of</strong> screen-printed LSM15-CGO10 electrode on symmetric cell<br />
Figure 5. Microstructure <strong>of</strong> tape-casted LSM15-CGO10 electrode on porous cell stack<br />
19
3.3 Impregnation<br />
3 Experimental<br />
The impregnation procedures used for impregnation <strong>of</strong> the screen-printed electrodes and the<br />
tape-casted electrodes tested in this work are stated in the following two subsections. The two<br />
different impregnation procedures are based on in-house procedures in the department and were<br />
chosen, as they turned out to give functional results. The first method used for the screen printed<br />
electrodes was a method developed in-house based on the method described by Sholklapper et<br />
al. 105 but without using a gel-step. The second method used for tape casted electrodes was based<br />
on the method described by Lundberg et al. for synthesis <strong>of</strong> high-surface-area CeO2 106 . It should be<br />
emphasized that the procedures have not been carefully optimized, and some <strong>of</strong> the steps in the<br />
procedures, like the use <strong>of</strong> a surfactant and vacuum during the impregnation, may turn out to be<br />
unnecessary, if the impregnation methods are optimized.<br />
3.3.1 Screen-printed electrodes<br />
Impregnation <strong>of</strong> screen-printed electrodes involved the following steps:<br />
1) Preparation <strong>of</strong> an aqueous precursor solution <strong>of</strong> the metal-nitrate<br />
2) For the MnOx and the BaO impregnations purely aqueous nitrate solutions were used,<br />
while for the KNO3 impregnation ≈1wt% Triton-X45 surfactant (Fluka) was added to the<br />
impregnation solution, this addition <strong>of</strong> Triton-X45 may however have been unnecessary.<br />
3) Immersion <strong>of</strong> the cells into precursor solution<br />
4) Vacuum treatment <strong>of</strong> the cells immersed in the precursor solution for ≈10 s at pressure<br />
3 Experimental<br />
3) Covering the cell stacks with the precursor solution by dripping the solution on with a<br />
pipette.<br />
4) Placing the cell stacks covered with impregnation solution in the vacuum chamber and<br />
evacuate for ≈10 s.<br />
5) Removing the cell stacks from the vacuum chamber and wiping <strong>of</strong>f excess precursor<br />
solution.<br />
6) Heat treatment depending on the pre-cursor/desired impregnation.<br />
7) Repeating step 3)-6) until the desired impregnation load was achieved, usually 2-3 times.<br />
3.4 <strong>Electrochemical</strong> characterisation<br />
A Gamry Reference 600 potentiostat was used for the electrochemical characterisation. The main<br />
focus during the electrochemical characterisation was on electrochemical impedance<br />
spectroscopy, as impedance spectra when deconvoluted may yield detailed information on the<br />
processes contributing to the polarisation resistance <strong>of</strong> the electrodes. The impedance spectra<br />
were during the data analysis deconvoluted by use <strong>of</strong> the ZView 2 s<strong>of</strong>tware 107 . In addition to the<br />
impedance measurements cyclic voltammetry was also used for electrode characterisation. Details<br />
on how the impedance measurements and the cyclic voltammetry were performed are given<br />
together with the results in the chapters 5 to 10.<br />
3.5 Gas Analysis<br />
The composition <strong>of</strong> the outlet gas from the porous cell stack set-up was analysed by means <strong>of</strong><br />
both a mass spectrometer and a chemiluminiscence detector, while the outlet gas from the 3EP<br />
set-up was only analysed by a chemiluminiscence detector. In this section the operating principle<br />
<strong>of</strong> the two gas analysis instruments will briefly be explained.<br />
21
3.5.1 Mass spectrometer<br />
3 Experimental<br />
The mass spectrometer used for determination <strong>of</strong> the O2, N2 and N2O concentrations in this work<br />
was a type Omnistar TM GSD 301 from Pfeiffer Vacuum. The basic principle <strong>of</strong> a mass spectrometer<br />
is the gas components are first ionized, then sorted according to mass and finally detected. A very<br />
simplified sketch <strong>of</strong> the components in a mass spectrometer is shown in Figure 6. In the<br />
Omnistar TM GSD 301 mass spectrometer used in this work the sample gas was continuously sucked<br />
into the mass spectrometer through a 1 m long capillary, while the vacuum in the system was<br />
established by the combination <strong>of</strong> a turbo pump and a diaphragm pump. The ion source used was<br />
a tungsten filament and the mass analyser a quadropole mass analyser. The detector used was a<br />
channeltron detector, where channeltron is an abbreviation <strong>of</strong> channel electron multiplier. For<br />
control <strong>of</strong> the mass spectrometer and data acquisition the Quadstar 32-bit s<strong>of</strong>tware from Pfeiffer<br />
Vacuum was used. This s<strong>of</strong>tware can be used for logging <strong>of</strong> the ionic current signal detected during<br />
the measurements, when the MID (Multiple Ion Detection) operating mode is chosen.<br />
Furthermore the s<strong>of</strong>tware can be used converting the ionic current signal into concentrations after<br />
a suitable calibration when the MCD (Multiple Concentration Detection) operating mode is<br />
chosen. The MCD operating mode was used for the conversion measurements in this work.<br />
3.5.2 Chemiluminiscence detector<br />
Figure 6. General schematic <strong>of</strong> mass spectrometer.<br />
The concentration <strong>of</strong> NO, NO2 and <strong>NOx</strong> was detected by a chemiluminiscence detector Model 42i<br />
High Level from Thermo Scientific. The operating principle <strong>of</strong> the chemiluminiscence detector is<br />
based on the detection <strong>of</strong> light emission from excited chemical species, also known as<br />
chemiluminiscence. In the chemiluminiscent detector the NO reacts with ozone and forms excited<br />
22
3 Experimental<br />
NO2* which decays to an un-excited state during emission <strong>of</strong> light/luminescence, the two reactions<br />
are stated in equation 3.1 and 3.2.<br />
NO O 3 → NO 2 * O2<br />
NO 2 * → NO <br />
The intensity <strong>of</strong> the luminiscence is proportional to the NO concentration, which therefore is<br />
determined as described by equation 3.1 and 3.2. For detection <strong>of</strong> NO2, the sample gas is led<br />
through a converter, in which the NO2 is converted to NO. By subtracting the NO concentration<br />
measured when the converter is bypassed, from the concentration measured when the gas passes<br />
through the converter, the NO2 concentration in the sample gas is determined.<br />
3.6 FTIR spectroscopy<br />
FTIR spectroscopy was employed to investigate the effect <strong>of</strong> the <strong>NOx</strong> storage compounds on the<br />
<strong>NOx</strong> adsorption on CGO. The specific FTIR technique used was Diffuse Reflectance Infrared Fourier<br />
Transform (DRIFT) Spectroscopy, which makes it possible to measure directly on powder samples<br />
at elevated temperatures in controlled atmospheres. The spectrometer used for the DRIFT<br />
measurements was a Biorad FTS 6000 FTIR spectrometer equipped with high-temperature<br />
reaction cell (Harrick Scientific, Praying Mantis). More details on the FTIR measurements can be<br />
found in chapter 4 dealing with the DRIFT spectroscopy.<br />
3.7 Microscopy<br />
The electrode microstructure before and after testing was investigated by scanning electron<br />
microscopy (SEM) on a Zeiss Supra 35 microscope equipped with a thermal field emission gun. For<br />
elucidation <strong>of</strong> the microstructure <strong>of</strong> the impregnated compounds the cells were broken and the<br />
broken cross section investigated without any coating at low accelerating voltage (3 kV) using the<br />
in-lens detector. For more overall images <strong>of</strong> the electrode structure the cells were mounted in<br />
epoxy, polished and carbon coated prior to investigation with the SE2 or the QBSD detector.<br />
23<br />
3.1<br />
3.2
4 DRIFT study <strong>of</strong> <strong>NOx</strong> adsorption on CGO10 impregnated with K2O or BaO<br />
4 Diffuse Reflectance Infrared Fourier Transform Study <strong>of</strong> <strong>NOx</strong> Adsorption<br />
on CGO10 Impregnated with K2O or BaO<br />
This chapter is the manuscript “Diffuse Reflectance Infrared Fourier Transform Study <strong>of</strong> <strong>NOx</strong><br />
Adsorption on CGO10 Impregnated with K2O or BaO” accepted for publication in the Journal <strong>of</strong><br />
Physical Chemistry A. The experiments described in this chapter were conducted at Chalmers<br />
University <strong>of</strong> Technology in Sweden.<br />
4.1 Abstract<br />
In the present work Diffuse Reflectance Infrared Fourier Transform (DRIFT) spectroscopy is applied<br />
to study the adsorption <strong>of</strong> <strong>NOx</strong> at 300-500 °C in different atmospheres on gadolinium doped ceria<br />
(CGO), an important material in electrodes investigated for electrochemical <strong>NOx</strong> removal.<br />
Furthermore, the effect on the <strong>NOx</strong> adsorption when adding K2O or BaO to the CGO is<br />
investigated. The DRIFT study shows mainly the presence <strong>of</strong> nitrate species at 500 °C, while at<br />
lower temperature a diversity <strong>of</strong> adsorbed <strong>NOx</strong> species exists on the CGO. Presence <strong>of</strong> O2 is shown<br />
to have a strong effect on the adsorption <strong>of</strong> NO, but no effect on the adsorption <strong>of</strong> NO2. Addition<br />
<strong>of</strong> K2O and BaO dramatically affects the <strong>NOx</strong> adsorption and the results also show that the<br />
adsorbed <strong>NOx</strong> species are mobile and capable <strong>of</strong> changing adsorption state in the investigated<br />
temperature range.<br />
4.2 Introduction<br />
Nitrogen oxides (<strong>NOx</strong>) affect the respiratory system negatively, increases the formation <strong>of</strong> ozone at<br />
ground level, cause formation <strong>of</strong> acid rain, contribute to smog formation and also act as green<br />
house gas 11 . Even though the <strong>NOx</strong> emission from road transport in Europe has been significantly<br />
reduced during the last 10 years, road transport is still the largest single contributor to the <strong>NOx</strong><br />
pollution 2 . The <strong>reduction</strong> <strong>of</strong> <strong>NOx</strong> emission from road transport has mainly followed from the<br />
introduction <strong>of</strong> the three-way-catalyst for cleaning <strong>of</strong> the exhaust from gasoline engines 2 .<br />
Unfortunately, the three-way catalyst cannot remove <strong>NOx</strong> from diesel engine exhaust due to the<br />
higher oxygen content in diesel exhaust. Much research is currently focused on improving the<br />
technologies for removing <strong>NOx</strong> from diesel exhaust, with main focus on the three technologies: 1)<br />
selective catalytic <strong>reduction</strong> with urea (urea-SCR), 2) selective catalytic <strong>reduction</strong> with<br />
24
4 DRIFT study <strong>of</strong> <strong>NOx</strong> adsorption on CGO10 impregnated with K2O or BaO<br />
hydrocarbons (HC-SCR) and 3) the <strong>NOx</strong>-storage and <strong>reduction</strong> (NSR) catalyst, for a review on the<br />
different techniques see Kaspar et al. 7 or Skalska et al. 108 .<br />
An alternative method under development for <strong>NOx</strong>-removal is the electrochemical <strong>reduction</strong> <strong>of</strong><br />
<strong>NOx</strong> 109-111 , where <strong>NOx</strong> <strong>reduction</strong> to N2 and O2 occurs in an electrochemical cell. The <strong>NOx</strong> is reduced<br />
by the electrons supplied to the cell during operation, which makes it unnecessary to add other<br />
reducing agents like urea or extra hydrocarbons, as necessary in urea-SCR, HC-SCR and NSR<br />
catalysis. In the electrochemical cell the <strong>NOx</strong> is reduced on the cathode and afterwards the O 2-<br />
migrates through an oxygen ion conducting electrolyte and is subsequently oxidized to O2 on the<br />
anode, a sketch <strong>of</strong> the principle in electrochemical de<strong>NOx</strong> is shown in Figure 7.<br />
Figure 7. Principle <strong>of</strong> electrochemical de<strong>NOx</strong> (reprinted with permission from 37 )<br />
In the investigation <strong>of</strong> suitable electrode materials for electrochemical de<strong>NOx</strong> a major challenge is<br />
to find electrode materials which have a sufficiently high activity and selectivity, i.e. which are<br />
capable <strong>of</strong> reducing <strong>NOx</strong> but not O2, as <strong>reduction</strong> <strong>of</strong> O2 is a competing reaction on the cathode 111 .<br />
Several electrode materials have been investigated for electrochemical de<strong>NOx</strong>, for example noble<br />
metals 22, 27, 30 , spinels 112 and perovskites 35, 39, 45 . Frequently a composite electrode is applied, i.e. an<br />
electrode with both an electron conducting phase (for instance a perovskite) and an O 2-<br />
conducting phase (for instance yttria stabilized zirconia (YSZ) or CGO) 39, 45, 113 . An obstacle in the<br />
investigation and understanding <strong>of</strong> electrochemical de<strong>NOx</strong> is a limited knowledge <strong>of</strong> the<br />
adsorption <strong>of</strong> <strong>NOx</strong> on the electrode materials, and how this adsorption changes in the temperature<br />
ranges investigated for electrochemical de<strong>NOx</strong> (usually 300-600 °C) and depending on the<br />
presence <strong>of</strong> NO or NO2. The aim in this work is to apply DRIFT (Diffuse Reflectance Infrared Fourier<br />
Transform) spectroscopy to study the <strong>NOx</strong> adsorption at conditions relevant for electrochemical<br />
25
4 DRIFT study <strong>of</strong> <strong>NOx</strong> adsorption on CGO10 impregnated with K2O or BaO<br />
de<strong>NOx</strong>. The study will be made on CGO10 (Ce0.9Gd0.1O1.95), a material frequently used in electrodes<br />
for electrochemical de<strong>NOx</strong>. Moreover the effect on the <strong>NOx</strong> adsorption <strong>of</strong> impregnating the CGO10<br />
with K2O or BaO is investigated as several studies show that addition <strong>of</strong> these compounds, known<br />
from the NSR catalyst, may increase the <strong>NOx</strong> conversion during electrochemical de<strong>NOx</strong> 43, 44, 46 . The<br />
findings in this work are in the results and discussion section related to literature on <strong>NOx</strong><br />
adsorption on compounds similar to the electron conducting perovskites frequently used in<br />
de<strong>NOx</strong>-electrodes. Altogether this will <strong>of</strong>fer a possibility <strong>of</strong> relating observations on activity and<br />
selectivity during electrochemical de<strong>NOx</strong> to the adsorption capabilities <strong>of</strong> the electrode materials.<br />
Even though the DRIFT measurements in this work are performed at relevant temperatures and<br />
gas compositions, they cannot be considered “true” in-situ measurements with respect to<br />
electrochemical de<strong>NOx</strong> since they are performed on powders and not electrodes under<br />
polarization. Martinez-Arias et al. pointed out that NO adsorption depends on the vacancy<br />
concentration at the surface <strong>of</strong> CeO2 114 . Since the vacancy concentration <strong>of</strong> CGO based electrodes<br />
likely is significantly altered during cathodic polarization, due to the pumping <strong>of</strong> O 2- away from the<br />
electrode surface, there may be some differences between the NO adsorption observed on CGO10<br />
powders and on CGO10 in electrodes under polarization. However, since an important aim in this<br />
work is to study the influence <strong>of</strong> K2O and BaO impregnation on the <strong>NOx</strong> adsorption on CGO10, it is<br />
believed that altered properties <strong>of</strong> the powder sample, owing to impregnation with K2O or BaO,<br />
reflects similar effects on electrodes under polarization.<br />
4.2.1 <strong>NOx</strong> adsorption on CeO2<br />
To the best <strong>of</strong> the author’s knowledge there is no reporting on IR-studies <strong>of</strong> <strong>NOx</strong> adsorption on<br />
CGO10 in the temperature range 300-500 °C. However, several studies have been made <strong>of</strong> <strong>NOx</strong>-<br />
adsorption on CeO2 in the temperature range from RT to 400 °C 114-117 . Even though the<br />
assignment <strong>of</strong> the adsorption peaks observed is not unambiguous, the references in general agree<br />
on the presence <strong>of</strong> several different adsorbed <strong>NOx</strong>-species on CeO2, and usually assign the peaks<br />
to the presence <strong>of</strong> NO2 - (nitrite), N2O2 2- (hyponitrite) and NO3 - (nitrate) species. In the work by<br />
Philip et al. it was pointed out, how NO adsorption without oxygen mainly led to the formation <strong>of</strong><br />
NO2 - , whereas in the presence <strong>of</strong> oxygen NO3 - was formed through the steps: NO adsorption/NO2 -<br />
formation → oxidation to NO3 - 116 . Philip et al. also showed, how the <strong>NOx</strong>, adsorption decreased,<br />
when the temperature was increased from 50 °C to 300 °C 116 .<br />
26
4 DRIFT study <strong>of</strong> <strong>NOx</strong> adsorption on CGO10 impregnated with K2O or BaO<br />
4.2.2 <strong>NOx</strong> adsorption on K2O and BaO<br />
Numerous studies have been made on the <strong>NOx</strong> adsorption on K- and Ba- containing catalysts, as<br />
both elements are <strong>of</strong> interest for the NSR-catalyst 69-71, 85, 118-122 . On Ba, <strong>NOx</strong> mainly adsorbs in the<br />
form <strong>of</strong> NO2 - or NO3 - 69, 70, 119 . Similar for K-containing catalysts, the <strong>NOx</strong> adsorption mainly leads to<br />
formation <strong>of</strong> NO2 - and NO3 - 72, 120 , but as pointed out by Lesage et al. 72 NO2 - formation is only<br />
detected at lower temperatures (200 °C). At higher temperatures (400 °C) only NO3 - formation is<br />
observed, implying that either NO3 - is formed directly at higher temperatures or that NO2 -<br />
conversion into NO3 - is so fast the NO2 - cannot be detected.<br />
4.3 Experimental Methods<br />
4.3.1 Sample preparation<br />
Three different samples were prepared for the measurements on CGO: 1) A non-impregnated<br />
CGO sample, 2) a K2O impregnated sample, and 3) a BaO impregnated sample.<br />
The CGO10 was a commercially available powder from Rhodia. For the preparation <strong>of</strong> the<br />
impregnated samples an aqueous solution <strong>of</strong> either KNO3 or Ba(NO3)2 was made. The nitrate<br />
solutions were mixed with CGO powder for several hours, and subsequently the mixtures were<br />
dried at 80 °C. After drying the samples were heated to 700 °C to decompose the nitrate into<br />
oxide. Amounts were chosen to give a weight percentage in the dry mixture <strong>of</strong> 3 wt% K2O and 1<br />
wt% BaO, respectively.<br />
4.3.2 IR measurements<br />
The DRIFT measurements were performed on a Biorad FTS 6000 FTIR spectrometer equipped with<br />
a high-temperature reaction cell (Harrick Scientific, Praying Mantis) with KBr windows. The gasses<br />
(NO, NO2, O2 and Ar) were supplied by mass flow controllers (Bronkhorst Hi-Tech) and the total<br />
flow to the cell during pre-treatment and measurements was 100 ml/min. The sample crucible was<br />
heated during the experiment and the temperature was controlled by a K-type thermocouple<br />
connected to a Eurotherm 2416 temperature controller.<br />
27
4 DRIFT study <strong>of</strong> <strong>NOx</strong> adsorption on CGO10 impregnated with K2O or BaO<br />
Each sample was first pre-treated at 500 °C in 10% O2 for 1 h, whereafter background spectra were<br />
recorded from 500 to 300 °C in steps <strong>of</strong> 50 °C, while the sample was supplied with 10% O2. The<br />
sample was re-heated to 500 °C and the inlet gas was changed to one <strong>of</strong> the following<br />
compositions:<br />
a. 1000 ppm NO, balance Ar<br />
b. 1000 ppm NO, 10% O2, balance Ar<br />
c. 1000 ppm NO2, balance Ar<br />
d. 1000 ppm NO2, 10% O2, balance Ar<br />
IR spectra were recorded with resolution 1 cm -1 in the range 4000-1000 cm -1 from 500 °C to 300 °C<br />
in steps <strong>of</strong> 50 °C, with the temperature hold for 30 min at each temperature step to let the<br />
adsorbed species stabilize. For each <strong>of</strong> the gas compositions the sample was changed to a fresh<br />
sample.<br />
4.3.3 Temperature programmed desorption<br />
Temperature programmed desorption (TPD) was made on all samples according to the following<br />
sequence:<br />
1. Pre-treatment at 500 °C in 10% O2 for 1 h<br />
2. Cooling to 30 °C followed by adsorption for ½ h in 1000 ppm NO + 10% O2<br />
3. Flush at 30 °C for ½ h in 10% O2<br />
4. TPD at ramp rate 15 °/min from 30 °C to 500 °C in 10% O2<br />
5. Cool down<br />
The spectra recorded at 30 °C in 10% O2 just prior to the TPD were used as background for the<br />
recorded IR-spectra. Unfortunately the maximum temperature in the experimental set-up was<br />
500 °C, otherwise it would have been <strong>of</strong> interest to increase the temperature to even higher<br />
values, since many <strong>of</strong> the adsorbed <strong>NOx</strong> species appeared to be stable at 500 °C in 10% O2. In none<br />
<strong>of</strong> the experiments it was possible to detect any desorption peaks on the mass spectrometer due<br />
to the stability <strong>of</strong> the <strong>NOx</strong> species and/or small amount <strong>of</strong> sample used. However, interesting<br />
observations were made on the IR spectra recorded during the experiment; these observations<br />
will be described in the results and discussion section.<br />
28
4 DRIFT study <strong>of</strong> <strong>NOx</strong> adsorption on CGO10 impregnated with K2O or BaO<br />
4.4 Results and discussion<br />
For evaluation <strong>of</strong> the infrared spectra the absorbance is plotted as a function <strong>of</strong> wavenumber. The<br />
absorbance is defined as in equation 4.1:<br />
I<br />
A = log<br />
I<br />
- where I0 is the intensity <strong>of</strong> the background spectra, and I is the intensity during the actual<br />
measurement. It follows from equation (1) that a positive peak on the absorbance plot<br />
corresponds to formation <strong>of</strong> an adsorbed specie, and a negative peak correspond to removal<br />
and/or blocking <strong>of</strong> an adsorbed specie. The background spectra were as previously stated<br />
recorded in 10% O2 in Ar at 500-300 °C. In Figure 8 the background spectra recorded on the non-<br />
impregnated CGO10 sample are shown. Clearly there is very little effect <strong>of</strong> the temperature on the<br />
background and in order to simplify the data treatment the background spectrum recorded at 500<br />
°C was used for calculation <strong>of</strong> the absorbance at all temperatures.<br />
Signal [Volts]<br />
3.0<br />
2.5<br />
2.0<br />
1.5<br />
1.0<br />
0.5<br />
0.0<br />
8000<br />
6000<br />
500 °C<br />
450 °C<br />
400 °C<br />
350 °C<br />
300 °C<br />
Wavenumber [cm-1]<br />
Figure 8. Background spectra recorded in 10% O2 in Ar on non-impregnated CGO10 sample. The<br />
29<br />
0<br />
4000<br />
2000<br />
spectra originally overlaid each other but has been elevated to ease comparison.<br />
0<br />
4.1
4 DRIFT study <strong>of</strong> <strong>NOx</strong> adsorption on CGO10 impregnated with K2O or BaO<br />
4.4.1 Evolution <strong>of</strong> surface species over CGO10<br />
When the CGO10 powder sample is exposed to NO (1000 ppm) and O2 (10%), the most<br />
pronounced features <strong>of</strong> the IR spectra over the entire temperature range from 500 °C to 300 °C,<br />
are two groups <strong>of</strong> peaks located around 1600 cm -1 and 1200 cm -1 , see Figure 9 and Figure 10. In<br />
between these two features a broad negative peak is observed. This negative peak becomes more<br />
and more negative when the temperature decreases, indicating that adsorbed species are<br />
removed during the experiment. In addition to these peaks several smaller peaks, both negative<br />
and positive, are observed in the range 1900-4000 cm -1 . In general, the peak intensities increases<br />
with decreasing temperature, which indicates that the adsorbed species are more readily<br />
adsorbed at lower temperatures. Some peaks, which are not observed at 500 °C, become visible at<br />
lower temperatures, see Figure 10, which indicates there is a change in the type <strong>of</strong> adsorbed<br />
species with temperature. With respect to the time dependence <strong>of</strong> the peaks, no new peaks<br />
appear after the first minute <strong>of</strong> exposure at each temperature; however the peak intensity tends<br />
to increase with time, most pronounced for the measurement at 500 °C.<br />
Absorbance<br />
1.4<br />
1.2<br />
1.0<br />
0.8<br />
0.6<br />
0.4<br />
0.2<br />
0.0<br />
4000<br />
300 °C<br />
350 °C<br />
400 °C<br />
450 °C<br />
500 °C<br />
3500<br />
3000<br />
Wavenumber [cm-1]<br />
Figure 9. DRIFT spectra recorded on non-impregnated CGO sample in 1000 ppm NO + 10% O2 at<br />
300-500 °C.<br />
30<br />
2500<br />
2000<br />
1500<br />
1000
4 DRIFT study <strong>of</strong> <strong>NOx</strong> adsorption on CGO10 impregnated with K2O or BaO<br />
Absorbance<br />
0.6<br />
0.4<br />
0.2<br />
0.0<br />
-0.2<br />
1800<br />
Increasing temp.<br />
1600<br />
Wavenumber [cm-1]<br />
31<br />
1400<br />
Increasing temp.<br />
Figure 10. Close-up <strong>of</strong> DRIFT spectra shown in Figure 9. The spectra were recorded in 1000 ppm<br />
NO + 10% O2 at 300-500 °C.<br />
The presence <strong>of</strong> many peaks, which in several cases are overlapping, combined with previous<br />
reports on NO-adsorption, which are not always in agreement, makes an unambiguous assignment<br />
<strong>of</strong> each peak to a specific adsorbed specie a difficult, if not impossible task. However, with this in<br />
mind it is still possible to make some reasonable suggestions and to point out tendencies,<br />
especially when comparing spectra recorded with different gasses, at different temperatures and<br />
on different samples.<br />
First <strong>of</strong> all the negative peaks observed on the spectra at 3600-3700 cm -1 , 2300 cm -1 and 1300-<br />
1500 cm -1 are assigned to OH-groups 123 , adsorbed CO2 124 and carbonate/carboxylate 125 groups<br />
respectively. These three types <strong>of</strong> species are removed or blocked during the experiment, which<br />
causes the negative peaks. The small, positive peaks observed at wavenumbers higher than 2500<br />
cm -1 could not be identified by comparison to literature, but are believed to be overtones from<br />
1200<br />
peaks observed at lower wavenumbers. These peaks will not be discussed any further.<br />
As previously mentioned the largest absorption peaks are observed in the spectra as two features<br />
located at 1600 cm -1 and 1200 cm -1 . In the literature pairwise absorption peaks due to NO3 - was<br />
reported on α-Fe2O3 at ≈1550cm -1 and ≈1270 cm -1 126 and similar peaks were later found on CeO2<br />
and Ce0.62Zr0.38O2 116, 117, 127 . For this reason it seems likely that the peaks observed in this work at
4 DRIFT study <strong>of</strong> <strong>NOx</strong> adsorption on CGO10 impregnated with K2O or BaO<br />
1520-1580 cm -1 and 1200-1250 cm -1 can be ascribed to NO3 - . However, it should be mentioned,<br />
Cerrutti et al. ascribed peaks at 1208-1222 cm -1 to chelating NO2 - instead <strong>of</strong> NO3 - 128 , but the broad<br />
shape <strong>of</strong> the peak around 1200 cm -1 observed in this work also indicates the peak may be due to<br />
several adsorbed species, for instance due to both NO3 - and chelating NO2 - adsorbed on the CGO<br />
surface.<br />
With respect to the region around 1600 cm -1 only one, clearly distinctive peak is observed at 500<br />
°C at 1573 cm -1 , ascribed to NO3 - (see above). The peak at 1573 cm -1 has two low asymmetric<br />
shoulders on the left/high wavenumber side. When the temperature is decreased to 300 °C, these<br />
two shoulders increase in size, and in addition two peaks appear at 1603 and 1610 cm -1 ,<br />
respectively. By comparison to literature these two peaks are suggested to be due to adsorbed<br />
NO - and adsorbed NO2, as these two species were ascribed by Busca et al. to 1595 cm -1 and 1605<br />
cm -1 126 , respectively. It also seems reasonable that more weakly adsorbed species like NO - and<br />
NO2 only adsorbs at lower temperatures as observed in this work, while at 500 °C only strongly<br />
adsorbed species like NO3 - can stay adsorbed on the CGO surface.<br />
Finally minor peaks are observed at 1673-1680 cm -1 , 1720 cm -1 and 2207-2212 cm -1 , and suggested<br />
to be due to N2O4 126 , cis-N2O2 2- 129 and N2O 114, 126, 130 respectively.<br />
4.4.2 Influence <strong>of</strong> gas phase conditions on the formation <strong>of</strong> surface species<br />
The adsorption peaks described in the previous section were observed on DRIFT spectra recorded<br />
on a non-impregnated CGO10 sample subjected to 1000 ppm NO + 10% O2. Spectra were also<br />
recorded on non-impregnated CGO10 while subjected to three other atmospheres: 1000 ppm NO,<br />
1000 ppm NO2 and 1000 ppm NO2 + 10% O2. In general the spectra recorded in 1000 ppm NO +<br />
10% O2, 1000 ppm NO2 and 1000 ppm NO2 + 10% O2 look very much alike (se Figure 11 and Figure<br />
12), with dominating peak groups located at ≈1600 cm -1 and ≈1200 cm -1 , ascribed as previously<br />
mentioned to adsorbed NO2 (≈1610 cm -1 ), NO3 - (≈1580 cm -1 ), and at 1197-1245 cm -1 overlapping<br />
NO3 - and NO2 - peaks. In addition to these peaks smaller peaks ascribed to N2O (2207 cm -1 ) 130 , cis-<br />
N2O2 2- (≈1720 cm -1 ) 129 , N2O4 (1671-1680 cm -1 ) 126 and NO2 (1610-1614 cm -1 ) 126 are also observed.<br />
On the spectra recorded in 1000 ppm NO + 10% O2 an extra peak is visible at 1603 cm -1 in between<br />
the 1610 cm -1 and 1580 cm -1 peak (see Figure 10), which likely can be ascribed to NO - 126 . From the<br />
results it is not possible to conclude, whether this peak is not present in the NO2 containing<br />
32
4 DRIFT study <strong>of</strong> <strong>NOx</strong> adsorption on CGO10 impregnated with K2O or BaO<br />
atmospheres, or if the peak simply is overshadowed by the NO2(ads) peak at 1610 cm -1 , which as<br />
expected is very strong in the NO2 containing atmospheres. At 500 °C the NO - peak is no longer<br />
discernible, and the NO2(ads) peak is only visible as a weak shoulder, as the region around 1600<br />
cm -1 has become entirely dominated by the nitrate peak at 1573 cm -1 .<br />
Absorbance<br />
1.4<br />
1.2<br />
1.0<br />
0.8<br />
0.6<br />
0.4<br />
0.2<br />
0.0<br />
2000<br />
NO 2 + O 2<br />
NO 2<br />
NO + O 2<br />
NO<br />
1800<br />
1600<br />
Wavenumber [cm-1]<br />
33<br />
1400<br />
1200<br />
Figure 11. DRIFT spectra recoded on non-impregnated CGO sample at 300 °C.<br />
Absorbance<br />
1.2<br />
1.0<br />
0.8<br />
0.6<br />
0.4<br />
0.2<br />
0.0<br />
2000<br />
NO 2 + O 2<br />
NO 2<br />
NO + O 2<br />
NO<br />
1800<br />
1600<br />
1400<br />
Wavenumber [cm -1 ]<br />
Figure 12. DRIFT spectra recorded in different atmospheres on non-impregnated CGO sample at<br />
500 °C.<br />
1200
4 DRIFT study <strong>of</strong> <strong>NOx</strong> adsorption on CGO10 impregnated with K2O or BaO<br />
When the spectra recorded in 1000 ppm NO are compared to the spectra recorded in the three<br />
other atmospheres significant differences are observed, mainly as much fewer peaks are present<br />
in the IR spectra when the sample is supplied with only 1000 ppm NO in Ar. At 300 °C three<br />
adsorption peaks are clearly visible, at 1560 cm -1 , 1269 cm -1 and 1211 cm -1 , as in the previous<br />
section these peaks are ascribed to NO3 - (1560 cm -1 , 1269 cm -1 , 1211 cm -1 ) and/or NO2 - (1269 cm -1 ,<br />
1211 cm -1 ). At first hand it is surprising to find dominating peaks due to a NO3 - , i.e. a highly<br />
oxidized NO specie, when there is no oxygen in the atmosphere and also since the IR spectra<br />
recorded by Philip et al. under similar conditions mainly seemed to be dominated by NO2 -<br />
species 116 . Still the results in this work indicate, when CGO10 is supplied with 1000 ppm NO at 300<br />
°C, NO is adsorbed and NO3 - are formed by reaction <strong>of</strong> the NO with adsorbed oxygen or lattice<br />
oxygen at the CGO10 surface. It should be kept in mind; the CGO surface due to the pre-treatment<br />
in 10% O2 likely is fairly rich in O2 from the beginning <strong>of</strong> the experiment.<br />
At 500 °C it is not possible to observe adsorption peaks at all, but curiously enough two clear<br />
desorption peaks are observed at 1552 cm -1 and 1255 cm -1 , i.e. almost exactly at the wavenumbers<br />
where the NO3 - /NO2 - adsorption peaks were observed at lower temperatures, see Figure 12. This<br />
could indicate that when the background spectrum was recorded, i.e. prior to the treatment in<br />
NO-containing atmosphere, a small amount <strong>of</strong> NO was already adsorbed on the CGO and this NO<br />
then subsequently is removed at 500 °C when the sample is treated in 1000 ppm NO without O2. It<br />
is unknown where this small amount <strong>of</strong> pre-adsorbed NO should have come from, as the sample<br />
prior to experiment had not been near any NO source, and the experimental set-up was flushed in<br />
10% O2 between all the experiments to avoid any residual NO in the gas supply system during the<br />
start-up <strong>of</strong> a new experiment.<br />
A summary <strong>of</strong> the NO-related peaks observed in the four different atmospheres is given in Table 3<br />
together with the assignment <strong>of</strong> the peaks to different <strong>NOx</strong>-species. The wavenumbers are stated<br />
for peaks observed at 300 °C, and if the wavenumber is written in bold the peak was also observed<br />
at 500 °C.<br />
34
4 DRIFT study <strong>of</strong> <strong>NOx</strong> adsorption on CGO10 impregnated with K2O or BaO<br />
Table 3. Wavenumbers (cm -1 ) at which peaks ascribed to adsorbed <strong>NOx</strong>-species were observed on<br />
CGO in the following atmospheres: 1000 ppm NO, 1000 ppm NO + 10% O2, 1000 ppm NO2, 1000<br />
ppm NO2 + 10% O2. The peaks were observed at 300 °C, and if the wavenumber is written in bold<br />
letters, also at 500 °C.<br />
NO NO+O2 NO2 NO2+O2 Assignment Reference<br />
2207 N2O<br />
2004 2199 2196 ?<br />
1922 1912 1914 NO(ads)<br />
1720 1720 1718 cis-N2O2 2-<br />
1680 1671 1674 N2O4<br />
1630 1630 1630 NO2<br />
1610 1614 1612 NO2(ads)<br />
1603 NO -<br />
1560 * 1581 1581 1578 NO3 - ( bidentate)<br />
1536 NO3 - ( bidentate)<br />
1286’ NO2 - (chelating)<br />
1263’ 1245 1242 1239 NO3 - (monodentate)/chelating NO2 -<br />
1219 1197 1196 1190 NO3 - (bidentate)/ NO2 -<br />
* positive peaks at 300 °C, negative peaks at 500 °C; ‘Only observed at 500 °C<br />
35<br />
114, 126, 130<br />
131<br />
129<br />
126<br />
132, 133<br />
126<br />
126<br />
116, 126, 127<br />
117, 126, 127<br />
114-117, 129, 134<br />
126, 128, 135/128<br />
126, 128, 135/127
4 DRIFT study <strong>of</strong> <strong>NOx</strong> adsorption on CGO10 impregnated with K2O or BaO<br />
4.4.3 Influence <strong>of</strong> catalyst composition on the formation <strong>of</strong> surface species<br />
Already on the background spectra recorded in 10% O2 a clear difference is seen between the non-<br />
impregnated and the K2O impregnated sample, see Figure 13. On the K2O impregnated sample<br />
four negative peaks are observed a 2757, 2400, 2069 and 1767 cm -1 . Negative peaks observed on<br />
background spectra are caused by IR-absorbing species and the 4 aforementioned peaks<br />
correspond exactly to the 4 peaks measured for KNO3 by Bates et al. 136 . The presence <strong>of</strong> KNO3 is<br />
somewhat surprising, since the sample during the preparation was heated to 700 °C, and the KNO3<br />
by this was expected to decompose to K2O. However, from the background spectra it must be<br />
concluded that either was all the KNO3 not completely thermally decomposed, or the K2O has after<br />
the heat-treatment at 700 °C taken up some <strong>NOx</strong> and formed KNO3 again.<br />
Signal [Volts]<br />
3.0<br />
2.5<br />
2.0<br />
1.5<br />
1.0<br />
0.5<br />
0.0<br />
4000<br />
non-impregnated<br />
K 2 O impregnated<br />
3500<br />
3000<br />
2500<br />
Wavenumber [cm-1]<br />
Figure 13. Comparison between background spectra recorded at 500 °C in 10% O2 on non-<br />
impregnated and K2O impregnated sample.<br />
The absorbance spectra recorded on the K2O impregnated sample looks much different compared<br />
36<br />
2000<br />
1500<br />
1000<br />
to the spectra recorded on the non-impregnated sample, see Figure 14 for comparison <strong>of</strong> the<br />
spectra recorded at 300 °C and 500 °C in 1000 ppm NO +10% O2 and Table 4 for an overview <strong>of</strong> the<br />
peaks observed at 300 °C and 500 °C . For the K2O impregnated sample the IR spectra show four<br />
significant adsorption peaks at 2757, 2400, 2069 and 1767 cm -1 , which as just described are due to<br />
KNO3 136 . A few other adsorption peaks are also observed at 300 °C at the following wavenumbers:<br />
1883 cm -1 (NO on potassium) 137 , 1514 cm -1 (NO3 - ) 126 and 1343 cm -1 (NO3 - in KNO3) 136 . As for the
4 DRIFT study <strong>of</strong> <strong>NOx</strong> adsorption on CGO10 impregnated with K2O or BaO<br />
blank sample, the K2O impregnated sample also shows negative peaks in the region 2333-2364<br />
cm -1 , corresponding to removal <strong>of</strong> adsorbed CO2. More surprising is however the K2O impregnated<br />
sample shows a large negative peak, both at 300 and 500 °C, at 1560-1573 cm -1 , i.e. at the same<br />
wavenumbers as the dominating peak ascribed to NO3 - on the non-impregnated sample. This<br />
could indicate that NO3 - adsorbed on CGO-sites <strong>of</strong> the K2O-impregnated sample during testing at<br />
300-500 °C desorbs more easily or eventually migrates/spills over from the CGO sites to K2O/KNO3-<br />
sites.<br />
Absorbance<br />
1.4<br />
1.2<br />
1.0<br />
0.8<br />
0.6<br />
0.4<br />
0.2<br />
0.0<br />
-0.2<br />
4000<br />
non-impregnated, 300 °C<br />
K 2 O impregnated, 300 °C<br />
K 2 O impregnated, 500 °C<br />
3500<br />
3000<br />
2500<br />
Wavenumber [cm -1 ]<br />
Figure 14. DRIFT spectra recorded at 300 °C on non-impregnated sample and at 300 °C and 500 °C<br />
37<br />
2000<br />
on K2O imp. CGO samples supplied with 1000 ppm NO + 10% O2.<br />
1500<br />
1000
4 DRIFT study <strong>of</strong> <strong>NOx</strong> adsorption on CGO10 impregnated with K2O or BaO<br />
Table 4. Wavenumbers (cm -1 ) at which peaks ascribed to adsorbed <strong>NOx</strong>-species were observed on<br />
K2O impregnated CGO at 300 °C and at 500 °C, while the sample was supplied with 1000 ppm NO +<br />
10% O2. The assignment <strong>of</strong> the peaks with references is also stated.<br />
300 °C 500 °C Assignment Ref<br />
2757 (K)NO3 -<br />
2553(neg) ?<br />
2522 ?<br />
2467<br />
2400 (K)NO3 -<br />
2356 ?<br />
2069<br />
?<br />
2018 ?<br />
1883 NO<br />
1767<br />
(K)NO3 -<br />
(K)NO3 -<br />
1731(neg) 1723(neg) cis-N2O2 2-.<br />
1573(neg) 1560(neg) NO3 - ( bidentate)<br />
1514 NO3 - ( bidentate)<br />
1343<br />
solid KNO3/molten KNO3<br />
38<br />
136<br />
136<br />
136<br />
137<br />
136<br />
129<br />
116, 126, 127<br />
117, 126, 127<br />
136
4 DRIFT study <strong>of</strong> <strong>NOx</strong> adsorption on CGO10 impregnated with K2O or BaO<br />
For the BaO impregnated sample the background spectra looked similar to the background spectra<br />
<strong>of</strong> the non-impregnated sample. In the absorbance spectra recorded on the BaO impregnated<br />
sample clear peaks were observed, see Figure 15 and Table 5. Several peaks observed at the<br />
highest wavenumbers could not be identified by comparison to literature, but the peak observed<br />
at ≈2390 cm -1 is likely ascribed to Ba(NO3)2 138 and the small peak observed at 2221 cm -1 to N2O 114,<br />
126, 130 . All the peaks observed at lower wavenumbers (below 1800 cm -1 ) could by comparison to<br />
literature be assigned to either Ba(NO3)2 70, 120, 138 or Ba(NO2) (monodentate nitrite) 70 . When the<br />
temperature is increased from 300 to 500 °C the intensity <strong>of</strong> the peaks decreases, i.e. there<br />
becomes less <strong>of</strong> the adsorbed species, but only the N2O and the Ba(NO3)2 at 1358 cm -1 disappears<br />
entirely due to the temperature increase.<br />
Absorbance<br />
1.4<br />
1.2<br />
1.0<br />
0.8<br />
0.6<br />
0.4<br />
0.2<br />
0.0<br />
4000<br />
non-impregnated, 300 °C<br />
BaO impregnated, 300 °C<br />
BaO impregnated, 500 °C<br />
3500<br />
3000<br />
Wavenumber [cm -1 ]<br />
Figure 15. DRIFT spectra recorded at 300 °C on a non-impregnated sample and at 300 °C and 500<br />
39<br />
2500<br />
2000<br />
1500<br />
°C on a BaO impregnated sample supplied with 1000 ppm NO + 10% O2.<br />
1000
4 DRIFT study <strong>of</strong> <strong>NOx</strong> adsorption on CGO10 impregnated with K2O or BaO<br />
Table 5. Wavenumbers (cm -1 ) at which peaks ascribed to adsorbed <strong>NOx</strong>-species were observed on<br />
BaO impregnated CGO at 300 °C and at 500 °C, while the sample was supplied with 1000 ppm NO<br />
+ 10% O2. The assignment <strong>of</strong> the peaks with references is also stated.<br />
300 °C 500 °C Assignment Ref<br />
2457 ?<br />
2392 2390 Ba(NO3)2<br />
2221<br />
2276 ?<br />
1974 ?<br />
N2O<br />
1772 1767 Ba(NO3)2<br />
1565 1550 Ba(NO3)2<br />
1415 1414 Ba(NO3)2)/ Ba(NO2)<br />
1358 Ba(NO3)2<br />
1307 1304 Ba(NO2)<br />
1247 1252 Ba(NO3)2<br />
40<br />
138<br />
114, 126, 130<br />
138<br />
70<br />
120, 138/ 70<br />
120, 138<br />
70<br />
138
4 DRIFT study <strong>of</strong> <strong>NOx</strong> adsorption on CGO10 impregnated with K2O or BaO<br />
4.4.4 Influence <strong>of</strong> temperature on the formation <strong>of</strong> surface species<br />
The TPD itself on the non-impregnated sample did not yield any new information on the <strong>NOx</strong><br />
adsorption and desorption, which had not already been gained during the previously performed<br />
adsorption experiments in different atmospheres. However during the cool-down after the TPD a<br />
somewhat surprising observation was made. After the feature around 1600 cm -1 at 500 °C had<br />
been reduced to only one peak at 1573 cm -1 , a clear peak at 1612 cm -1 re-appeared during cool<br />
down, see Figure 16. Further, a redistribution is appearing in the feature around 1200 cm -1 during<br />
cool down (Figure 16). It should be emphasized the redistribution <strong>of</strong> the NO peaks occurred, even<br />
though the sample was kept in 10% O2 and had been so for more than one hour, when the sample<br />
was cooled down. Overall the results from cooling down indicate that changing the temperature<br />
does not only affect the gaseous <strong>NOx</strong> capability to adsorb in different ways, but also may re-<br />
configure already adsorbed <strong>NOx</strong>.<br />
Absorbance<br />
1.6<br />
1.4<br />
1.2<br />
1.0<br />
0.8<br />
0.6<br />
0.4<br />
0.2<br />
1800<br />
500 °C<br />
401 °C<br />
301 °C<br />
212 °C<br />
155 °C<br />
1600<br />
Wavenumber [cm -1 ]<br />
Figure 16. DRIFT spectra recorded during cool down <strong>of</strong> non-impregnated sample after TPD. Both<br />
TPD and cool down was performed in 10% O2 in Ar.<br />
During the TPD from 30 °C to 500 °C a significant change in the adsorbed species was observed on<br />
the K2O impregnated sample. This is illustrated in Figure 17 where the entire spectra recorded in<br />
41<br />
1400<br />
1200<br />
the beginning (30 °C) and in the end (500 °C) <strong>of</strong> the TPD are shown.
4 DRIFT study <strong>of</strong> <strong>NOx</strong> adsorption on CGO10 impregnated with K2O or BaO<br />
Absorbance<br />
1.6<br />
1.4<br />
1.2<br />
1.0<br />
0.8<br />
0.6<br />
0.4<br />
0.2<br />
0.0<br />
3000<br />
30 °C<br />
500 °C<br />
2500<br />
2000<br />
Wavenumber [cm -1 ]<br />
Figure 17. DRIFT spectra recorded on the K2O impregnated sample at the beginning <strong>of</strong> the TPD (30<br />
°C) and at the end (500 °C).<br />
In order to identify any tendencies during the TPD the peak areas were fitted with the Bio-Rad<br />
Win-IR Pro s<strong>of</strong>tware. The result from fitting the dominant peaks at different temperatures is<br />
shown in Figure 18. Three peaks are increasing in size with increasing temperature, namely the<br />
peaks located around 2384 cm -1 , 2054 cm -1 and 1288. The two first peaks likely correspond to<br />
peaks observed for KNO3 by Williamson et al. at 2390 cm -1 and 2050 cm -1 139 . The peak at 1288 cm -1<br />
could be related to chelating NO2 - , as a peak ascribed to this specie had been observed in several<br />
studies at 1270-1290 cm -1 114-117, 129, 134 . This peak was also observed at 500 °C on the non-<br />
impregnated CGO sample treated in 1000 ppm NO + 10% O2. The peak located at 1382 cm -1 is<br />
either decreasing in size or remaining constant until 180 °C, whereafter it no longer is discernible.<br />
Just as the two growing peaks observed at 2384 cm -1 and 2054 cm -1 , the peak at 1382 cm -1 is likely<br />
ascribed to KNO3, even though it seems to be a contradiction that the two first peaks are growing<br />
with temperature whereas the last one is decreasing in size. The explanation is likely the peak at<br />
1382 cm -1 is located in a region where different oxygenated carbon species also are absorbing in<br />
the spectra 125 , and the change in these specie’s corresponding IR-signal may interfere with the<br />
KNO3 peak at 1382 cm -1 . At 1619 cm -1 a peak which shows a consistent decrease with temperature<br />
is observed, until the peak disappears near 400 °C. The peak is located slightly above 1605 cm -1<br />
where Busca et al. 126 identified a peak ascribed to adsorbed NO2, and slightly below 1630 cm -1 ,<br />
42<br />
1500<br />
1000
4 DRIFT study <strong>of</strong> <strong>NOx</strong> adsorption on CGO10 impregnated with K2O or BaO<br />
where Adelman et al. 132 and Delahay et al. 133 identified a peak which was ascribed to N-bound<br />
NO2. In conclusion the 1619 cm -1 peak is likely ascribed to an adsorbed NO2 specie, which is<br />
removed with increasing temperature, likely because the NO2 is moving to K-sites and adsorbed as<br />
KNO3, since the peaks related to this compound are increasing with temperature. Finally, three<br />
negative peaks are also appearing during the TPD, namely at 1882 cm -1 , 1766 cm -1 and 1517 cm -1 .<br />
The negative peak at 1517 cm -1 is likely ascribed to removal <strong>of</strong> a NO3 - -species 126, 127 . For the two<br />
negative peaks at 1882 cm -1 and 1766 cm -1 they are suggested to belong to the same species, the<br />
(NO)2 dimer, as the frequencies <strong>of</strong> this dimer are 1862 cm -1 and 1768 cm -1 140 .<br />
Peak area<br />
30<br />
25<br />
20<br />
15<br />
10<br />
5<br />
2384 cm -1<br />
2054 cm -1<br />
1619 cm -1<br />
1382 cm -1<br />
1288 cm -1<br />
0<br />
0 100 200 300 400 500<br />
Temp. [°C]<br />
Figure 18. Development <strong>of</strong> the peak area during TPD on the K2O impregnated sample. The graph<br />
shows the development in the major peaks located at wavenumbers 2384 cm -1 , 2054 cm -1 , 1619<br />
cm -1 , 1382 cm -1 and 1288 cm -1 . Lines are for visual guidance only.<br />
Overall with increasing temperature there seem to be a change from adsorbed NO2 and NO3 - on<br />
the CGO surface to NO3 - adsorbed on KNO3 and also chelating NO2 - . Since the sample was not<br />
supplied with NO during the temperature increase this shows that the adsorbed <strong>NOx</strong> species on<br />
the catalyst surface are mobile, and also a change in the preferred/most favorable adsorption<br />
mode with temperature.<br />
43
4 DRIFT study <strong>of</strong> <strong>NOx</strong> adsorption on CGO10 impregnated with K2O or BaO<br />
As previously described redistribution <strong>of</strong> the adsorbed NO was observed on the non-impregnated<br />
sample during cooling down. Similarly redistribution <strong>of</strong> the adsorbed <strong>NOx</strong>-species is observed on<br />
the BaO impregnated sample, not during the cool down step, but during the TPD while the sample<br />
was kept in 10% O2. This is illustrated in Figure 19 which shows the spectrum recorded at 30 °C at<br />
the very beginning <strong>of</strong> the TPD and the spectrum recorded when the sample had reached 300 °C. In<br />
the range between 1700 cm -1 and 1200 cm -1 the peaks disappearing or decreasing in size are<br />
ascribed to adsorbed NO2 (1607 cm -1 ) 126 NO2 - (1329 cm -1 ) 128 and chelating NO2 - (1276 cm -1 ) 114-117,<br />
129, 134 , and the peaks remaining and eventually increasing in size (1420 cm -1 , 1358 cm -1 , 1250 cm -1 )<br />
are ascribed to Ba(NO3)2 70, 120, 138 or just NO3 - adsorbed directly on the CGO (1573 cm -1 ) 116, 126, 127 .<br />
The peak at 1573 cm -1 is assigned to NO3 - adsorbed directly on the CGO since a peak at exactly the<br />
same position was observed during the experiments on the non-impregnated CGO sample. It<br />
should also be noted that the peak at 1250 cm -1 could be ascribed to Ba(NO3)2 but possibly also to<br />
NO3 - 135 or chelating NO2 - 128 bound directly to the CGO; as a peak at 1250 cm -1 also was observed<br />
on the non-impregnated CGO sample.<br />
Absorbance<br />
0.8<br />
0.6<br />
0.4<br />
0.2<br />
0.0<br />
1800<br />
300 °C<br />
30 °C<br />
1600<br />
Wavenumber [cm -1 ]<br />
Figure 19. Spectra recorded at the beginning <strong>of</strong> the TPD (30 °C) and during the TPD (300 °C).<br />
Before the heating ramp was started (15 °C/min in 10% O2) the sample was first treated at 30 °C<br />
44<br />
1400<br />
1200<br />
for ½ h in 1000 ppm NO + 10% O2 and subsequent flushed ½ h in 10% O2.
4 DRIFT study <strong>of</strong> <strong>NOx</strong> adsorption on CGO10 impregnated with K2O or BaO<br />
4.4.5 <strong>NOx</strong> adsorption properties and electrochemical de<strong>NOx</strong><br />
One <strong>of</strong> the intentions in this work is to relate the adsorption studies on CGO to findings on<br />
electrochemical removal <strong>of</strong> <strong>NOx</strong>. Three <strong>of</strong> the main findings from the conversion studies on<br />
electrochemical cells are 39, 44, 113, 141 :<br />
• The highest <strong>NOx</strong> conversion is found in NO atmospheres without presence <strong>of</strong> O2 on both<br />
non-impregnated and impregnated electrodes.<br />
• On non-impregnated electrodes the conversion increases with temperature, but the<br />
selectivity/current efficiency decreases.<br />
• Addition <strong>of</strong> a <strong>NOx</strong> storage compound significantly increases the <strong>NOx</strong> conversion and<br />
current efficiency at lower temperatures.<br />
The DRIFT spectra recorded on the non-impregnated CGO sample showed the largest <strong>NOx</strong><br />
adsorption in O2 containing atmospheres at the lowest temperatures (300 °C), and vice versa the<br />
smallest <strong>NOx</strong> adsorption at the highest temperature (500 °C) without O2 present. This is at first<br />
sight in contradiction to finding 1) and 2) listed above, where the largest conversion is found at<br />
500 °C without O2 present. Part <strong>of</strong> the explanation <strong>of</strong> this apparent contradiction could be the<br />
presence <strong>of</strong> the perovskite (LSM/LSF) in the electrodes during the conversion/polarisation<br />
experiments. Liu et al. 142 measured increased <strong>NOx</strong> adsorption on a La-perovskite with increasing<br />
temperature, which is more consistent with the highest <strong>NOx</strong> conversion found at the highest<br />
temperature. This illustrates the importance <strong>of</strong> taking both the adsorption properties <strong>of</strong> the<br />
perovskite and the CGO into consideration, when comparing to measurements on composite<br />
electrodes. With respect to the importance <strong>of</strong> O2 for the <strong>NOx</strong> adsorption the results from DRIFT<br />
spectroscopy in different atmospheres (1000 ppm NO, 1000 ppm NO + 10% O2, 1000 ppm NO2 and<br />
1000 NO2 + 10% O2) show the presence <strong>of</strong> either O2 together with NO or just the presence NO2<br />
dramatically increases <strong>NOx</strong> adsorption on CGO. For the perovskites the results by Klingenberg et<br />
al. 143 show that NO is adsorbed on La2O3 at 500 °C without the presence <strong>of</strong> O2. Werchmeister et al.<br />
previously identified NO2 as an important reaction intermediate during electrochemical <strong>reduction</strong><br />
<strong>of</strong> <strong>NOx</strong> 36, 38 . With the results from the DRIFT spectroscopy in mind, it is suggested that the NO2 is<br />
an important intermediate, as NO2 adsorbs much more readily on the electrode surface, even<br />
though it may not be crucial for the <strong>NOx</strong> adsorption on the perovskite.<br />
45
4 DRIFT study <strong>of</strong> <strong>NOx</strong> adsorption on CGO10 impregnated with K2O or BaO<br />
With respect to finding 2): the highest selectivity for <strong>NOx</strong> conversion being found at the lowest<br />
temperatures, this finding may be explained by the adsorption properties found for CGO. There<br />
are at least two potential ways <strong>of</strong> explaining the higher selectivity. One explanation could be that<br />
the higher <strong>NOx</strong> adsorption-ability <strong>of</strong> the CGO at lower temperatures simply hinders the O2<br />
accessibility to the CGO surface, and thereby increases the selectivity <strong>of</strong> the electrodes. Another<br />
explanation could be the larger amount <strong>of</strong> adsorbed <strong>NOx</strong> at low temperatures on CGO in the<br />
vicinity <strong>of</strong> the perovskite, which makes it easier for the <strong>NOx</strong> to react at the perovskite or at the<br />
CGO-perovskite interface, at the temperatures where the adsorption capabilities <strong>of</strong> the perovskite<br />
is low.<br />
As mentioned in finding 3) a significant improvement <strong>of</strong> the <strong>NOx</strong> conversion and the current<br />
efficiency was found for the impregnated samples. The DRIFT spectroscopy clearly shows that<br />
impregnation with K2O and BaO strongly affects the <strong>NOx</strong> adsorption on CGO; this is observed even<br />
though the impregnated mass is only 3 wt% (K2O) or 1 wt% (BaO) <strong>of</strong> the total sample mass. For<br />
this reason it seems likely that increased <strong>NOx</strong> adsorption indeed is one <strong>of</strong> the reasons why<br />
impregnation with <strong>NOx</strong>-storage compounds increases the conversion on composite electrodes<br />
during electrochemical de<strong>NOx</strong>.<br />
Moreover an interesting finding from the TPD measurements was that the adsorbed <strong>NOx</strong> was able<br />
to change adsorption state with changing temperature, and also capable <strong>of</strong> moving between CGO-<br />
adsorption sites and K- or Ba-adsorption sites. Mobility <strong>of</strong> the adsorbed <strong>NOx</strong> on the electrode<br />
surface is crucial, as the reactive zone <strong>of</strong> the electrodes is at the triple-phase boundary, and<br />
movement <strong>of</strong> the <strong>NOx</strong> to the triple-phase boundary likely is a necessity for the <strong>NOx</strong>-<strong>reduction</strong> to<br />
occur.<br />
46
4.5 Conclusions<br />
4 DRIFT study <strong>of</strong> <strong>NOx</strong> adsorption on CGO10 impregnated with K2O or BaO<br />
From the results presented the following conclusions can be drawn:<br />
• on CGO treated in 1000 ppm NO + 10% O2 the variety <strong>of</strong> adsorbed <strong>NOx</strong> species decreases<br />
from 300 °C to 500 °C, at 500 °C the dominant species are adsorbed NO3 - and NO2 - .<br />
• <strong>NOx</strong> adsorbtion on CGO is significantly larger in the presence <strong>of</strong> either NO + O2 or NO2<br />
compared to when only NO is present.<br />
• when <strong>NOx</strong> conversion measurements on the composite electrodes are related to <strong>NOx</strong><br />
adsorption, both the <strong>NOx</strong> adsorption properties <strong>of</strong> the oxygen-ion conducting CGO and the<br />
electron conducting perovskite must be considered,<br />
• higher <strong>NOx</strong> selectivity observed during conversion measurements at low temperature may<br />
be explained by the increased <strong>NOx</strong> adsorption on CGO at low temperatures.<br />
• impregnation with K2O or BaO significantly alters the <strong>NOx</strong> adsorption on CGO<br />
• the adsorbed <strong>NOx</strong> species are mobile on the surface <strong>of</strong> impregnated CGO<br />
4.6 Acknowledgement<br />
This work was supported by the Danish Strategic Research Council under contract no. 09-065183.<br />
The DRIFT work presented was conducted at Competence Centre for Catalysis (KCK), which is<br />
financially supported by Chalmers University <strong>of</strong> Technology, the Swedish Energy Agency and the<br />
member companies: AB Volvo, Volvo Car Corporation AB, Scania CV AB, Saab Automobile<br />
Powertrain AB, Haldor Topsø A/S and ECAPS AB. The stay at KCK was facilitated by Pr<strong>of</strong>essor<br />
Anders Palmqvist, who is acknowledged for his great help in making this possible.<br />
47
5 Improvement <strong>of</strong> LSM15-CGO10 electrodes for electrochemical removal <strong>of</strong> <strong>NOx</strong> by KNO3 and<br />
MnOx impregnation<br />
5 Improvement <strong>of</strong> LSM15-CGO10 electrodes for electrochemical removal<br />
<strong>of</strong> <strong>NOx</strong> by KNO3 and MnOx impregnation<br />
This chapter is the manuscript “Improvement <strong>of</strong> LSM15-CGO10 Electrodes for <strong>Electrochemical</strong><br />
Removal <strong>of</strong> <strong>NOx</strong> by KNO3 and MnOx Impregnation” accepted for publication in Journal <strong>of</strong> The<br />
<strong>Electrochemical</strong> Society.<br />
5.1 Abstract<br />
LSM15-CGO10 (La0.85Sr0.15MnO3-Ce0.90Gd0.1O1.95) electrodes were impregnated with either KNO3 or<br />
MnOx, and the effect <strong>of</strong> the impregnations on the activity in NO containing atmospheres was<br />
investigated by electrochemical impedance spectroscopy and cyclic voltammetry. The electrodes<br />
were tested in 1000 ppm NO, 10% O2 and 1000 ppm NO + 10% O2 in the temperature range 300-<br />
500 °C and the electrodes were investigated by scanning electron microscopy before and after<br />
testing. At 400-450 °C a <strong>NOx</strong>-storage process was observed on the KNO3-impregnated electrodes,<br />
this process appeared to be dependent on preceding catalytically formation <strong>of</strong> NO2. Despite a<br />
marked difference in the microstructure <strong>of</strong> the impregnated KNO3 and MnOx, both impregnations<br />
caused a significant <strong>reduction</strong> in the polarisation resistance <strong>of</strong> the electrodes, due to a general<br />
decrease in resistance <strong>of</strong> all the identified electrode processes. The effect <strong>of</strong> the impregnation was<br />
strongest at low temperatures, likely because the microstructure <strong>of</strong> the impregnated compounds<br />
changed at higher temperatures. Scanning electron microscopy images revealed a significant<br />
change in the microstructure <strong>of</strong> the impregnated samples after the test.<br />
5.2 Introduction<br />
Air pollution from road traffic has due to the harmful effects on human health and environment<br />
got more and more attention during the last decades. In order to reduce air pollution, restrictions<br />
has been imposed on the emissions from vehicles, which on European level has been done by the<br />
introduction <strong>of</strong> the Euro I-VI standards. These standards impose increasing restrictions on the<br />
emission <strong>of</strong> CO, <strong>NOx</strong>, hydrocarbons and particulate matter 12 .<br />
The increased restrictions on <strong>NOx</strong> emissions are adopted, as <strong>NOx</strong> has a negative impact on the<br />
respiratory system, increase the formation <strong>of</strong> ozone at ground level, cause formation <strong>of</strong> acid rain<br />
and also act as green house gas 11 . To reduce the <strong>NOx</strong> emission from vehicles several technologies<br />
48
5 Improvement <strong>of</strong> LSM15-CGO10 electrodes for electrochemical removal <strong>of</strong> <strong>NOx</strong> by KNO3 and<br />
MnOx impregnation<br />
have been developed, for <strong>NOx</strong>-removal under lean conditions (i.e. in excess <strong>of</strong> oxygen) the three<br />
most known technologies are selective catalytic <strong>reduction</strong> with urea (urea-SCR), selective catalytic<br />
<strong>reduction</strong> with hydrocarbons (HC-SCR) and the <strong>NOx</strong>-storage and <strong>reduction</strong> (NSR) catalyst 108 .<br />
An alternative way to remove <strong>NOx</strong> under lean conditions is the electrochemical removal <strong>of</strong> <strong>NOx</strong>,<br />
which was first suggested by Pancharatnam et al. 22 . Since then several investigations has been<br />
made <strong>of</strong> electrochemical removal <strong>of</strong> <strong>NOx</strong> 29, 30, 34, 36, 44, 144 . A general challenge in electrochemical<br />
removal <strong>of</strong> <strong>NOx</strong> is to find electrodes, which both have a sufficient activity and show a high<br />
selectivity for <strong>NOx</strong> <strong>reduction</strong> compared to <strong>reduction</strong> <strong>of</strong> O2 4 . For this reason the aim in this work is<br />
to investigate if the activity and selectivity <strong>of</strong> LSM15-CGO10 electrodes towards <strong>NOx</strong> can be<br />
improved by impregnating the electrodes with either KNO3 or MnOx.<br />
KNO3 is chosen for the impregnation, since K2O/KNO3 has shown potential as a <strong>NOx</strong>-storage<br />
compound in nitrogen storage and <strong>reduction</strong> catalysts 72, 73, 145, 146 , and for this reason is expected to<br />
improve selectivity and activity for <strong>NOx</strong> <strong>reduction</strong> on the LSM15-CGO10 electrodes.<br />
Just as KNO3, MnOx is also reported to have capability to store <strong>NOx</strong> 77 and may for the same reasons<br />
improve the <strong>NOx</strong> <strong>reduction</strong> selectivity and activity. Moreover, impregnated MnOx may increase the<br />
general activity <strong>of</strong> the LSM/CGO electrode, as nano-sized MnOx-particles may extend the triple-<br />
phase-boundary, and an extension <strong>of</strong> the triple-phase boundary in the literature is considered to<br />
be one <strong>of</strong> the important effects <strong>of</strong> electrode impregnation 147-149 . An increased activity with<br />
impregnation with MnOx is expected, since Mn can exist in a number <strong>of</strong> oxidation states, and for<br />
this reason is the redox active center in perovskites used for redox catalysis 78 and also has been<br />
proven to affect the oxygen <strong>reduction</strong> reaction on electrodes 79 .<br />
In the present work symmetric cells with LSM15-CGO10 ((La0.85Sr0.15)0.99MnO3+δ-Ce0.9Gd0.1O1.95)<br />
composite electrodes were prepared. LSM was chosen for this work due to the good stability <strong>of</strong><br />
this perovskite compared to other perovskites like La1-xSrxFe1-yCoyO3 and Ba1-xSrxFe1-yCoyO3,<br />
eventhough these have a higher activity in the investigated temperature range 62 . The cells were<br />
after the preparation divided into three groups and treated in three different ways: one group was<br />
impregnated with KNO3, one group was impregnated with MnO and one group was left without<br />
any impregnation. The cells were following tested with electrochemical impedance spectroscopy<br />
49
5 Improvement <strong>of</strong> LSM15-CGO10 electrodes for electrochemical removal <strong>of</strong> <strong>NOx</strong> by KNO3 and<br />
MnOx impregnation<br />
and cyclic voltammetry. In addition to this cells from each <strong>of</strong> the three groups were investigated<br />
by scanning electron microscopy before and after testing.<br />
5.2.1 Conductivity <strong>of</strong> KNO3 and MnOx compared to electrode materials<br />
A point which must be considered is the conductivity <strong>of</strong> the impregnated materials, as an<br />
impregnated phase with conductivity much higher than the electrode materials could significantly<br />
alter the current distribution in the electrode. In the temperature range 350 °C – 500 °C the<br />
conductivity <strong>of</strong> KNO3 increases from 0.669 S/cm to 1.094 S/cm 100 . No information has so far been<br />
found concerning the conductivity <strong>of</strong> MnOx at 300 °C – 500 °C, but MnO2 is reported to have<br />
electronic conductivities in the range 5x10 -7 -3x10 -3 S/cm 2 at room temperature, the large range <strong>of</strong><br />
the conductivities being due to a strong dependence on the crystallographic form <strong>of</strong> MnO2 102 .<br />
Since MnO2 is a semiconductor the conductivity will increase with increasing temperature. The<br />
electronic conductivity <strong>of</strong> LSM16/LSM20 is reported to be in the range 90-110 S/cm at 300-600<br />
°C 52,53 and for CGO10 the total conductivity at 500 °C is 0.005 S/cm 99 . By comparing the<br />
conductivities <strong>of</strong> the impregnated compounds to the conductivities <strong>of</strong> the electrode materials it is<br />
clear the highest electronic conductivity will be found in the LSM15. For this reason the current<br />
distribution in the electrode is not expected to change due to the introduction <strong>of</strong> an “easier”<br />
current pathway in the electrode by the impregnation.<br />
5.3 Experimental<br />
5.3.1 Cell preparation<br />
The LSM15 used for the electrodes was prepared by the glycine-nitrate combustion synthesis 150<br />
with a molar ratio <strong>of</strong> 0.548 glycin/nitrate. The nitrates used for the synthesis were all from Alfa<br />
Aesar. The LSM was synthesized as (La0.85Sr0.15)0.99MnO3, i.e. as being slightly deficient on the A-<br />
site. After the synthesis the LSM powder was calcined at 1000 °C for 6 hours, and subsequent the<br />
phase-purity <strong>of</strong> the powder was confirmed by XRD on a theta/theta Stoe diffractometer. The<br />
CGO10 powder used for the electrodes was supplied by Rhodia and had a BET area <strong>of</strong> 7.29 m 2 /g.<br />
The symmetric cells were manufactured by screen-printing a terpineol based LSM15-CGO10 paste<br />
on 200 μm thick CGO10 tapes from Kerafol. The ratio between LSM15 and the CGO10 in the<br />
screen-printing paste was 50 wt% LSM15/50 wt% CGO10, and before mixing d50 was ≈1 μm for<br />
LSM15 and ≈0.5 μm for CGO10. After screen-printing the 50 x 50 mm 2 cells were sintered at 1050<br />
50
5 Improvement <strong>of</strong> LSM15-CGO10 electrodes for electrochemical removal <strong>of</strong> <strong>NOx</strong> by KNO3 and<br />
MnOx impregnation<br />
°C for 2 h. The cells were after the sintering cut into small 6 x 6 mm 2 cells with a diamond toll.<br />
Finally a gold current collector was applied on the cells by painting the cells with a gold paste<br />
containing 20 wt% graphite. The cells were then heated to 800 °C in order to burn away the<br />
graphite, leaving behind a porous, electronic conductive gold current collector on top <strong>of</strong> the<br />
electrodes.<br />
For the impregnation with KNO3 an aqueous solution containing 1.7 M KNO3 and Triton-X45<br />
surfactant was prepared. The concentration <strong>of</strong> Triton-X45 was 1 wt% with respect to the water.<br />
For the impregnation with Mn(NO3)x a purely aqueous solution with 1.7 M Mn(NO3)x was used. The<br />
impregnation was made by soaking the cells in the impregnation solution in a small beaker, which<br />
was placed in a vacuum chamber. The vacuum chamber was for less than a minute evacuated to a<br />
pressure below 0.1 mbar. After the impregnation the cells were heated in a furnace to 350 °C for<br />
one hour in order to:<br />
1) Decompose the Triton-X45<br />
2) Decompose the Mn(NO3)x into MnOx 103 .<br />
In addition to this the KNO3 would melt during the heat treatment (mp(KNO3)=334 °C 97 ), and for<br />
this reason probably redistribute in the electrode. The impregnation procedure just described was<br />
repeated twice for both the KNO3 and the Mn(NO3)x impregnation.<br />
5.3.2 <strong>Electrochemical</strong> characterization<br />
For the electrochemical cell testing a four sample set-up was used in which each <strong>of</strong> the four cells<br />
was fixed between two gold meshes, which also acted as current collectors. The set-up was placed<br />
in a furnace, sealed and attached to the gas supply system. Before the set-up was heated a leak<br />
test was made.<br />
During the cell test electrochemical impedance spectra (EIS) and cyclic voltammograms (CVs) were<br />
recorded in each <strong>of</strong> the three atmospheres: (1) 1000 ppm NO in Ar, (2) 10% O2 in Ar and (3) 1000<br />
ppm NO + 10% O2 with balance Ar. These concentrations <strong>of</strong> NO and O2 were chosen as they<br />
resemble the concentrations which may be found in the exhaust from a diesel car 7 . The EIS and<br />
CVs were recorded in the temperature range 300-500 °C, as this is the temperature range<br />
expected for diesel car exhaust 151 . The measurements were made with 50 °C intervals, starting<br />
51
5 Improvement <strong>of</strong> LSM15-CGO10 electrodes for electrochemical removal <strong>of</strong> <strong>NOx</strong> by KNO3 and<br />
MnOx impregnation<br />
from 300 °C and going to higher temperatures. At 500 °C flow variations were made by changing<br />
the flow from 100 ml/min to 50 ml/min in all three atmospheres. In addition to this variations in<br />
the NO concentration and O2 concentration were made, but only for the cells without<br />
impregnation. After the measurements at 500 °C the temperature was decreased to 300 °C, and<br />
EIS were recorded once again in 1000 ppm NO + 10% O2 to estimate the change during the cell<br />
test, before the furnace finally was cooled down. In general the EIS were recorded in the<br />
frequency range 1 MHz-0.0008 Hz with 6 points pr. decade and 36 mV rms amplitude, a few<br />
spectra were however recorded with a slightly different low frequency limit. The cyclic<br />
voltammograms were recorded between the voltage limits ±1V with scan rate 10 mV/s, step size 5<br />
mV and 4 scans recorded for each measurement. Both the EIS and CV were recorded with a Gamry<br />
Reference 600 potentiostat.<br />
It should be noted only in the test on LSM15-CGO10 cells without impregnation 4 cells were<br />
subjected to electrochemical cell testing (EIS and CVs), whereas in the two tests on impregnated<br />
cells only 3 cells were tested in each test. The fourth cell in the set-up in these two tests was not<br />
subjected to the electrochemical cell testing but experienced the exactly same temperature pr<strong>of</strong>ile<br />
as the three electrochemically tested cells, and was later investigated in the scanning electron<br />
microscopy to observe the effect <strong>of</strong> the temperature on the microstructure.<br />
5.3.3 Scanning Electron Microscopy<br />
Tested and non-tested cells were investigated in a Zeiss Supra 35 scanning electron microscope. In<br />
order to be able to observe structures smaller than 200 nm, the cells were broken manually and<br />
the cross-section was investigated directly in the microscope without application <strong>of</strong> any coating. In<br />
order to ensure a high resolution most <strong>of</strong> the images were recorded with the in-lens detector and<br />
low accelerating voltage (3kV).<br />
5.4 Results<br />
5.4.1 Impregnation<br />
The cells were weighed before and after impregnation to determine the impregnation load on the<br />
tested cells. For the cells impregnated with KNO3 the final load was 0.3 ±0.1 wt% for three <strong>of</strong> the<br />
cells, whereas the last cell apparently lost weight during the impregnation. For the cells<br />
impregnated with MnOx the final load was 0.5 ±0.2 wt%.<br />
52
5 Improvement <strong>of</strong> LSM15-CGO10 electrodes for electrochemical removal <strong>of</strong> <strong>NOx</strong> by KNO3 and<br />
MnOx impregnation<br />
5.4.2 Cyclic voltammetry<br />
For the 3-4 cells tested in each test good reproducibility is observed for cyclic voltammograms<br />
recorded at the same conditions within each test, both with respect to shape <strong>of</strong> the cyclic<br />
voltammogram and current densities. A general feature <strong>of</strong> the cyclic voltammograms recorded on<br />
both blank and impregnated cells is their shape depend on the atmosphere as illustrated in Figure<br />
20 for the blank cells. Clear peaks were only observed on the CVs recorded in 1000 ppm NO at<br />
400 and 450 °C on the KNO3 impregnated sample, see Figure 21 where a comparison is made to a<br />
CV recorded on one <strong>of</strong> the blank cells.<br />
Figure 20. Cyclic voltammograms recorded on a blank LSM15-CGO10 symmetric cell in different<br />
atmospheres at 400 °C.<br />
Figure 21. Cyclic voltammograms recorded at 450 °C in 1000 ppm NO on a LSM15-CGO10 cell<br />
without impregnation and impregnated with KNO3.<br />
53
5 Improvement <strong>of</strong> LSM15-CGO10 electrodes for electrochemical removal <strong>of</strong> <strong>NOx</strong> by KNO3 and<br />
MnOx impregnation<br />
From the cyclic voltammograms recorded in 1000 ppm NO + 10% O2 the current densities at 0.9 V<br />
was found for the three tests, the result is shown in Table 6; where the stated values are the<br />
averages from the 3-4 tested cells at both negative and positive polarisation. As the result for one<br />
<strong>of</strong> the cells impregnated with MnOx deviates from the two other cells the values are stated<br />
separately in Table 6. In general the largest current densities are observed for impregnated<br />
samples, with the difference between the impregnated and the blank samples being most<br />
pronounced at low temperatures.<br />
Table 6. Current densities in mA/cm 2 observed at the cyclic voltammograms (2. scan) at 0.9 V<br />
polarisation in 1000 ppm NO + 10% O2 on blank, KNO3 and MnOx impregnated LSM15-CGO10<br />
symmetric cells. The numbers stated in the parenthesis are the uncertainties.<br />
5.4.3 Fitting procedure<br />
Temp. Blank KNO3 MnOx<br />
[°C]<br />
Cell A and C Cell D<br />
300 0.46(0.04) 0.6 (0.03) 3.03(0.06) 2.8(0.1)<br />
350 1.2(0.1) 3(0.1) 7(1) 7.6(0.4)<br />
400 4.2(0.3) 9(0.4) 12(3) 15.2(0.8)<br />
450 10.3(0.5) 18(3) 12(3) 25(1)<br />
500 27(1) 30(1) 13(3) 63(5)<br />
For fitting <strong>of</strong> the impedance spectra the program ZView 2, version 3.1c was used 107 . An equivalent<br />
circuit was used which contained a serial resistance Rs and a number <strong>of</strong> RQ subcircuits, where a<br />
resistance (R) is in parallel with a constant phase element (Q). The admittance <strong>of</strong> the constant<br />
phase element may be written as 152<br />
Y )<br />
n<br />
= Y0<br />
( jω<br />
5.1<br />
- where Y is the admittance, Y0 is the amplitude <strong>of</strong> the constant phase element admittance, j is the<br />
imaginary number, ω is the angular frequency and n is the frequency exponent <strong>of</strong> the constant<br />
phase element. For the physical interpretation <strong>of</strong> the constant phase element, the near-equivalent<br />
capacitance (Cω) was calculated according to the formula 153<br />
( 1−n)<br />
n 1/<br />
n<br />
Y0<br />
Cω<br />
= R<br />
5.2<br />
54
5 Improvement <strong>of</strong> LSM15-CGO10 electrodes for electrochemical removal <strong>of</strong> <strong>NOx</strong> by KNO3 and<br />
MnOx impregnation<br />
All impedance spectra were fitted with one serial resistance and between 2 and 4 RQ-subcircuits.<br />
The fitting process consisted <strong>of</strong> two sessions: During the first session all the resistances and<br />
parameters for the constant phase elements were allowed to adjust during the fitting <strong>of</strong> a total<br />
number <strong>of</strong> at least 40 impedance spectra for each test. After this first session identical processes<br />
were identified by comparing the characteristic frequencies, Cω and the n-values, and the average<br />
n-value was calculated for each <strong>of</strong> the identified processes. During the second session the<br />
impedance spectra were fitted once again, with the n-values fixed at the average values.<br />
5.4.4 Conductivity<br />
The average serial resistance <strong>of</strong> the cells was found for each test and converted to conductivities.<br />
The conductivities are stated in Figure 22 together with literature data for the conductivity <strong>of</strong> CGO<br />
calculated from the results found by Omar et al. 154 .<br />
Figure 22. Conductivity <strong>of</strong> the three tests with LSM15-CGO10 electrodes on CGO electrolyte<br />
compared to literature values for the conductivity <strong>of</strong> CGO.<br />
In general fairly good agreement is achieved between conductivities <strong>of</strong> the blank cells and the<br />
KNO3-impregnated cells compared to the conductivity <strong>of</strong> CGO reported in the literature, but<br />
especially at higher temperatures the conductivity <strong>of</strong> the blank sample is higher. The conductivity<br />
<strong>of</strong> the MnOx-impregnated samples follow the conductivity <strong>of</strong> the other samples until 400 °C,<br />
whereafter the conductivity start to decrease even though the temperature increases.<br />
55
5 Improvement <strong>of</strong> LSM15-CGO10 electrodes for electrochemical removal <strong>of</strong> <strong>NOx</strong> by KNO3 and<br />
MnOx impregnation<br />
5.4.5 Polarisation resistance<br />
When comparing the size <strong>of</strong> the polarisation resistances between the three tests, see Table 7, the<br />
polarisation resistance <strong>of</strong> both the impregnated samples is below the polarisation resistance <strong>of</strong> the<br />
blank samples in the temperature range 300-450 °C. At 500 °C the impregnated samples still have<br />
a lower polarisation resistance compared to the blank samples in 1000 ppm NO, but in 10% O2 and<br />
1000 ppm NO + 10% O2 the polarisation resistance is either equal to or slightly larger for the<br />
impregnated samples. In all the three tests the polarisation resistance depends strongly on the<br />
atmosphere. Independent <strong>of</strong> whether the cells are impregnated or not the lowest polarisation<br />
resistance is at all temperatures found in 1000 ppm NO + 10% O2. The highest polarisation<br />
resistance is below 400 °C found in 10% O2, and above 400 °C in 1000 ppm NO. For the blank cell<br />
stack the polarisation resistance consistently decreased with increasing temperature, whereas for<br />
the KNO3-impregnated samples an increase in the polarisation resistance was observed from 450<br />
°C to 500 °C in 1000 ppm NO and 10% O2, and for the MnOx-impregnated cell an increase was<br />
observed from 400 to 450 °C in all atmospheres.<br />
Table 7. Average polarisation resistances in 1000 ppm NO, 10% O2 and 1000 ppm NO + 10% O2<br />
obtained for symmetric LSM15-CGO10 cells without impregnation (labelled “blank”) with KNO3<br />
impregnation and with MnOx-impregnation. The values are stated in Ωcm 2 .<br />
1000 pppm NO 10% O2 1000 ppm NO + 10% O2<br />
Temp. [°C] Blank KNO3 MnOx Blank KNO3 MnOx Blank KNO3 MnOx<br />
300 1.0·10 4 4.1·10 3 1.1·10 3 1.8·10 5 7.8·10 4 4.2·10 3 7.6·10 3 3.2·10 3 7.6·10 2<br />
350 4.2·10 3 1.4·10 3 4.5·10 2 3.1·10 4 5.1·10 3 1.2·10 3 2.2·10 3 9.9·10 2 3.5·10 2<br />
400 2.9·10 3 9.7·10 2 2.4·10 2 5.8·10 3 1.1·10 3 4.3·10 2 7.8·10 2 5.1·10 2 2.2·10 2<br />
450 2.0·10 3 6.0·10 2 1.1·10 3 1.2·10 3 2.1·10 2 4.6·10 2 3.1·10 2 2.7·10 2 2.3·10 2<br />
500 1.3·10 3 9.4·10 2 9.0·10 2 2.6·10 2 2.6·10 2 3.2·10 2 1.2·10 2 1.4·10 2 1.8·10 2<br />
5.4.6 Characteristics <strong>of</strong> processes/arcs<br />
All the impedance spectra were fitted with 2-4 RQ subcircuits. In Figure 23 to Figure 25<br />
representative examples from the fitting <strong>of</strong> the impedance spectra are shown, with the arcs used<br />
for the deconvolution <strong>of</strong> the spectra numbered according to the description in the results section.<br />
The shown spectra were recorded at 400 °C in 1000 ppm NO + 10% O2 on cells from each <strong>of</strong> the<br />
three tests: 1) without impregnation; 2) with KNO3 impregnation and 3) with MnOx impregnation.<br />
56
5 Improvement <strong>of</strong> LSM15-CGO10 electrodes for electrochemical removal <strong>of</strong> <strong>NOx</strong> by KNO3 and<br />
MnOx impregnation<br />
In the following sections the results from fitting <strong>of</strong> the impedance spectra recorded during the<br />
three different tests will be described in more detail.<br />
Figure 23. Impedance spectrum recorded on cell without impregnation at 400 °C in 1000 ppm NO<br />
+ 10% O2. The circles represents the experimental values, the full line the total fit and the dashed<br />
lines the arcs used for deconvolution <strong>of</strong> the spectrum. Filled circles mark the stated frequencies.<br />
Figure 24. Impedance spectrum recorded on cell with KNO3 impregnation at 400 °C in 1000 ppm<br />
NO + 10% O2. The circles represents the experimental values, the full line the total fit and the<br />
dashed lines the arcs used for deconvolution <strong>of</strong> the spectrum. Filled circles mark the stated<br />
frequencies.<br />
Figure 25. Impedance spectrum recorded on cell with MnOx impregnation at 400 °C in 1000 ppm<br />
NO + 10% O2. The circles represents the experimental values, the full line the total fit and the<br />
dashed lines the arcs used for deconvolution <strong>of</strong> the spectrum. Filled circles mark the stated<br />
frequencies.<br />
57
5 Improvement <strong>of</strong> LSM15-CGO10 electrodes for electrochemical removal <strong>of</strong> <strong>NOx</strong> by KNO3 and<br />
MnOx impregnation<br />
5.4.6.1 Blank cells<br />
The impedance spectra recorded on the LSM15-CGO10 symmetric cells without impregnation<br />
were all fitted with 4 RQ-subcircuits at 300 °C, and 3 RQ-subcircuits at higher temperatures. Each<br />
RQ-subcircuit corresponds to an arc in the Nyquist plot, and in the following the arcs are<br />
numbered from 1 to 4, with number 1 being the arc observed at the highest frequencies (only<br />
observed at 300 °C), and number 4 being the arc observed at the lowest frequencies. A discussion<br />
<strong>of</strong> how the arcs may relate to different electrode processes will be found in the discussion section.<br />
An overview <strong>of</strong> some characteristics <strong>of</strong> the arcs found during the fitting are stated in Table 8.<br />
Table 8. Characteristics <strong>of</strong> the four arcs/RQ-subcircuits used during fitting <strong>of</strong> the impedance<br />
spectra recorded on symmetric LSM15-CGO10 cells. In the table n-value is the n-value <strong>of</strong> the CPE,<br />
Ea the activation energy, Stdev states the standard deviation <strong>of</strong> Ea and R 2 is the estimate <strong>of</strong> the<br />
linearity between the points used for the calculation <strong>of</strong> Ea.<br />
Results at 300-500 °C<br />
Atm.* Arc Freq. at 300 °C Freq. at 500 °C n-value Ea Stdev R 2<br />
Hz Hz<br />
NO 1 19952<br />
0.90<br />
2 9 137 0.45 0.78 0.02 0.997<br />
3 3 4 0.68 0.69 0.07 0.962<br />
4 0.3 0.08 0.89 ? ? ?<br />
O2 1 18458<br />
0.90<br />
2 7 1049 0.45 0.96 0.05 0.991<br />
3 0.09 20 0.54 0.98 0.05 0.999<br />
4 0.0007 0.8 0.89 1.29 0.05 0.992<br />
NO + O2 1 21745<br />
0.90<br />
2 22 492 0.45 0.74 0.02 0.993<br />
3 5 27 0.69 0.69 0.01 0.972<br />
4 0.8 2 0.89 0.88 0.02 0.984<br />
*The concentrations were 1000 ppm NO, 10% O2 and 1000 ppm NO +10% O2, in all cases with balance Ar.<br />
In the first section <strong>of</strong> Table 8 the characteristic frequency <strong>of</strong> the individual arcs are stated at 300 °C<br />
and 500 °C together with the n-value <strong>of</strong> the constant phase element. With respect to the n-values<br />
it is noted the values were the same for arc 1, 2, and 4 independent <strong>of</strong> the atmosphere, whereas<br />
for arc 3 variation in the n-value was observed between the atmospheres. In the second section<br />
58<br />
eV
5 Improvement <strong>of</strong> LSM15-CGO10 electrodes for electrochemical removal <strong>of</strong> <strong>NOx</strong> by KNO3 and<br />
MnOx impregnation<br />
the activation energy for the process corresponding to each arc is stated together with the<br />
standard deviation and R 2 -value <strong>of</strong> the linear regression, which was used for calculation <strong>of</strong> the<br />
activation energy. In this second section the stated activation energies are calculated from the<br />
results obtained in the entire temperature range from 300-500 °C, which means 5 points are used<br />
for the linear regression. Even though the R 2 -values were close to 1 a small bend at 400 °C was<br />
observed on the Arrhenius plot for arc 3 in 1000 ppm NO and 1000 ppm NO + 10% O2, se Figure 26<br />
for an example. Since this small bend was consistently observed for all 4 cells, it could reflect a<br />
change in the process around 400 °C.<br />
Figure 26. Arrhenius plot <strong>of</strong> the arc 3 resistance in 1000 ppm NO, 10% O2 and 1000 ppm NO + 10%<br />
O2. Note the apparent change in slope in the atmospheres containing NO.<br />
A comparison between the activation energies for arc 2 shows an activation energy <strong>of</strong> 0.78 eV in<br />
1000 ppm NO, which is close to the activation energy observed in 1000 ppm NO + 10% O2, but<br />
deviates from the 0.96 eV activation energy which is observed for process 2 in 10% O2.<br />
Finally, with respect to arc 4, no activation energy could be calculated in 1000 ppm NO, as no<br />
linear Arrhenius plot could be made from the fitting results. This was likely because this low<br />
frequency arc in 1000 ppm NO was distorted by a continued degradation. The activation energy<br />
for arc 4 was in 10% O2 significantly higher when compared to 1000 ppm NO + 10% O2,<br />
independent <strong>of</strong> whether the entire temperature range or only the higher part <strong>of</strong> the temperature<br />
range was considered.<br />
59
5 Improvement <strong>of</strong> LSM15-CGO10 electrodes for electrochemical removal <strong>of</strong> <strong>NOx</strong> by KNO3 and<br />
MnOx impregnation<br />
5.4.6.2 KNO3 impregnated cells<br />
The impedance spectra recorded on the 3 symmetric LSM15-CGO10 cells impregnated with KNO3<br />
could all be fitted with between 2 and 4 RQ-subcircuits. Independent <strong>of</strong> the atmosphere, a small<br />
arc at very high frequencies was observed at 300 and 350 °C on all spectra. In 1000 ppm NO and in<br />
10% O2 two arcs/processes were consistently observed at all temperatures. These two arcs are<br />
named arc 3 and arc 4 in Table 9, but so far in the text it is not considered, whether these arcs<br />
represents the same processes or not in the different atmospheres. In addition to these two arcs<br />
in 1000 ppm NO, one additional smaller arc is observed at 350 °C (arc 2) and in the temperature<br />
range 400-500 °C a quite large arc (arc 5) appear at the lowest frequencies. Due to the limited<br />
temperature range at which arc 2 and arc 5 were observed it was not possible to calculate any<br />
activation energy for these two arcs.<br />
Table 9. Characteristics <strong>of</strong> the arcs/RQ-subcircuits used during fitting <strong>of</strong> the impedance spectra<br />
recorded on symmetric LSM15-CGO10 cells impregnated with KNO3. In the table n-value is the n-<br />
value <strong>of</strong> the CPE, Ea the activation energy and R 2 is the estimate <strong>of</strong> the linearity between the<br />
points used for the calculation <strong>of</strong> Ea.<br />
60<br />
Results at 300-450 °C<br />
Atm.* Arc Freq. at 300 °C Freq. at 500 °C n-value Ea Stdev R<br />
Hz Hz<br />
eV<br />
NO 1 19878<br />
0.82<br />
2<br />
0.83<br />
3 0.5 599 0.59 1.16 0.12 0.977<br />
4 0.05 8 0.76 0.42 0.14 0.984<br />
5<br />
0.10 0.88 ? ? ?<br />
O2 1 21333<br />
0.79<br />
2<br />
0.51<br />
3 0.1 33 0.59 1.16 0.04 0.997<br />
4 0.002 1 0.85 1.40 0.18 0.983<br />
O2 1 17370<br />
0.81<br />
2 47 7670 0.60 1.05 0.07 0.988<br />
3 2 48 0.70 0.76 0.08 0.974<br />
4 0.3 3 0.90 0.52 0.04 0.980<br />
5<br />
0.3 0.97 ? ? ?<br />
*The concentrations were 1000 ppm NO, 10% O2 and 1000 ppm NO +10% O2, in all cases with balance Ar.
5 Improvement <strong>of</strong> LSM15-CGO10 electrodes for electrochemical removal <strong>of</strong> <strong>NOx</strong> by KNO3 and<br />
MnOx impregnation<br />
In addition to the dominating arc 3 and 4 observed in 10% O2, a smaller high frequency arc is<br />
observed at 500 °C, but also for this arc no activation energy can be calculated as the arc was only<br />
observed at one temperature.<br />
In 1000 ppm NO + 10% O2 3 arcs are consistently observed at all temperatures (arc 2, arc 3 and arc<br />
4) and in addition to these arcs a small arc (arc 5) is observed in the temperature range 400-500<br />
°C.<br />
An overview <strong>of</strong> the arcs found in the different atmospheres, their characteristic frequencies, n-<br />
values and activation energies are found in Table 9. It should be noted only for arc 4 in 1000 ppm<br />
NO data recorded at 500 °C were used in the calculation <strong>of</strong> the activation energies, for all the<br />
other arcs the data at 500 °C was excluded from the calculation, as these data did not show<br />
linearity on the Arrhenius plot used for the calculation <strong>of</strong> the activation energy.<br />
5.4.6.3 MnOx-impregnated cells<br />
Due to an insufficient number <strong>of</strong> datapoints and an apparent change in some <strong>of</strong> the processes at<br />
400 °C, no activation energies could be calculated for the processes in 1000 ppm NO on the cells<br />
impregnated with MnOx. In both 10% O2 and 1000 ppm NO + 10% O2 up to 4 arcs were identified in<br />
the impedance spectra, the characteristics <strong>of</strong> these arcs are stated in Table 10. In both<br />
atmospheres a small arc, denoted arc 1, was observed at the high frequencies at 300 and 350 °C.<br />
Two arcs, denoted arc 3 and arc 4 were consistently observed at all temperatures and in addition<br />
to this an extra arc denoted arc 2 was on some <strong>of</strong> the spectra observed in the frequency region<br />
between arc 1 and arc 3. In 10% O2 arc 2 was consistently observed in the temperature range 300-<br />
400 °C, which made it possible to calculate the activation energy for this arc. In 10% O2 the<br />
Arrhenius plot for arc 3 showed an abrupt change between 400 and 450 °C, for this reason the<br />
activation energy could only be calculated based on the resistances in the region 300-400 °C.<br />
61
5 Improvement <strong>of</strong> LSM15-CGO10 electrodes for electrochemical removal <strong>of</strong> <strong>NOx</strong> by KNO3 and<br />
MnOx impregnation<br />
Table 10. Characteristics <strong>of</strong> the arcs/RQ-subcircuits used during fitting <strong>of</strong> the impedance spectra<br />
recorded on symmetric LSM15-CGO10 cells impregnated with MnOx. In the table n-value is the n-<br />
value <strong>of</strong> the CPE, Ea the activation energy and R 2 is the estimate <strong>of</strong> the linearity between the<br />
points used for the calculation <strong>of</strong> Ea. Due to an insufficient number <strong>of</strong> datapoints and an apparent<br />
change in the process no activation energies could be calculated for the 1000 ppm NO<br />
atmosphere, for which reason no results from this atmosphere is included in the table.<br />
Atm.* Arc Freq. 300 °C Freq. 500 °C n-value Ea Stdev R T. range<br />
Hz Hz<br />
eV<br />
[°C]<br />
O2 1 36919<br />
0.90<br />
2 64<br />
0.65 0.87 0.05 1.000 300-400<br />
3 3.1 80 0.59 1.18 0.36 0.995 300-400<br />
4 0.137 3 0.73 0.64 0.01 0.977 300-500<br />
NO + O2<br />
1 41585<br />
0.87<br />
2<br />
0.50<br />
3 42 129 0.61 0.78 0.02 1.000 300-500<br />
4 3.8 6 0.74 0.38 0.05 0.967 300-500<br />
*The concentrations were 10% O 2 and 1000 ppm NO +10% O 2, in all cases with balance Ar.<br />
5.4.7 Near-equivalent capacitance (Cω)<br />
From the fitting results the near-equivalent capacitances Cω were calculated for the individual arcs.<br />
In Table 11 to Table 13 the results for the different atmospheres are stated. It is observed there is<br />
no significant difference between the Cω <strong>of</strong> the blank and the impregnated samples.<br />
Only for the blank cells a consistent trend was observed with respect to the temperature<br />
dependency <strong>of</strong> the Cω in the three atmospheres. In 1000 ppm NO the Cω for both arc 2, arc 3 and<br />
arc 4 increased with temperature. In 10% O2 the Cω <strong>of</strong> arc 2 and arc 3 remained constant with<br />
temperature, whereas for arc 4 a slight decrease in Cω was observed. In 1000 ppm NO + 10% O2<br />
the Cω <strong>of</strong> arc 2 stayed more or less constant, whereas for both arc 3 and arc 4 an increase in the Cω<br />
was observed with temperature.<br />
62
5 Improvement <strong>of</strong> LSM15-CGO10 electrodes for electrochemical removal <strong>of</strong> <strong>NOx</strong> by KNO3 and<br />
MnOx impregnation<br />
Table 11. Cω in 1000 ppm NO in the temperature range 300 °C – 500 °C (for Arc 1 only for 300 °C).<br />
The values are stated in F/cm 2 .<br />
Blank KNO3 imp. MnOx imp.<br />
Arc 1 2·10 -7 -3·10 -7 6.0·10 -8 -6.5·10 -8 3·10 -8 -5·10 -8<br />
Arc 2 5·10 -6 -1·10 -4<br />
63<br />
4·10 -6 -4·10 -5<br />
Arc 3 5·10 -6 -5·10 -4 1·10 -5 -2·10 -4 3·10 -6 -3·10 -4<br />
Arc 4 5·10 -5 -2·10 -3 2·10 -4 -2·10 -2 2·10 -3 -4·10 -1<br />
Arc 5 2·10 -3 -5·10 -1<br />
Table 12. Cω in 10% O2 in the temperature range 300 °C – 500 °C (for Arc 1 only for 300 °C). The<br />
values are stated in F/cm 2 .<br />
Blank KNO3 imp. MnOx imp.<br />
Arc 1 2·10 -7 -3·10 -7 5.5·10 -8 -5.6·10 -8 3·10 -8 -5·10 -8<br />
Arc 2 4·10 -6 -1·10 -5<br />
4·10 -6 -4·10 -5<br />
Arc 3 1·10 -4 -3·10 -4 3·10 -5 -3·10 -4 1·10 -5 -5·10 -4<br />
Arc 4 1·10 -3 -2·10 -3 5·10 -4 -3·10 -3 2·10 -4 -1·10 -2<br />
Table 13. Cω in 1000 ppm NO + 10% O2 in the temperature range 300 °C – 500 °C (for Arc 1 only for<br />
300 °C). The values are stated in F/cm 2 .<br />
Blank KNO3 imp. MnOx imp.<br />
Arc 1 2·10 -7 -3·10 -7 6.0·10 -8 -6.5·10 -8 3·10 -8 -5·10 -8<br />
Arc 2 2·10 -6 -1·10 -5 5·10 -7 -1·10 -4 2·10 -6 -5·10 -5<br />
Arc 3 2·10 -5 -2·10 -4 5·10 -6 -4·10 -4 5·10 -6 -3·10 -4<br />
Arc 4 5·10 -5 -3·10 -3 5·10 -4 -1·10 -3 5·10 -5 -3·10 -4<br />
Arc 5 2·10 -3 -5·10 -1
5 Improvement <strong>of</strong> LSM15-CGO10 electrodes for electrochemical removal <strong>of</strong> <strong>NOx</strong> by KNO3 and<br />
MnOx impregnation<br />
5.4.8 Flow variations<br />
At 500 °C flow variations were made in the three different atmospheres: 1000 ppm NO, 10% O2<br />
and 1000 ppm NO + 10% O2 in all three tests. The flow variation was made by first recording an<br />
impedance spectrum in 100 ml/min gasflow, and immediately thereafter record an impedance<br />
spectra in 50 ml/min gasflow. In Table 14 the percentage change in resistance between the<br />
different flow rates is stated for the different arcs. A negative value corresponds to a smaller<br />
resistance in 50 ml/min and a positive value corresponds to a larger resistance in 50 ml/min<br />
compared to in 100 ml/min. In the NO-containing atmospheres the largest change in arc resistance<br />
is found for the arc observed at the lowest frequencies, and consistently the arc resistance<br />
decreases with decreasing flow rate. For the MnOx-impregnated sample no measurements were<br />
made in 10% O2, for this reason those results are missing in the Table 14.<br />
Table 14. The percentage difference in resistance between cells flushed in a 100 ml/min flow and<br />
50 ml/min flow. A negative value states the resistance become lower in 50 ml/min flow compared<br />
to 100 ml/min flow.<br />
5.4.9 Concentration change<br />
1000 ppm NO 10% O2 1000 ppm NO + 10% O2<br />
Blank test<br />
Arc 2 3 0 -1<br />
Arc 3 1 0 -2<br />
Arc 4 -37 0 -8<br />
KNO3<br />
Arc 2<br />
-5 0<br />
Arc 3 -1 -2 0<br />
Arc 4 -2 1 -5<br />
Arc 5 -18<br />
-7<br />
MnOx<br />
Arc 2 -9 -<br />
Arc 3 -15 - 2<br />
Arc 4 -18 - -5<br />
During the test <strong>of</strong> the LSM15-CGO10 cells without impregnation, variations were made in the both<br />
the NO concentration and the O2 concentration at 500 °C. At first the NO content was kept<br />
constant at 1000 ppm NO while the oxygen concentration was varied in the order 10, 5 and 15%<br />
64
5 Improvement <strong>of</strong> LSM15-CGO10 electrodes for electrochemical removal <strong>of</strong> <strong>NOx</strong> by KNO3 and<br />
MnOx impregnation<br />
O2. Secondly the oxygen concentration was kept constant at 10% and the NO content was varied<br />
in the order 1000, 500 and 1500 ppm NO. The resistances and Cω corresponding to the<br />
concentration variations are stated in Table 15 for the variation in oxygen concentration and in<br />
Table 16 for the variation in NO concentration. With increasing oxygen content no influence is<br />
observed on the resistance <strong>of</strong> arc 2, a small decrease is observed in the resistance <strong>of</strong> arc 3, and a<br />
significant decrease in the resistance <strong>of</strong> arc 4 is observed. Only the Cω <strong>of</strong> arc 4 appear to depend<br />
on the oxygen content, the Cω <strong>of</strong> this arc appear to increase with increasing oxygen content. The<br />
resistances change with increasing NO concentration in a manner similar to when the oxygen<br />
content increases: the resistance <strong>of</strong> arc 2 remain unchanged, the resistance <strong>of</strong> arc 3 decreases<br />
slightly and the resistance <strong>of</strong> arc 4 decreases significantly. With respect to the Cω and the influence<br />
<strong>of</strong> increasing NO concentration the Cω <strong>of</strong> arc 2 remains constant but increases for arc 4, a<br />
behaviour similar to what was observed with increasing O2 content. However for arc 3 the Cω<br />
appears to decrease with increasing NO content, a behaviour which was not observed with an<br />
increase in the O2 content.<br />
Table 15. Resistance and Cω during variations in the oxygen concentration. The data were recorded<br />
on one cell at 500 °C and the NO concentration was constant at 1000 ppm NO.<br />
Resistance [Ω cm 2 ]<br />
65<br />
Cω [Ω/cm 2 ]<br />
5% O2 10% O2 15% O2 5% O2 10% O2 15% O2<br />
Arc2 35 34 34 8.7·10 -6 8.4·10 -6 8.1·10 -6<br />
Arc3 50 48 46 1.4·10 -4 1.4·10 -4 1.4·10 -4<br />
Arc4 65 48 40 2.0·10 -3 2.2·10 -3 2.4·10 -3<br />
Table 16. Resistance and Cω during variations in the NO concentration. The data were recorded on<br />
one cell at 500 °C and the oxygen concentration was constant at 10% O2.<br />
500 ppm<br />
NO<br />
Resistance [Ω cm 2 ] Cω [Ω/cm 2 ]<br />
1000 ppm<br />
NO<br />
1500 ppm<br />
NO<br />
500 ppm<br />
NO<br />
1000 ppm<br />
NO<br />
1500 ppm<br />
NO<br />
Arc2 36 35 34 4.0·10 -6 8·10 -6 7.6·10 -6<br />
Arc3 47 46 44 1.5·10 -4 1.3·10 -4 1.2·10 -4<br />
Arc4 72 47 35 1.7·10 -3 2.3·10 -3 2.9·10 -3
5 Improvement <strong>of</strong> LSM15-CGO10 electrodes for electrochemical removal <strong>of</strong> <strong>NOx</strong> by KNO3 and<br />
MnOx impregnation<br />
5.4.10 Degradation<br />
Degradation during the entire cell test was estimated from impedance spectra recorded in the<br />
beginning and the end <strong>of</strong> the cell test. The spectra were recorded at 300 °C in 1000 ppm NO + 10%<br />
O2. In Table 17 the average serial and polarisation resistances obtained from the spectra are<br />
stated. In the blank test a minor increase is observed in both the serial resistance and the<br />
polarisation resistance during the cell test. For the cells impregnated with KNO3 a minor decrease<br />
is observed in the serial resistance, and 51% increase is observed in the polarisation resistance.<br />
The cells impregnated with MnOx show a significant degradation in the serial resistance, and a<br />
huge degradation (>3000%) in the polarisation resistance.<br />
Table 17. Serial resistance and polarisation resistance in 1000 ppm NO + 10% O2 in the beginning<br />
and the end <strong>of</strong> the tests. The values stated are the average values <strong>of</strong> the 3 or 4 cells tested in each<br />
test, and the number in the parenthesis state the uncertainties.<br />
Rs<br />
Begin End Diff. Begin End Diff.<br />
[Ωcm 2 ] [Ωcm 2 ] [%] [Ωcm 2 ] [Ωcm 2 ] [%]<br />
Blank 54(3) 57(3) 5 7635(911) 8460(689) 11<br />
KNO3 imp. 72(1) 64(3) -11 4484(596) 6774(241) 51<br />
MnOx imp. 69(21) 212(101) 207 761(165) 11960(6193) 3650<br />
Since an increase was observed in the polarisation resistance for all the three tests, it was <strong>of</strong><br />
interest to estimate which <strong>of</strong> the arcs/processes mainly contributed to this degradation. For this<br />
reason the change in the resistance <strong>of</strong> each arc was calculated and divided by the total change in<br />
the polarisation resistance. The result from this calculation is shown in Figure 27, where positive<br />
values means the arc resistance increases and negative values the arc resistance decreases.<br />
66<br />
Rp
5 Improvement <strong>of</strong> LSM15-CGO10 electrodes for electrochemical removal <strong>of</strong> <strong>NOx</strong> by KNO3 and<br />
MnOx impregnation<br />
∆RArc 3/∆Rpol [%]<br />
200<br />
150<br />
100<br />
50<br />
0<br />
0<br />
-50<br />
1 2 3 4 5<br />
-100<br />
Blank<br />
KNO3 imp.<br />
MnOx imp.<br />
Arc number<br />
Figure 27. Change in arc resistance relative to the entire change in polarisation resistance when<br />
spectra recorded at 300 °C in 1000 ppm + 10% O2 at beginning and the end <strong>of</strong> the cell test are<br />
compared. Positive values state the arc increases in resistance, negative values the arc decreases<br />
in resistance.<br />
For the blank test the relatively small increase in polarisation resistance was equally caused by an<br />
increase in the resistance <strong>of</strong> arc 2 and 4. For the samples impregnated with KNO3 the change in<br />
polarisation resistance was caused by an increase in the resistance <strong>of</strong> arc 4, and a decrease in the<br />
resistance <strong>of</strong> arc 3. In the test with MnOx-impregnated samples only 3 arcs were observed at 300<br />
°C, and the increase in polarisation resistance in this test was entirely caused by an increase in the<br />
resistance <strong>of</strong> the arc labelled 4. When comparing all three tests it is a consistent trend the increase<br />
in polarisation resistance either is solely or to a large extent explained by an increase in the<br />
resistance <strong>of</strong> arc 4.<br />
5.4.11 Demounting<br />
When the samples were demounted no visible change was seen before and after testing on the<br />
cells without impregnation and the cells impregnated with KNO3. In contrast to this a very obvious<br />
change was observed between before and after cell testing on the cells impregnated with MnOx.<br />
After the test these cells had become extremely brittle, and were all cracked into tiny pieces when<br />
they were demounted. It should be noted this only was seen for the three cells subjected to<br />
electrochemical cell testing, whereas the fourth cell, which only had experienced the temperature<br />
pr<strong>of</strong>ile, at the demounting looked exactly as before testing.<br />
67
5 Improvement <strong>of</strong> LSM15-CGO10 electrodes for electrochemical removal <strong>of</strong> <strong>NOx</strong> by KNO3 and<br />
MnOx impregnation<br />
5.4.12 SEM characterisation<br />
SEM images were recorded on the cells before and after the electrochemical cell testing. In<br />
addition to this images were recorded on impregnated cells which had experienced the same<br />
temperature pr<strong>of</strong>ile as the electrochemically tested cells, in order to investigate if changes<br />
observed in the microstructure mainly should be ascribed to electrochemical cell testing or to the<br />
temperature pr<strong>of</strong>ile experienced by the cells during the testing. Representative SEM images <strong>of</strong> the<br />
samples are shown in Figure 28.<br />
Figure 28. SEM images <strong>of</strong> blank and impregnated LSM15-CGO10 electrodes before testing, after testing and<br />
after heat-treatment as the tested cells. The images show A1: Blank electrode before testing, A2: Blank<br />
electrode after testing, B1: KNO3 impregnated electrode before testing, B2: KNO3 impregnated electrode<br />
after testing, B3: KNO3 impregnated electrode after heat treatment, C1: MnOx impregnated electrode before<br />
testing, C2: MnOx impregnated electrode after testing, C3: MnOx impregnated electrode after heat<br />
treatment.<br />
68
5 Improvement <strong>of</strong> LSM15-CGO10 electrodes for electrochemical removal <strong>of</strong> <strong>NOx</strong> by KNO3 and<br />
MnOx impregnation<br />
The blank sample before cell testing shows a fairly smooth surface on the electrode grains and the<br />
porosity evenly distributed in the electrode (Image A1). In the electrode impregnated with KNO3<br />
the KNO3 is present in the electrode in big lumps with a slightly porous surface (Image B1). In the<br />
areas where the KNO3 lumps are present, they more or less seem to block the electrode porosity,<br />
but most <strong>of</strong> the electrode is left without any sign <strong>of</strong> the KNO3. After the electrochemical testing<br />
and also when the cell only had experienced the temperature pr<strong>of</strong>ile as the tested cells, the areas<br />
with KNO3 filling the porosity had disappeared, and the electrodes looks like the un-impregnated<br />
electrodes (Image B2 and Image B3). In the electrode impregnated with MnOx the MnOx appear to<br />
be present as fine nanoparticles distributed through the entire electrode before testing (Image<br />
C1). After the electrochemical cell testing a significant change is observed in the electrode<br />
microstructure, where bigger, round nanoparticles with a diameter around 50 nm are observed on<br />
the grain surfaces, which at the same time appear to have a rougher surface (Image C2). Yet<br />
another microstructure is found on the sample which only was subjected to the heat treatment.<br />
On this sample the nanoparticles seem to have vanished and the electrode appear similar to a<br />
blank, non-impregnated electrode (Image C3).<br />
5.5 Discussion<br />
5.5.1 Cylic voltammetry<br />
One <strong>of</strong> the reasons why the cyclic voltammetry was made, was in order to see if oxidation and/or<br />
<strong>reduction</strong> <strong>of</strong> the KNO3/K2O <strong>NOx</strong> storage compound could be observed on the CVs, as this has<br />
previously been observed on a similar system 46 . In the cyclic voltammograms recorded in this<br />
work, a peak appeared only in NO containing atmosphere at 400 and 450 °C on the KNO3-<br />
impregnated samples. It seems likely this peak may be ascribed to the <strong>NOx</strong>-storage compound.<br />
The fact this peak is only observed in 1000 ppm NO and not in 1000 ppm NO + 10% O2, could be<br />
explained by presence <strong>of</strong> O2 making it more favourable to reduce O2 compared to reduce KNO3.<br />
When the current densities for the three tests obtained during cyclic voltammetry are compared<br />
to the polarisation resistances, the highest current densities are observed for the impregnated<br />
tests with also had the lowest polarisation resistances determined from the EIS. This indicates the<br />
information gained from the EIS recorded at OCV may also to some extent be applicable to the<br />
situation when the cells are under current load.<br />
69
5 Improvement <strong>of</strong> LSM15-CGO10 electrodes for electrochemical removal <strong>of</strong> <strong>NOx</strong> by KNO3 and<br />
MnOx impregnation<br />
5.5.2 EIS results - Identification <strong>of</strong> processes<br />
5.5.2.1 Blank cells<br />
On the LSM15-CGO10 cells without impregnation 4 processes were identified to contribute to the<br />
polarisation resistance at 300 °C, and 3 processes to contribute at higher temperatures. In order to<br />
identify these processes comparison will be made to literature, and the effect <strong>of</strong> varying the<br />
atmosphere and the flow rates will be taken into consideration.<br />
Starting from the high frequency end <strong>of</strong> the impedance spectra, arc 1 with a summit frequency<br />
around 20000 Hz is observed in all atmospheres, but only at 300 °C. The n-value <strong>of</strong> the arc is 0.9,<br />
and the near-equivalent capacitance is in the range 3*10 -7 -6*10 -7 F/cm 2 . As the summit frequency<br />
and the Cω <strong>of</strong> this arc is independent on the atmosphere, the arc is likely ascribed to transport <strong>of</strong><br />
oxygen intermediates/oxygen ions between the electrolyte and the LSM and through the<br />
electrolyte part <strong>of</strong> the composite electrode, as identified by Jørgensen et al. 54 for LSM/YSZ<br />
electrodes and later also found for LSM/CGO electrodes 36 .<br />
In all atmospheres and temperatures an arc labelled arc 2 is identified. The n-value <strong>of</strong> the arc is in<br />
all atmospheres 0.45, but the Cω <strong>of</strong> the arc shows much dependency on whether oxygen is present<br />
in the atmosphere or not. While the Cω in the oxygen containing atmospheres (10% O2 and 1000<br />
ppm NO + 10% O2) remains more or less constant with increasing temperature, the Cω in 1000<br />
ppm NO continues to increase. The arc shows no dependency on the flowrate, or on variations in<br />
the pO2 within the range 5-15% and variations in the NO concentration in the range 500-1500<br />
ppm. In the temperature range 300-500 °C the calculated activation energy is close to 1 eV in 10%<br />
O2, but only around 0.76 eV in the NO containing atmospheres. The difference in activation<br />
energy for arc 2 between the NO containing atmospheres and 10% O2 could indicate the arc<br />
represents one process in NO containing atmospheres and another process in 10% O2. In 10% O2<br />
the activation energy around 1 eV corresponds well with the activation observed by Jørgensen et<br />
al. for the transport/transfer <strong>of</strong> oxygen intermediates between the LSM and the electrolyte<br />
material and through the electrolyte material. As explained by Jørgensen et al. 54 these processes<br />
may give rise to two arcs in the impedance spectrum, named arc A and arc B, and could for this<br />
reason account for both arc 1 and arc 2 observed in 10% O2 in this work. However, on the<br />
impregnated samples arc 2 decreases significantly or disappears entirely (described later in the<br />
70
5 Improvement <strong>of</strong> LSM15-CGO10 electrodes for electrochemical removal <strong>of</strong> <strong>NOx</strong> by KNO3 and<br />
MnOx impregnation<br />
article), which would not be the case if arc 2 was related to oxygen ion transport in the CGO. For<br />
this reason arc 2 is so far ascribed to one <strong>of</strong> the processes dissociative adsorption, diffusion or<br />
charge transfer at the TPB.<br />
Arc 3 was fitted with the n-values 0.68 (1000 ppm NO), 0.54 (10% O2) and 0.69 (1000 ppm NO +<br />
10% O2). The Cω in 1000 ppm NO for arc 3 behaved similar to for arc 2, with a continued increase<br />
with temperature. In 10% O2 and 1000 ppm NO + 10% O2 some divergence is found in the Cω<br />
below 400 °C, with the lowest Cω found in 1000 ppm NO + 10% O2, but at 400 °C and above the Cω<br />
in these two atmospheres become almost equal. If only the temperature range 400-500 °C is<br />
considered the activation energy <strong>of</strong> this arc is close to 1 eV in all 3 atmospheres, but if the lower<br />
temperatures are included in the calculation <strong>of</strong> the Cω, the activation energies in the NO<br />
containing atmospheres decreases to 0.69. The decrease in the calculated activation energy is<br />
likely due a shift in the process around 400 °C, visible as a bend on the Arrhenius plot for the NO-<br />
containing atmospheres. Arc 3 shows no dependency on flow variations, but the resistance<br />
decreases slightly when the oxygen content is increased from 5-15% or the NO content is<br />
increased from 500 to 1500 ppm NO. The change between 5 to 15% oxygen does not affect the Cω,<br />
whereas the increase in NO content from 500 to 1500 ppm decreases the Cω <strong>of</strong> arc 3 slightly. Arc 3<br />
appears to be dependent on the atmosphere and show no dependency on the flow rate. In the<br />
literature a process being dependent on the atmospheres is dissociative adsorption, transfer <strong>of</strong><br />
species at the triple-phase- boundary (TPB) and surface diffusion 54 . The activation energy for this<br />
process in air was by Jørgensen et al. reported to be in the range 1.5-2 eV 54 , which is above the<br />
reported activation energy <strong>of</strong> 1 eV in 10% O2 reported in this work. But Werchmeister et al.<br />
reported the activation energy for the TPB process to be 0.64 eV in 1% NO 36 , which shows the<br />
activation energy <strong>of</strong> this process is lower in NO compared to in air. As mentioned, a bend was<br />
observed on the Arrhenius curve in NO containing atmospheres around 400 °C. Combined with the<br />
attribution <strong>of</strong> arc 3 to TPB-related proceeses, a possible explanation <strong>of</strong> the bend could be a change<br />
in the adsorbed <strong>NOx</strong>-species with increasing temperature. In-situ DRIFT measurements <strong>of</strong> NO<br />
adsorption on a model <strong>NOx</strong>-storage catalyst and on La2O3 showed a change in the adsorbed <strong>NOx</strong>-<br />
species during temperature increase from 300 °C to 500 °C 71, 143 . This makes it likely a similar<br />
change will be observed when <strong>NOx</strong> is adsorbed on LSM15-CGO10 electrodes, and a change in the<br />
adsorbed <strong>NOx</strong> species would likely affect processes related to the TPB process like surface<br />
71
5 Improvement <strong>of</strong> LSM15-CGO10 electrodes for electrochemical removal <strong>of</strong> <strong>NOx</strong> by KNO3 and<br />
MnOx impregnation<br />
diffusion and dissociative adsorption, thereby causing the observed bend on the Arrhenius curved<br />
for arc 3.<br />
The arc observed at the lowest frequencies, arc 4, behaves quite differently depending on the<br />
atmosphere, but is in all cases fitted with the n-value 0.89. In the NO containing atmospheres the<br />
arc resistance decreases with decreasing flowrate, most significantly when only 1000 ppm NO is<br />
present. No activation energy could be calculated for this arc in 1000 ppm NO, but the fact the arc<br />
decreases with decreasing flow rate makes it likely the arc is a NO2 conversion arc as previously<br />
reported by Werchmeister et al. 36 . The NO2 conversion arc was reported to have an activation<br />
energy <strong>of</strong> 0.34 eV in 1% NO in Ar 36 . This is below the activation energy 0.88 eV reported for arc 4 in<br />
1000 ppm NO + 10% O2 in this work.<br />
5.5.2.2 KNO3-impregnated cells<br />
The impedance spectra recorded on the KNO3-impregnated cell were fitted with between 2 and 4<br />
RQ-subcircuits. Compared to the spectra recorded on the blank cells, the impedance spectra<br />
recorded on the KNO3-impregnated cells have an additional smaller arc present in the low<br />
frequency region in 1000 ppm NO + 10% O2.<br />
In the following the processes will be described one by one, starting from high frequency and with<br />
the arcs numbered from 1 to 5 as in the results section.<br />
Independent <strong>of</strong> the atmosphere, a high frequency arc is observed at 300 and 350 °C, with a<br />
summit frequency around 20000 Hz at 300 °C. The n-value <strong>of</strong> the arc is 0.8, the Cω around 1.2x10 -7<br />
F/cm 2 at 300 °C, and since the summit frequency and Cω does not depend on the atmosphere, the<br />
arc is likely ascribed to transport <strong>of</strong> oxygen intermediates/oxygen ions between the electrolyte<br />
and the LSM and through the electrolyte part <strong>of</strong> the composite electrode 54 .<br />
In 1000 ppm NO + 10% O2 an arc labelled arc 2 is consistently observed at all temperatures. The<br />
arc is fitted with the n-value 0.6. The arc does not change when the flow is changed at 500 °C, and<br />
the activation energy <strong>of</strong> the process corresponding to the arc is close to 1 eV. This activation<br />
energy is lower than the activation energy for the TPB-process <strong>of</strong> 1.5-2 eV reported by Jørgensen<br />
et al. 54 for LSM/YSZ composite electrodes in air, and higher than the activation energy <strong>of</strong> 0.64 eV<br />
reported by Werchmeister et al. 36 for the TPB-process in 1% NO on LSM15/CGO10 composite<br />
72
5 Improvement <strong>of</strong> LSM15-CGO10 electrodes for electrochemical removal <strong>of</strong> <strong>NOx</strong> by KNO3 and<br />
MnOx impregnation<br />
electrodes. It should be noted in the two other atmospheres, 1000 ppm NO and 10% O2, an arc<br />
labelled arc 2 is also found in some <strong>of</strong> the impedance spectra, but since this arc is so rarely<br />
observed no activation energy could be calculated, and it will not be discussed further.<br />
Arc 3 is consistently observed at all temperatures in all atmospheres. In 1000 ppm NO and 10% O2<br />
the arc is fitted with n-value 0.59, whereas in 1000 ppm NO + 10% O2 the n-value 0.7 is used. The<br />
Cω is in all atmospheres in the range 1x10 -5 -8x10 -4 F/cm 2 . In 1000 ppm NO and 10% O2 the<br />
activation energy <strong>of</strong> the arc is 1.16 eV, whereas in 1000 ppm NO + 10% O2 the activation energy is<br />
only 0.76 eV. As described for arc 2, these activation energies lies between the activation energies<br />
reported for the TPB process by Jørgensen et al. 54 and Werchmeister et al. 36 .<br />
In addition to arc 3 arc 4 is the only other arc consistently observed in all atmospheres at all<br />
temperatures. In the three different atmospheres the arc is fitted with the n-values 0.76 (1000<br />
ppm NO), 0.85 (10% O2) and 0.90 (1000 ppm NO + 10% O2). The Cω <strong>of</strong> the arc is in the range 4x10 -4 -<br />
4x10 -2 F/cm 2 . The activation energies found for the arc were 0.42 eV (1000 ppm NO), 1.4 eV (10%<br />
O2) and 0.52 eV (1000 ppm NO + 10% O2). When the flow rate is decreased, the arc resistance<br />
decreases in the NO containing atmospheres, but stays more or less constant in 10% O2. The<br />
significant difference in activation energy observed between the NO-containing atmospheres and<br />
in 10% O2 combined with the different behaviour during the flow rate variations, indicates this arc<br />
represents a different process depending on whether NO is present is not. Exactly which process<br />
the arc represents is hard to decide, as the activation energies for the arc lies in between the<br />
activation energies determined by Werchmeister et al. for the arc related to the TPB-processes<br />
(0.64 eV) and the NO2 conversion arc (0.34 eV) in 1% NO 36 . It can also be discussed whether the<br />
decrease in arc resistance with decreasing flowrate is big enough to be considered a true change,<br />
or may just be a false effect caused by a change in resistance <strong>of</strong> the low frequency arc 5 located<br />
next to arc 4.<br />
Arc 5 appear in the low frequency region in the temperature range 400-500 °C in 1000 ppm NO<br />
and 1000 ppm NO + 10% O2. Whereas arc 5 in 1000 ppm NO + 10% O2 is a small arc adjacent to the<br />
much bigger arc 4, the result is quite different in 1000 ppm NO, where arc 5 is the major<br />
contributor to the cell resistance. The arc was fitted with the n-value 0.88 in 1000 ppm NO and<br />
0.97 in 1000 ppm NO + 10% O2. The Cω <strong>of</strong> the arc decreased strongly with temperature in both<br />
73
5 Improvement <strong>of</strong> LSM15-CGO10 electrodes for electrochemical removal <strong>of</strong> <strong>NOx</strong> by KNO3 and<br />
MnOx impregnation<br />
atmospheres, in 1000 ppm NO from around 1 to 4x10 -3 F/cm 2 , and in 1000 ppm NO + 10% O2 from<br />
1 to around 7x10 -2 F/cm 2 . Of all the arcs identified on the KNO3 impregnated sample arc 5 shows<br />
the most significant dependency on flow rate, with a decrease in flow rate causing a decrease in<br />
arc resistance. The dependency on flow rate combined with a high n-value could indicate the arc is<br />
an NO2 conversion arc as previously reported by Werchmeister et al. 36 , on the other hand the arc<br />
could also be due to a process related only to the presence <strong>of</strong> impregnated KNO3 and NO in the<br />
atmosphere, this will be discussed further in the section “Effect <strong>of</strong> impregnation – overall<br />
comparison <strong>of</strong> tests”<br />
5.5.2.3 MnOx-impregnated cells<br />
The spectra recorded on the MnOx-impregnated cells are all fitted with 2-4 RQ-subcircuits. As<br />
previously written, no activation energies could be calculated for the processes in 1000 ppm NO,<br />
for this reason only the results found in 10% O2 and 1000 ppm NO + 10% O2 will be discussed.<br />
Consistent with the results from the blank and the KNO3-impregnated cells, a high frequency arc,<br />
labelled arc 1, is observed at 300 °C and 350 °C on the MnOx-impregnated cells. The summit<br />
frequency <strong>of</strong> this arc is in the range 30000-50000 Hz, which is higher than the summit frequency<br />
around 20000 Hz observed for this arc in the other tests. Again the arc will be ascribed to<br />
transport <strong>of</strong> oxygen intermediates/oxygen ions between the electrolyte and the LSM and through<br />
the electrolyte part <strong>of</strong> the composite electrode 54 , as the presence only at lower temperatures and<br />
the distinct separation to the rest <strong>of</strong> the impedance spectra seems to be quite characteristic<br />
features <strong>of</strong> this arc.<br />
On the impedance spectra recorded in 10% O2 an arc labelled arc 2 is observed in the temperature<br />
range 300-400 °C. The arc is fitted with the n-value 0.65 and the activation energy is calculated to<br />
be 0.87 eV. In 1000 ppm NO + 10% O2 an arc labelled arc 2 is only observed a few times, and the<br />
arc will for this reason not be discussed any further for this atmosphere.<br />
The arc labelled arc 3 is consistently observed at all temperatures in both 10% O2 and 1000 ppm<br />
NO + 10% O2. In 10% O2 the arc is fitted with n-value 0.59, and the activation energy is calculated<br />
to 1.18 eV, while in 1000 ppm NO + 10% O2 the arc is fitted with n-value 0.61 and the activation<br />
energy is calculated to 0.78 eV. In both atmospheres the Cω <strong>of</strong> the arc is found in the range 1x10 -5 -<br />
1x10 -3 F/cm 2 . The difference in activation energy between arc 3 in the two atmospheres indicates<br />
74
5 Improvement <strong>of</strong> LSM15-CGO10 electrodes for electrochemical removal <strong>of</strong> <strong>NOx</strong> by KNO3 and<br />
MnOx impregnation<br />
the arc represents two different processes, but when compared to Jørgensen et al. 54 and<br />
Werchmeister et al. 36 it seems likely the process in both atmospheres is related to dissociative<br />
adsorption, transfer <strong>of</strong> species at TPB and surface diffusion. The difference between the two<br />
atmospheres is then likely the species which participate in the reactions at the TPB, and it seems<br />
plausible <strong>NOx</strong>-species participate in these reactions when NO is present in the atmospheres.<br />
Finally arc 4 is observed at all temperatures in both atmospheres as well. In 10% O2 the arc is<br />
characterised by n-value 0.73, activation energy 0.64 eV and Cω in the range 8x10 -5 -1x10 -3 F/cm 2 . In<br />
1000 ppm NO + 10% O2 the arc is characterized by n-value 0.74, activation energy 0.38 eV and Cω<br />
in the range 1x10 -5 -8x10 -4 F/cm 2 . During the flow variation the arc resistance decrease with<br />
decreasing flow rate in 1000 ppm NO +10% O2, which together with the low activation energy is in<br />
agreement with characteristics Werchmeister et al. found for the NO2 conversion arc 36 . Contrary<br />
to the observations made by Werchmeister al. 36 , who as expected for a conversion arc observed<br />
an n-value close to 1, the NO2-conversion arc observed on the MnOx-impregnated samples is<br />
lower, around 0.74.<br />
5.5.3 Effect <strong>of</strong> impregnation – overall comparison <strong>of</strong> tests<br />
As stated in the beginning <strong>of</strong> the results section, impregnation with KNO3 and MnOx significantly<br />
decreased the polarisation resistance <strong>of</strong> LSM15/CGO10 electrodes in the temperature range 300-<br />
450 °C, both in 1000 ppm NO, in 10% O2 and in 1000 ppm NO + 10% O2. It would be <strong>of</strong> great<br />
interest to understand, which <strong>of</strong> the electrode processes are affected by the impregnation and<br />
especially how they are affected. For the NO-containing atmospheres it also <strong>of</strong> interest to see, if<br />
any NO-storage effect can be found for the KNO3 and/or MnOx-impregnation. For this reason the<br />
preceding description <strong>of</strong> fitting <strong>of</strong> impedance spectra was given, as these results may yield<br />
information on the effect <strong>of</strong> the impregnation on the electrode processes. In the following the<br />
impedance results from the three tests will be compared, and the effect <strong>of</strong> the impregnations on<br />
the individual processes will be discussed. An underlying assumption in the discussion is the<br />
majority <strong>of</strong> the processes identified in the three tests will be the same, as the impregnations are<br />
expected to affect the electrode processes but not totally alter all <strong>of</strong> them.<br />
To summarize the results, all the impedance spectra were fitted with 2-4 RQ-subcircuits,<br />
independent <strong>of</strong> whether the samples were impregnated or not. Independent <strong>of</strong> the atmosphere, a<br />
75
5 Improvement <strong>of</strong> LSM15-CGO10 electrodes for electrochemical removal <strong>of</strong> <strong>NOx</strong> by KNO3 and<br />
MnOx impregnation<br />
high frequency arc (Arc 1) was observed on all spectra at low temperatures, and ascribed to<br />
transport/transfer <strong>of</strong> oxygen intermediates/oxide ions between the LSM and CGO and through the<br />
CGO electrolyte. In both the NO containing atmospheres a NO2 conversion arc (arc 4) was found in<br />
the low frequency end <strong>of</strong> the impedance spectra in all tests. In between the just-described high<br />
frequency arc and low frequency arc, two other arcs (arc 2 and arc 3) were present in 1000 ppm<br />
NO and in 1000 ppm NO + 10% O2. Both arcs are ascribed to processes at or nearby the TPB<br />
(adsorption/diffusion/charge transfer). In addition to these arcs one more arc is observed in NO-<br />
containing atmospheres on the KNO3 impregnated sample. As this arc is only observed on the<br />
KNO3-impregnated sample, and only when NO is present in the atmosphere, it seems reasonable<br />
to ascribe the arc to a <strong>NOx</strong>-storage process, or at least a process related to interaction between<br />
the NO and the impregnated KNO3. It should be pointed out, the resistance <strong>of</strong> both arc 4 and arc 5<br />
decreased with decreasing flow rate in NO containing atmospheres. For arc 4 this was explained in<br />
accordance with the results from Werchmeister et al who ascribed the arc to conversion <strong>of</strong> the<br />
intermediate NO2 formed catalytically from the NO on the LSM 36 . For arc 5, which in this work is<br />
ascribed to a <strong>NOx</strong>-storage process, a similar dependence on the flow rate, i.e. the concentration <strong>of</strong><br />
NO2, could be expected for the following reason: In conventional NSR-catalysis the reaction<br />
sequence is reported to consist first <strong>of</strong> catalytic conversion <strong>of</strong> NO to NO2 on the platinum sites,<br />
and subsequent storage <strong>of</strong> the NO2 on the <strong>NOx</strong>-storage compound 19, 21 . On LSM-electrodes<br />
combined with a <strong>NOx</strong>-storage compound a similar mechanism would be catalytic conversion <strong>of</strong> NO<br />
to NO2 on LSM instead <strong>of</strong> platinum, and subsequent storage/adsorption <strong>of</strong> the NO2 on the <strong>NOx</strong>-<br />
storage compound. A decrease in flow rate would in this case decrease the resistance <strong>of</strong> the <strong>NOx</strong>-<br />
storage process due to the higher concentration <strong>of</strong> NO2, as observed in this work.<br />
In the atmosphere with 10% O2 two to three arcs are observed in addition to the high frequency<br />
arc. From the results obtained in this work it is not possible with certainty to assign these arcs to<br />
specific electrode processes, but they are so far ascribed to processes at or around the TPB. It<br />
should be noted in literature it is reported gas phase diffusion resistance may be significant below<br />
10% O2 155 , i.e. at a pO2 range close to the pO2 during testing in this work. But as gas phase diffusion<br />
resistance is expected to be temperature independent 54 , and all the processes identified in 10% O2<br />
show a strong temperature dependency, gas phase diffusion cannot explain any <strong>of</strong> the arcs<br />
observed in 10% O2 in this work.<br />
76
5 Improvement <strong>of</strong> LSM15-CGO10 electrodes for electrochemical removal <strong>of</strong> <strong>NOx</strong> by KNO3 and<br />
MnOx impregnation<br />
In order to evaluate if all the processes have been affected equally by the impregnation, it is useful<br />
to compare how the impregnation affects the resistance <strong>of</strong> the different arcs. In Figure 29 to<br />
Figure 31 the resistances found in 1000 ppm NO + 10% O2 are shown for the three different tests,<br />
and it is observed how the impregnation causes a general decrease in resistance, with arc 4/the<br />
NO2 conversion at 400 to 500 °C as the one exception.<br />
Figure 29. Resistance <strong>of</strong> arc 2 in 1000 ppm NO + 10% O2.<br />
Figure 30. Resistance <strong>of</strong> arc 3 in 1000 ppm NO + 10% O2.<br />
77
5 Improvement <strong>of</strong> LSM15-CGO10 electrodes for electrochemical removal <strong>of</strong> <strong>NOx</strong> by KNO3 and<br />
MnOx impregnation<br />
Figure 31. Resistance <strong>of</strong> arc 4 in 1000 ppm NO + 10% O2.<br />
5.5.4 Activation energies in 1000 ppm NO + 10% O2<br />
In addition to the change in resistances due to the impregnation the change in activation energies<br />
should also be considered. A change in the activation energy would usually be interpreted as a<br />
change in the reaction mechanism, which for instance could be due to a different reaction<br />
intermediates, other available reactions sites etc. However a change in activation energy could<br />
also be the result from a change in the microstructure during the test. If the microstructure is<br />
dominated by impregnated nano-particles at low temperatures, and the microstructure becomes<br />
coarser at high temperatures, an apparent change in activation energy will be observed for<br />
processes dependent on the electrode microstructure. This change will be due to the micro<br />
structural changes and the correlated change in resistances, and not due to a change in the actual<br />
reaction mechanism.<br />
In 1000 ppm NO + 10% O2 the activation energy <strong>of</strong> arc 2 has increased from 0.74 eV to 1.05 eV<br />
when the electrodes were impregnated with KNO3. When the impregnation was made with MnOx,<br />
no activation energy could be calculated for arc 2, as the arc was only found on very few EIS<br />
spectra. This could indicate the MnOx-impregnation decreased the resistance <strong>of</strong> arc 2 so much; the<br />
arc no longer can be separated on the impedance plot and no activation energy could be<br />
calculated.<br />
78
5 Improvement <strong>of</strong> LSM15-CGO10 electrodes for electrochemical removal <strong>of</strong> <strong>NOx</strong> by KNO3 and<br />
MnOx impregnation<br />
In the same atmosphere, none <strong>of</strong> the impregnations seemed to alter the activation energy <strong>of</strong> arc<br />
3, as it only varies between 0.69 (blank), 0.76 (KNO3 imp.) and 0.78 (MnOx imp.) which will be<br />
considered within the uncertainty <strong>of</strong> the experiment and the fitting. Arc 3, which was ascribed to a<br />
TPB related process, has for this reason not changed reaction mechanism (Ea is constant) due to<br />
the impregnation, but the resistances <strong>of</strong> the arc has in general decreased, which would agree with<br />
the impregnations causing an increase in the triple-phase boundary length.<br />
For arc 4/the NO2 conversion arc no activation energy could be calculated for the KNO3<br />
impregnated sample, whereas for the MnOx-impregnated sample the activation energy had<br />
decreased significantly, from 0.88 eV (blank sample) to 0.38 (MnOx-impregnated sample). The<br />
decrease in activation energy for the MnOx- impregnated sample could be explained by the MnOx<br />
increasing the catalytic conversion <strong>of</strong> NO to NO2 thereby increasing the NO2 concentration in the<br />
electrode.<br />
5.5.5 Activation energies in 10% O2<br />
Looking at the effect <strong>of</strong> the impregnation on the processes in 10% O2 both impregnations seemed<br />
to decrease the activation energy <strong>of</strong> arc 3, whereas for arc 4 the KNO3 impregnation left the<br />
activation energy unchanged while the MnOx impregnation decreased the activation energy <strong>of</strong> the<br />
arc. So far both arc 3 and arc 4 are ascribed to processes related to the TPB. For the arc 3 process<br />
both impregnations seem to introduce or enhance a reaction path way with lower activation<br />
energy, whereas for arc 4 this only seem to be the case for the MnOx impregnation.<br />
Finally, with respect to the effect <strong>of</strong> impregnating with MnOx and KNO3, it was unexpected the<br />
impregnation with KNO3 had such a significant impact on the resistances not only in the NO<br />
containing atmospheres, but also in 10% O2. This was unexpected as KNO3 was expected to<br />
interact with NO during the <strong>NOx</strong>-storage, but not to have any effect on electrode reactions<br />
involving only oxygen species. Also the fact the MnOx and KNO3 impregnation was distributed so<br />
differently in the electrodes before testing made it quite surprising both impregnations in general<br />
decreased the resistances contributing to the polarisation resistances. This shows, a clear<br />
understanding <strong>of</strong> how impregnation in general and especially the KNO3 impregnation affects the<br />
electrode processes is still missing. To clarify this more experiments are needed, as a first<br />
suggestion the impregnation <strong>of</strong> KNO3 should be improved to get the KNO3 more evenly distributed<br />
79
5 Improvement <strong>of</strong> LSM15-CGO10 electrodes for electrochemical removal <strong>of</strong> <strong>NOx</strong> by KNO3 and<br />
MnOx impregnation<br />
in the electrode, and more impedance spectra should be recorded with variations in the NO and<br />
O2 concentration to gain more insight into the processes occurring in the KNO3 impregnated<br />
electrodes.<br />
5.5.6 Degradation<br />
As shown in the results section the degradation <strong>of</strong> the impregnated samples is in general larger<br />
compared to the blank samples. The majority <strong>of</strong> the degradation in the polarisation resistance was<br />
caused by an increase in the resistance <strong>of</strong> arc 4, which is ascribed to the NO2 conversion process.<br />
This resistance increase could be explained in two different ways:<br />
1. The LSM had lost ability to convert NO to NO2 during degradation, thereby decreasing the<br />
NO2 concentration.<br />
2. The ability <strong>of</strong> the electrodes to convert NO2 had decreased during testing.<br />
Of course a combination <strong>of</strong> the two cases above could be a possibility as well.<br />
For the KNO3-impregnated sample a 51% increase in the polarisation resistance was observed. This<br />
increase was due to a combination <strong>of</strong> a resistance decrease for process 3 (related to TPB-<br />
processes) and a resistance increase for arc 4 (the NO2 conversion arc). From the SEM images it is<br />
clear a significant redistribution <strong>of</strong> the impregnated KNO3 has taken place, which may correlate<br />
with the decrease <strong>of</strong> the TPB resistance. The increase in the arc 4 resistance may be explained by<br />
point 1 or point 2 stated above.<br />
The SEM images reveal a clear change in the microstructure, when the images recorded on the<br />
MnOx-impregnated sample before and after testing are compared. The microstructural change,<br />
deterioration <strong>of</strong> the electrode grain surfaces and formation <strong>of</strong> round shaped particles, is obviously<br />
related to the polarisation <strong>of</strong> the electrode, as the same change in microstructure is not observed<br />
for cells which had only been heat treated as the tested samples. Lee et al. showed manganese<br />
ions in LSM lattice and interstitial sites were reduced to Mn 2+ under cathodic polarisation, which<br />
led to the formation <strong>of</strong> oxygen ion vacancies on the LSM electrode surface 156 . This, combined with<br />
high surface mobility <strong>of</strong> Mn 2+ ions, was by Jiang et al. used to explain the formation <strong>of</strong> sphere-like<br />
structures on LSM cathodes which had been polarised at 500 mA at 1000 °C in 3 hours 58 . A similar<br />
phenomenon could explain the changes in microstructure observed in this work: During the<br />
80
5 Improvement <strong>of</strong> LSM15-CGO10 electrodes for electrochemical removal <strong>of</strong> <strong>NOx</strong> by KNO3 and<br />
MnOx impregnation<br />
polarisation, the manganese ions in the impregnated MnOx may be reduced to Mn 2+ . If a large<br />
excess <strong>of</strong> manganese ions are present at the LSM surface, and they all are reduce to Mn 2+ , a large<br />
number <strong>of</strong> oxygen vacancies will be created in the LSM lattice. The diffusion <strong>of</strong> manganese ions<br />
and oxygen vacancies may lead to formation <strong>of</strong> sphere shaped particles and weakening <strong>of</strong> the<br />
bonding between the particles in the electrode similar to the observations made by Jiang et al. 58 .<br />
This could then explain both the change in microstructure observed on the SEM images and the<br />
reduced mechanical strength <strong>of</strong> the MnOx-impregnated cell after the electrochemical<br />
characterisation. On the MnOx-impregnated cells only subjected to the heat-treatment and not to<br />
the electrochemical testing, no trace <strong>of</strong> the impregnated MnOx was observed in the electrode,<br />
which looked like the electrode <strong>of</strong> the un-impregnated cell. This may be due to incorporation <strong>of</strong><br />
the impregnated MnOx-into the LSM <strong>of</strong> the electrode during the heat treatment.<br />
5.6 Conclusion<br />
Both EIS and cyclic voltammograms show impregnation with KNO3 introduce a <strong>NOx</strong>-storage<br />
process in the electrode; this storage process apparently takes places after NO2 has been formed<br />
catalytically on the electrode. Impregnation with MnOx does not introduce a <strong>NOx</strong>- storage process,<br />
but both the MnOx- and the KNO3-impregnation cause a significant decrease in the polarisation<br />
resistance <strong>of</strong> the electrodes in both 1000 ppm NO, 10% O2 and 1000 ppm NO + 10% O2. The<br />
decrease in polarisation resistance is caused both by a decrease in resistance <strong>of</strong> the processes<br />
related to the TPB, and a decrease in the resistance <strong>of</strong> the NO2 conversion process in the NO<br />
containing atmospheres. It is remarkable a general decrease in these resistances is observed with<br />
both impregnations, even though the microstructure <strong>of</strong> the two impregnations appears fairly<br />
different. The impregnated samples degrade significantly more than the non-impregnated<br />
samples during testing. Based on SEM images and literature it is concluded the increased<br />
degradation follows from redistribution <strong>of</strong> the impregnated compound during testing, and with<br />
respect to the MnOx-impregnated sample formation and diffusion <strong>of</strong> Mn 2+ and oxygen vacancies<br />
may explain the severe degradation observed.<br />
5.7 Acknowledgements<br />
This work was supported by the Danish Strategic Research Council under contract no. 09-065186.<br />
Technicians at the Fuel Cell and Solid State Chemistry Division, Technical University <strong>of</strong> Denmark,<br />
are thanked for invaluable help and advice.<br />
81
6 <strong>NOx</strong>-conversion on Porous LSF15-CGO10 Cell Stacks with KNO3 or K2O Impregnation<br />
6 <strong>NOx</strong>-conversion on Porous LSF15-CGO10 Cell Stacks with KNO3 or K2O<br />
Impregnation<br />
This chapter is the manuscript “<strong>NOx</strong>-conversion on Porous LSF15-CGO10 Cell Stacks with KNO3 or<br />
K2O impregnation” accepted for publication in Journal <strong>of</strong> Solid State Electrochemistry.<br />
6.1 Abstract<br />
In the present work it was investigated how addition <strong>of</strong> KNO3 or K2O affected the <strong>NOx</strong> conversion<br />
on LSF15-CGO10 (La0.85Sr15FeO3-Ce0.9Gd0.1O1.95) composite electrodes during polarisation. The<br />
LSF15-CGO10 electrodes were part <strong>of</strong> a porous 11-layer cell stack with alternating layers <strong>of</strong> LSF15-<br />
CGO10 electrodes and CGO10 electrolyte. The KNO3 was added to the electrodes by impregnation,<br />
and kept either as KNO3 in the electrode or thermally decomposed into K2O before testing. The cell<br />
stacks were tested in the temperature range 300-500 °C in 1000 ppm NO, 10% O2 and 1000 ppm<br />
NO + 10% O2. During testing the cells were characterized by electrochemical impedance<br />
spectroscopy (EIS) and the NO conversion was measured during polarization at -3 V for 2 h. The<br />
concentration <strong>of</strong> NO and NO2 was monitored by a chemiluminiscence detector, while the<br />
concentration <strong>of</strong> O2, N2 and N2O was detected on a mass spectrometer. A significant effect <strong>of</strong><br />
impregnation with KNO3 or K2O on the <strong>NOx</strong> conversion was observed. In 1000 ppm NO both<br />
impregnations caused an increased conversion <strong>of</strong> NO into N2 in the temperature range 300-400 °C<br />
with a current efficiency up to 73%. In 1000 ppm NO + 10% O2 no formation <strong>of</strong> N2 was observed<br />
during polarisation, but the impregnations altered the conversion between NO and NO2 on the<br />
electrodes. Both impregnations caused increased degradation <strong>of</strong> the cell stack, but the exact cause<br />
<strong>of</strong> the degradation has not been identified yet.<br />
6.2 Introduction<br />
<strong>NOx</strong> is an air pollutant which has a number <strong>of</strong> negative effects on human health and the<br />
environment, as <strong>NOx</strong> affects the respiratory system negatively, increase the formation <strong>of</strong> ozone at<br />
ground level, cause formation <strong>of</strong> acid rain, contribute to smog formation and also act as green<br />
house gas 11 . In gasoline vehicles <strong>NOx</strong> can be removed sufficiently from the exhaust by the Three-<br />
Way-Catalyst (TWC), but this catalyst does not work for diesel vehicles due to a higher oxygen<br />
content in diesel engine exhaust 108 . For this reason other technologies are used for <strong>NOx</strong>-removal<br />
82
6 <strong>NOx</strong>-conversion on Porous LSF15-CGO10 Cell Stacks with KNO3 or K2O Impregnation<br />
from diesel engine exhaust; the three most well-known technologies being selective catalytic<br />
<strong>reduction</strong> with urea (urea-SCR), selective catalytic <strong>reduction</strong> with hydrocarbons (HC-SCR) and the<br />
<strong>NOx</strong>-storage and <strong>reduction</strong> (NSR) catalyst 108 .<br />
An alternative technology under development for <strong>NOx</strong>-removal is electrochemical de<strong>NOx</strong> 109-111 ,<br />
which compared to the three aforementioned technologies has the advantage no extra reducing<br />
agents needs to be supplied, as the NO is reduced by electrons during polarisation. Pancharatnam<br />
et al. discovered in 1975 NO can be reduced to N2 during polarisation in absence <strong>of</strong> oxygen 22 and<br />
later it was discovered NO can also be reduced during polarisation in the presence <strong>of</strong> oxygen 24,26 ,<br />
which made electrochemical de<strong>NOx</strong> <strong>of</strong> interest for cleaning <strong>of</strong> oxygen containing exhaust gasses.<br />
Since then several studies have been carried out within electrochemical de<strong>NOx</strong> 27, 29, 34, 39, 44, 141, 144 ,<br />
however the main challenges in the development <strong>of</strong> electrochemical de<strong>NOx</strong> continues to be to<br />
achieve a sufficiently high activity and selectivity 111 . In this work it is attempted to improve the<br />
selectivity and activity <strong>of</strong> the LSF15-CGO10 composite electrodes for electrochemical de<strong>NOx</strong> by<br />
adding a <strong>NOx</strong>-storage compound, as known from NSR catalysis, to the electrodes.<br />
The addition <strong>of</strong> the <strong>NOx</strong>-storage compound to the electrodes is expected to improve the <strong>NOx</strong>,<br />
conversion by concentrating the <strong>NOx</strong> in the form <strong>of</strong> nitrates on the electrode surface. Promising<br />
results has so far been achieved with combining electrochemical de<strong>NOx</strong> and a <strong>NOx</strong> storage<br />
compound by Nagao et al. 141 and Hamamoto et al. 44 however in both cases the electrode<br />
contained platinum. Two important questions arises when adding a <strong>NOx</strong> storage compound to the<br />
electrodes used in this work: 1) As no platinum is present in the electrodes, will the electrode<br />
material itself be able to oxidize NO to NO2, as this step needs to precede the formation <strong>of</strong> nitrate<br />
on the storage compound? 2) How will the presence <strong>of</strong> a <strong>NOx</strong>-storage compound alter the<br />
electrode processes?<br />
With respect to question 1), Werchmeister et al. has shown electrochemical <strong>reduction</strong> <strong>of</strong> NO on<br />
LSM (La1-xSrxMnO3)-CGO, LSF-CGO and LSCF (La1-xSrxCo1-yFeyO3-δ)-CGO electrodes was preceded by<br />
catalytically formation <strong>of</strong> NO2 38, 39 . For this reason formation <strong>of</strong> nitrates for <strong>NOx</strong>-storage is likely<br />
possible, even when platinum is not present on the electrodes used for electrochemical de<strong>NOx</strong>.<br />
83
6 <strong>NOx</strong>-conversion on Porous LSF15-CGO10 Cell Stacks with KNO3 or K2O Impregnation<br />
Question 2) is not easy to answer but a suggestion can be made for the overall electrode<br />
processes, which may be useful to keep in mind during the later interpretation <strong>of</strong> the results. On a<br />
cell without a <strong>NOx</strong>-storage compound the expected electrode processes for electrochemical<br />
<strong>reduction</strong> <strong>of</strong> NO is:<br />
Cathode: NO + 2 e - → 0.5 N2 + O 2-<br />
Anode: O 2- → 0.5 O2 + 2 e -<br />
Note the equations above state the overall processes and do not take into account any catalytic<br />
formation <strong>of</strong> NO2. On the cathode a dominating, competing reaction to the <strong>reduction</strong> <strong>of</strong> NO is the<br />
<strong>reduction</strong> <strong>of</strong> O2: O2 + 4 e - → 2 O 2- .<br />
When a <strong>NOx</strong>-storage compound like K2O/KNO3 is added to the electrodes, one could imagine the<br />
electrode processes to become:<br />
Cathode: 2 KNO3 + 10 e - → K2O + N2 + 5 O 2-<br />
Anode: 4 NO2 + 2 K2O + 2 O 2- → 4 KNO3 + 4 e -<br />
However, the formation <strong>of</strong> KNO3 is not necessarily an electrochemical process as described in the<br />
anode equation above, but could just be a chemical reaction: 4 NO2 + 2 K2O + O2 → 4 KNO3 as in<br />
conventional NSR catalysis, in that case O2 could be supplied from oxidation <strong>of</strong> the O 2- at the<br />
anode or from the surrounding atmosphere. An improved performance for electrochemical de<strong>NOx</strong><br />
could eventually be gained by repeatedly changing the current direction through the cell, and<br />
thereby making the electrodes act alternately as cathodes and anodes, as shown by Hibino et al. 28<br />
and Hamamoto et al. 44 . However, such experiments were not made in this work, since the<br />
available test set-up did not allow for precise measurements <strong>of</strong> the effect <strong>of</strong> alternating<br />
polarisation on the gas composition.<br />
In this work three different LSF15-CGO10 cell stacks were tested with respect to conversion <strong>of</strong> <strong>NOx</strong><br />
in the temperature range 300-500 °C. The stacks were subjected to electrochemical impedance<br />
84<br />
6.1<br />
6.2<br />
6.3<br />
6.4
6 <strong>NOx</strong>-conversion on Porous LSF15-CGO10 Cell Stacks with KNO3 or K2O Impregnation<br />
spectroscopy and conversion/polarisation experiments while the gas composition was monitored<br />
by a mass spectrometer (MS) and a chemiluminiscense detector (CLD). The cell stacks differed<br />
from each other in the way they were impregnated: one stack had no impregnation, one stack was<br />
impregnated with KNO3 and one stack was impregnated with K2O. LSF was chosen as electrode<br />
material, since LSF as a mixed conductor 157,66 has been evaluated to be a promising material for<br />
intermediate temperate solid oxide electrodes 64 while CGO was chosen as an electrolyte, as CGO<br />
has superior oxygen ion-conductivity below 600 °C when compared to yttria stabilized zirconia 68 .<br />
KNO3/K2O was chosen for impregnation, as potassium is known to act both as a <strong>NOx</strong>-storage<br />
compound 72 and also to improve simultaneous <strong>NOx</strong> and soot removal 75, 76 , the latter being <strong>of</strong><br />
interest for future development <strong>of</strong> the electrochemical de<strong>NOx</strong> technique. With respect to the<br />
development <strong>of</strong> the electrochemical de<strong>NOx</strong> technique it must emphasized, the work presented in<br />
this paper is at the very early stage <strong>of</strong> the development process, and only deals with investigated<br />
materials ability to electrochemically convert <strong>NOx</strong> in model atmospheres containing only <strong>NOx</strong>, O2<br />
and Ar, even though real diesel exhaust also contain significant amounts <strong>of</strong> CO2 and H2O 7 . The<br />
presence <strong>of</strong> CO2 and H2O may influence the performance and degradation <strong>of</strong> the electrochemical<br />
de<strong>NOx</strong> electrodes. In that context it is important formation <strong>of</strong> stable carbonate species does not<br />
appear to be a problem on potassium containing catalysts in the presence <strong>of</strong> <strong>NOx</strong> 72, 158 , while the<br />
influence <strong>of</strong> H2O on the potassium impregnated LSF15-CGO10 electrodes is not clear and will have<br />
to be investigated in the future.<br />
6.3 Experimental<br />
6.3.1 Fabrication <strong>of</strong> porous cell stacks<br />
The cell stacks tested in this work were ceramic, porous cell stacks consisting <strong>of</strong> 11 alternating<br />
layers <strong>of</strong> electrode and electrolyte. The porous stack design was chosen for this work, as the large<br />
contact area between gas and cell in this design makes it easy to measure the NO-conversion.<br />
The electrode layers in the porous cell stacks were a LSF15-CGO10 composite with 65 wt% LSF15<br />
and 35 wt% CGO10. The LSF had been synthesized in house by the glycine-nitrate combustion<br />
synthesis 150 from nitrate solutions supplied by Alfa Aesar. The LSF15 was synthesized with the<br />
exact composition La0.84Sr0.149FeO3-δ. The CGO10 was supplied by Rhodia. For the fabrication <strong>of</strong> the<br />
composite electrode the LSF15 and CGO10 were mixed with solvent, binder, dispersant and<br />
85
6 <strong>NOx</strong>-conversion on Porous LSF15-CGO10 Cell Stacks with KNO3 or K2O Impregnation<br />
poreformer (graphite), ball milled and subsequent tapecasted. For more detailed information on<br />
the tapecasting procedure see He et al. 159 . The porous CGO electrolyte was tapecasted like the<br />
electrode tape and afterwards the green electrode and electrolyte tapes were laminated together<br />
with 6 electrode layers alternating with 5 electrolyte layers. Round cell stacks with a diameter <strong>of</strong><br />
18 mm were stamped out <strong>of</strong> the green laminated tapes and thereafter sintered at 1250 °C. During<br />
the sintering the graphite poreformer was burned <strong>of</strong>f leaving behind the pores in the stack. Before<br />
testing a porous Au current collector was applied to the cell stack by painting the outer electrodes<br />
with a gold paste containing 20 wt% carbon, and subsequent heat the cell stack to 800 °C to<br />
decompose the graphite. An image <strong>of</strong> the 11-layer cell stack with the porous current collector is<br />
shown in Figure 32.<br />
Figure 32. Cross-section <strong>of</strong> a non-impregnated LSF15-CGO10 cell stack. The six light grey layers are<br />
porous LSF15-CGO10 electrode layers, the 5 dark grey layers are porous CGO10 electrolyte layers<br />
and on each side <strong>of</strong> the cell stack the porous Au current collector is observed (only marked on the<br />
top side).<br />
6.3.2 Impregnation<br />
For impregnation <strong>of</strong> the cell stacks an aqueous solution <strong>of</strong> 3.1 M KNO3 (Alfa Aesar) was prepared.<br />
The solution also contained 10 wt% P123 (BASF) with respect to the water. The impregnation was<br />
made by covering the cell stack with impregnation solution and then placing the cell stack in a<br />
vacuum chamber and evacuate to a pressure below 0.1 mbar for approximately 15 s. Excess<br />
impregnation solution was wiped <strong>of</strong> the surface <strong>of</strong> the cell stack, and thereafter the cells were<br />
86
6 <strong>NOx</strong>-conversion on Porous LSF15-CGO10 Cell Stacks with KNO3 or K2O Impregnation<br />
heated to 350 °C to decompose the P123. The cell impregnated with K2O was prepared in exactly<br />
the same way, apart from the cell was heated to 700 °C to decompose the KNO3 into K2O.<br />
6.3.3 Test set-up<br />
For electrochemical cell testing the stack was mounted in between two alumina tubes, which<br />
contained channels for the gas flow and measurement probes for the electrochemical<br />
characterization. The cell and the alumina tubes were inclosed in a quartz tube and mounted<br />
vertically in a furnace. A sketch <strong>of</strong> the set-up is shown in Figure 33.<br />
Current<br />
collector<br />
Alumina<br />
tube<br />
Glass tube<br />
6.3.4 <strong>Electrochemical</strong> characterization<br />
A Gamry reference 600 potentiostat was used for the electrochemical characterization <strong>of</strong> the cell<br />
stack. <strong>Electrochemical</strong> impedance spectra were recorded in the frequency range 1 MHz to 0.001<br />
Hz with 36 mV rms amplitude and 6 points pr. decade. For the conversion experiments the cell<br />
stack was first kept at Open Circuit Voltage (OCV) for 2 h, then polarized at -3 V for 2 h, and<br />
afterwards left at OCV for 2 h again. The electrochemical characterization was made first at 300 °C,<br />
and then repeated for each 50 °C until 500 °C was reached. After this the cell was cooled down to<br />
300 °C, one EIS spectrum was recorded to evaluate the degradation during the cell test, and<br />
thereafter the test was finished.<br />
Gas in<br />
Gas out<br />
87<br />
Electrolyte<br />
Electrode<br />
Figure 33. Sketch <strong>of</strong> set-up for testing <strong>of</strong> porous cell stacks (reprinted with permission from<br />
Werchmeister et al. 13 .
6 <strong>NOx</strong>-conversion on Porous LSF15-CGO10 Cell Stacks with KNO3 or K2O Impregnation<br />
6.3.5 Conversion measurements<br />
The cell stack was supplied with NO, O2 and Ar from Brooks mass flow controllers. The conversion<br />
measurements were made in 1000 ppm NO and 1000 ppm NO + 10% O2 in both cases with<br />
balance Ar. These concentrations <strong>of</strong> NO and O2 were chosen as they resemble the concentrations<br />
which may be found in the exhaust from a diesel car 7 . The NO and NO2 content in the gas stream<br />
from the cell was monitored by a chemiluminiscense detector Model 42i High Level from Thermo<br />
Scientific; while the N2, N2O and O2 concentration was monitored by a mass spectrometer from<br />
Pfeiffer Vacuum, type Omnistar GSD 301.<br />
6.3.6 Scanning Electron Microscopy<br />
The cell stacks were examined in a Zeiss Supra 35 scanning electron microscope equipped with a<br />
field emission gun. SEM images were recorded in two ways: In order to obtain high magnification<br />
images <strong>of</strong> the electrode microstructure images were recorded with the in-lens detector and 3 keV<br />
acceleration voltage on cells just broken and put directly into the microscope. To get more overall<br />
images <strong>of</strong> the cell stacks and the different layers in the stacks a part <strong>of</strong> each stack was mounted in<br />
epoxy, polished and carbon coated prior to the microscopy investigation.<br />
6.4 Results and Discussion<br />
6.4.1 Microstructure <strong>of</strong> electrodes before and after testing<br />
Figure 34 shows the microstructure <strong>of</strong> the electrodes in the three different tested cell stacks. In<br />
the non-impregnated cell stack (Figure 34a) all the electrode grains appear to have a well-defined<br />
shape and very smooth surfaces. In the KNO3 impregnated cell stack (Figure 34b) the infiltrated<br />
KNO3 is present around in the electrode structure as lumps with a porous looking surface. The<br />
porous looking KNO3-surface is likely due to interaction between the electron-beam and the KNO3,<br />
as focusing the electron beam on the KNO3 altered the look <strong>of</strong> the KNO3 lumps. Figure 34b also<br />
shows even though the KNO3 is present as big lumps in the electrode, there is still open porosity<br />
left for the gas to pass through. The electrode <strong>of</strong> the cell stack which had been impregnated with<br />
KNO3 and subsequent heated to 700 °C to decompose the KNO3 into K2O is shown in Figure 34c. In<br />
the electrode KNO3 lumps are observed together with other irregular shaped K2O grains.<br />
88
6 <strong>NOx</strong>-conversion on Porous LSF15-CGO10 Cell Stacks with KNO3 or K2O Impregnation<br />
Figure 34. Microstructure <strong>of</strong> the electrode <strong>of</strong> a) a non-impregnated LSF15-CGO10 cell stack, b) cell<br />
stack impregnated with KNO3 and c) cell stack impregnated with KNO3 and subsequently heated to<br />
700 °C to decompose the KNO3 into K2O. White arrows point at impregnated KNO3 and black<br />
arrows on K2O.<br />
89
6 <strong>NOx</strong>-conversion on Porous LSF15-CGO10 Cell Stacks with KNO3 or K2O Impregnation<br />
Samples from before and after electrochemical cell testing were mounted in epoxy and examined<br />
in the microscope to obtain information about changes in the electrode microstructure during<br />
testing. No change due to the testing was observed on the non-impregnated sample. However,<br />
both the KNO3 impregnated sample and the K2O impregnated sample showed a significant change<br />
in microstructure after the testing. The change in microstructure is best described as the grain size<br />
had been reduced and/or the attachments between the electrode grains decreased. The change in<br />
microstructure was most pronounced in the outer electrodes <strong>of</strong> the cell stack and is illustrated in<br />
Figure 35 for the KNO3 impregnated sample.<br />
Figure 35. Outer electrode <strong>of</strong> KNO3 impregnated cell stack a) before electrochemical cell testing<br />
and b) after electrochemical cell testing.<br />
90
6 <strong>NOx</strong>-conversion on Porous LSF15-CGO10 Cell Stacks with KNO3 or K2O Impregnation<br />
6.4.2 Conversion and Current efficiency<br />
No purely catalytic effect <strong>of</strong> the KNO3 or K2O impregnation was detected, as no difference<br />
between the impregnated and non-impregnated cell stacks was observed in the outlet NO<br />
concentration, when the stacks before polarisation were flushed in either 1000 ppm NO or 1000<br />
ppm NO + 10% O2.<br />
In 1000 ppm NO zero conversion <strong>of</strong> <strong>NOx</strong> into N2 during 3 V polarisation for 2 h was observed at 300<br />
and 350 °C on the non-impregnated cell stack. However, from 400 °C to 500 °C the conversion into<br />
N2 increased from 4% to 43%, see Table 18. On the impregnated cell stacks <strong>NOx</strong> conversion in the<br />
range 2-17% was observed at 300-350 °C, which means higher <strong>NOx</strong> conversion was observed at<br />
low temperatures on the impregnated cell stacks compared to the non-impregnated cell stack. In<br />
contradiction to this the <strong>NOx</strong> conversion was lower on the impregnated cell stacks compared to<br />
the non-impregnated sample at higher temperatures. A significant decrease in <strong>NOx</strong> conversion on<br />
the KNO3 impregnated sample was observed from 350 °C to 400 °C.<br />
Table 18. <strong>NOx</strong> conversion [%] for a non-impregnated cell stack, a KNO3 impregnated cell stack and<br />
a K2O impregnated cell stack. a<br />
Temperature [ °C] Non-impregnated KNO3 imp. K2O imp.<br />
300 0 2 3<br />
350 0 17 15<br />
400 4 -1* 13<br />
450 15 3<br />
500 43<br />
a The cell stack was supplied with 1000 ppm NO and polarised at -3V for 2h. The stated values are the percentage <strong>of</strong> <strong>NOx</strong><br />
converted into N2.<br />
*-1% conversion <strong>of</strong> <strong>NOx</strong> into N2 corresponds in principle to conversion <strong>of</strong> N2 into <strong>NOx</strong>. But since this -1% corresponds to<br />
only 4 ppm N 2, it is considered to be within the general uncertainty <strong>of</strong> the experiment.<br />
91<br />
15
6 <strong>NOx</strong>-conversion on Porous LSF15-CGO10 Cell Stacks with KNO3 or K2O Impregnation<br />
The current efficiency during the 2 h polarisation was calculated according to Eq. 6.5:<br />
I<br />
Current efficiency =<br />
I<br />
92<br />
N 2<br />
applied<br />
⋅100%<br />
- where IN2 is the current corresponding to the <strong>reduction</strong> <strong>of</strong> NO into the N2, which was detected by<br />
the MS, and Iapplied is the current applied on the cell during the polarisation. In Table 19 the current<br />
efficiencies in the different tests are stated for the atmosphere with 1000 ppm NO in Ar. It is<br />
observed impregnation with KNO3 and K2O increases the current efficiencies in the temperature<br />
range 300-400 °C. Improved current efficiency at 500 °C is also observed for the K2O impregnated<br />
sample. The current not used for <strong>reduction</strong> <strong>of</strong> NO is used for the competing <strong>reduction</strong> <strong>of</strong> O2. The O2<br />
likely had been adsorbed on the cell stack during treatment in 10% O2 in between the polarisation<br />
experiments or originate from a small leak in the system, as 70-100 ppm O2,leak was measured by<br />
the MS while the sample was supplied with 1000 ppm NO in Ar.<br />
Table 19. Current efficiency [%] for a non-impregnated cell stack, a KNO3 impregnated cell stack<br />
and a K2O impregnated cell stack.*<br />
Temperature [ °C] Non-impregnated KNO3 imp. K2O imp.<br />
300 0 8 38<br />
350 0 59 73<br />
400 5 -8 37<br />
450 10 4<br />
500 11<br />
* The current efficiency is calculated according to Eq.(5). The cell stack was supplied with 1000 ppm NO in Ar and<br />
polarised at -3V for 2 h.<br />
In addition to conversion into N2 oxidation <strong>of</strong> NO into NO2 takes place during polarisation <strong>of</strong> the<br />
cell stacks in 1000 ppm NO. In Figure 36 it is illustrated how the conversion into NO2 is highest at<br />
300-400 °C for the impregnated cell stacks, whereas for the non-impregnated cell stack conversion<br />
into NO2 is only observed in the temperature range 400-500 °C. With respect to the non-<br />
impregnated cell stack a decrease in O2,leak was observed during polarisation/formation <strong>of</strong> NO2. The<br />
oxygen balance over the blank cell stack at all temperatures showed a deviation below 15 ppm O2,<br />
15<br />
6.5
6 <strong>NOx</strong>-conversion on Porous LSF15-CGO10 Cell Stacks with KNO3 or K2O Impregnation<br />
when comparing the concentrations <strong>of</strong> NO, NO2 and O2,leak before and during polarisation. For the<br />
impregnated cell stacks the oxygen balance showed in general an excess O2 concentration during<br />
polarisation (up to 100 ppm), indicating previously adsorbed O2 was released from the cell stack<br />
during polarisation.<br />
∆[NO 2 ] / [NO x ] unpol [%]<br />
25<br />
20<br />
15<br />
10<br />
5<br />
0<br />
250 300 350 400 450 500 550<br />
Temperature [°C]<br />
93<br />
non-imp.<br />
KNO 3 imp.<br />
K 2 O imp.<br />
Figure 36. Conversion <strong>of</strong> NO into NO2 relative to the <strong>NOx</strong> concentration before polarisation in 1000<br />
ppm NO. The cell stacks were polarized at 3 V for 2 h and the stacks were supplied with 1000 ppm<br />
NO in Ar. The dashed lines are for visual guidance only.<br />
When oxygen was present in the atmosphere, conversion <strong>of</strong> <strong>NOx</strong> into N2 was not observed for any<br />
<strong>of</strong> the samples. It should be noted even though the gas composition when oxygen was present in<br />
this article is stated as 1000 ppm NO + 10% O2 the actual concentration <strong>of</strong> NO was in the range<br />
700-900 ppm due to the equilibrium 2 NO + O2 2 NO2.<br />
Instead <strong>of</strong> <strong>reduction</strong> <strong>of</strong> <strong>NOx</strong> into N2 an increased conversion between NO and NO2 was observed<br />
on the samples during polarisation in oxygen containing atmospheres. A significant difference<br />
between the cell stack without impregnation and the impregnated stacks was observed: without<br />
impregnation NO was formed during polarisation due to conversion <strong>of</strong> NO2, whereas for the<br />
samples impregnated with KNO3 or K2O NO2 was formed during polarisation due to conversion <strong>of</strong><br />
NO. This is clear when Figure 37 and Figure 38 are compared, where Figure 37 shows the change in<br />
NO concentration during polarisation and Figure 38 shows the change in NO2 during polarisation,<br />
in both cases relative to the NO concentration before the samples were polarized. The current<br />
through the cell stacks was in the range 1-20 mA during the polarisation at -3V for both the non-<br />
impregnated and the impregnated cell stacks.
6 <strong>NOx</strong>-conversion on Porous LSF15-CGO10 Cell Stacks with KNO3 or K2O Impregnation<br />
∆[ΝΟ] / [ΝΟ x ] unpol [%]<br />
20<br />
10<br />
0<br />
-10<br />
-20<br />
-30<br />
-40<br />
-50<br />
K2O imp.<br />
-60<br />
250 300 350 400 450 500 550<br />
Temperature [°C]<br />
94<br />
non-imp.<br />
KNO 3 imp.<br />
Figure 37. Relative conversion <strong>of</strong> NO during 2 h polarisation at 3 V on non-impregnated and<br />
impregnated LSF cell stacks. Positive values correspond to formation <strong>of</strong> NO and negative values to<br />
removal <strong>of</strong> NO. The dashed lines are for visual guidance only.<br />
∆[ΝΟ 2 ] / [ΝΟ x ] unpol [%]<br />
100<br />
80<br />
60<br />
40<br />
20<br />
0<br />
-20<br />
250 300 350 400 450 500 550<br />
Temperature [°C]<br />
blank<br />
KNO 3 imp.<br />
K 2 O imp.<br />
Figure 38. Relative conversion <strong>of</strong> NO2 during 2 h polarisation at 3 V on non-impregnated and<br />
impregnated LSF cell stacks. Positive values correspond to formation <strong>of</strong> NO2 and negative values to<br />
removal <strong>of</strong> NO2. The dashed lines are for visual guidance only.
6 <strong>NOx</strong>-conversion on Porous LSF15-CGO10 Cell Stacks with KNO3 or K2O Impregnation<br />
The increased NO conversion due to the presence <strong>of</strong> potassium observed in this work is in<br />
agreement with results reported by Hamamoto et al. 44 . Hamamoto et al. 44 observed increased NO<br />
conversion and a decrease in the onset temperature when a potassium-containing adsorbent<br />
layer was added to a NiO-YSZ (nickel oxide-yttria stabilized zirconium oxide) or NiO-CGO based cell<br />
for electrochemical de<strong>NOx</strong>. Hamamoto et al. ascribed the increased performance to potassium’s<br />
ability to adsorb NO and also saw NO decomposition when oxygen was present, which was not<br />
observed in this work. The difference could be due to the LSF15-CGO10 electrode used in this<br />
work has a larger affinity for O2 <strong>reduction</strong> than the NiO-YSZ and NiO-CGO cell used by Hamamoto<br />
et al. Another explanation <strong>of</strong> the increased performance after addition <strong>of</strong> KNO3 and K2O may be<br />
the K act as promoter, a phenomenon well-known from heterogeneous catalysis 74 . However based<br />
on the results in this work it is not possible to distinguish whether the KNO3 and K2O mainly<br />
improves the performance by increasing the adsorption or by acting as promoters.<br />
With respect to the results obtained in 1000 ppm NO + 10% O2, it should be noted since the<br />
current densities are similar for both the non-impregnated cell stacks and the impregnated cell<br />
stacks, but the conversion from NO to NO2 is higher for the impregnated stacks, the effect <strong>of</strong> the<br />
K-species is not to generally increase the performance <strong>of</strong> the cell stacks, i.e. to increase both the<br />
O2 and the NO conversion, but specifically to increase the NO conversion.<br />
A clear observation in this work was increased NO2 concentrations during polarisation at the<br />
temperature range where the largest NO conversion was observed, i.e. in the high temperature<br />
range for the non-impregnated samples and in the low temperature range for the impregnated<br />
samples. For the non-impregnated electrodes this likely show just as <strong>reduction</strong> <strong>of</strong> NO into N2 on<br />
the cathodes increases with temperature, so does the oxidation <strong>of</strong> NO into NO2 on the anodes <strong>of</strong><br />
the cell stack. One may speculate if the effect <strong>of</strong> the KNO3 and K2O on the impregnated electrodes<br />
only is to act as an <strong>NOx</strong> adsorbent, or if KNO3 and K2O may also facilitate the catalytic formation <strong>of</strong><br />
NO2, thereby increasing the total <strong>NOx</strong> removal by increasing the concentration <strong>of</strong> the intermediate<br />
NO2. This is <strong>of</strong> interest since NO2 has been identified as an important intermediate for<br />
electrochemical <strong>reduction</strong> <strong>of</strong> <strong>NOx</strong> by Werchmeister et al. 36, 38 . However, according to literature K-<br />
compounds are very poor in catalyzing the oxidation <strong>of</strong> NO to NO2 160 . The most likely explanation<br />
<strong>of</strong> the increased NO2 level in the low temperature range for the impregnated samples is due to<br />
95
6 <strong>NOx</strong>-conversion on Porous LSF15-CGO10 Cell Stacks with KNO3 or K2O Impregnation<br />
release <strong>of</strong> NO2 during the <strong>reduction</strong> <strong>of</strong> the KNO3-storage compound, as <strong>NOx</strong> release is also<br />
observed for conventional NSR catalysts during the <strong>reduction</strong> cycle 161 .<br />
The results from the conversion measurements show at 350 °C a marked jump in the activity and<br />
the current efficiency for the impregnated cells stacks. 350 °C is above the melting point <strong>of</strong> KNO3<br />
(m.p. 334 °C 97 ) and the better performance at 350 °C may for this reason be due to the presence <strong>of</strong><br />
molten KNO3, which may increase the performance by being more mobile compared to solid KNO3.<br />
The performance decrease from 350 °C to higher temperatures may be due to the degradation<br />
phenomena which also caused the degradation <strong>of</strong> the electrode microstructure as observed on<br />
the SEM images.<br />
6.4.3 Effect <strong>of</strong> impregnation on serial and polarisation resistance<br />
The impedance spectra <strong>of</strong> the non-impregnated cell stack were fitted with the equivalent circuit<br />
Rs(R1Q1)(R2Q2)(R3Q3), where R is a resistance and Q a constant phase element. For the impregnated<br />
cell stacks the same equivalent circuit was used, apart from for some spectra a fourth (RQ)<br />
element had to be included in order to obtain a satisfactory fit. Representative examples <strong>of</strong><br />
impedance spectra and their deconvolution are shown in Figure 39 to Figure 41 for the three<br />
different samples.<br />
-Z'' [Ω cm 2 ]<br />
400<br />
300<br />
200<br />
100<br />
0<br />
Arc 1<br />
20 Hz<br />
Arc 2<br />
2 Hz<br />
0 200 400 600 800 1000 1200 1400 1600 1800<br />
Z' [Ωcm 2 ]<br />
96<br />
Arc 3<br />
0.2 Hz<br />
0.02 Hz<br />
Figure 39. Impedance spectrum recorded in 1000 ppm NO + 10% O2 at 400 °C on non-impregnated<br />
cell stack. The solid line represents the deconvolution <strong>of</strong> the entire spectrum and the dashed lines<br />
the deconvolution <strong>of</strong> the individual processes. For solid points the frequency <strong>of</strong> the data point is<br />
stated.
6 <strong>NOx</strong>-conversion on Porous LSF15-CGO10 Cell Stacks with KNO3 or K2O Impregnation<br />
-Z'' [Ω cm 2 ]<br />
1600<br />
1200<br />
0.2 Hz<br />
0.02 Hz<br />
800 Arc 1<br />
400<br />
0<br />
2 Hz<br />
Arc 2<br />
Arc 3<br />
0.002 Hz<br />
0 1000 2000 3000 4000 5000<br />
Z' [Ωcm 2 ]<br />
Figure 40. Impedance spectrum recorded in 1000 ppm NO + 10% O2 at 400 °C on KNO3<br />
impregnated cell stack. The solid line represents the deconvolution <strong>of</strong> the entire spectrum and the<br />
dashed lines the deconvolution <strong>of</strong> the individual processes. For solid points the frequency <strong>of</strong> the<br />
data point is stated.<br />
-Z'' [Ω cm 2 ]<br />
200<br />
150<br />
100<br />
50<br />
0<br />
Arc 1<br />
and<br />
Arc 2<br />
2 Hz<br />
Arc 3<br />
0.2 Hz<br />
0 100 200 300 400 500 600 700<br />
Z' [Ωcm 2 ]<br />
97<br />
Arc 4<br />
0.02 Hz<br />
0.002 Hz<br />
Figure 41. Impedance spectrum recorded in 1000 ppm NO + 10% O2 at 400 °C on K2O impregnated<br />
cell stack. The solid line represents the deconvolution <strong>of</strong> the entire spectrum and the dashed lines<br />
the deconvolution <strong>of</strong> the individual processes. For solid points the frequency <strong>of</strong> the data point is<br />
stated.<br />
The serial resistance (Rs) and polarisation resistance (Rp) obtained from the fitting are stated in<br />
Table 20. In general the serial resistances <strong>of</strong> the impregnated stacks are lower than for the non-<br />
impregnated stacks at low temperatures, but higher than for the non-impregnated stacks at higher<br />
temperatures.
6 <strong>NOx</strong>-conversion on Porous LSF15-CGO10 Cell Stacks with KNO3 or K2O Impregnation<br />
Table 20 Serial resistance (Rs) and polarisation resistance (Rp) for three LSF15-CGO10 porous cell<br />
stacks without impregnation (“non-impregnated”), with KNO3 impregnation and with K2O<br />
impregnation. *<br />
Rs [Ωcm 2 ]<br />
98<br />
Rp [Ωcm 2 ]<br />
Temp. [°C] Non-imp. KNO3 imp. K2O imp. Non-imp. KNO3 imp. K2O imp.<br />
300 140 110 100 5700<br />
350 47 110 31 3200<br />
400 19 64 20 1700 4300 630<br />
450 11 110 16 920 780 190<br />
500 8 40 15 420 210 250<br />
300(post) ’<br />
1700<br />
140 810 1000 9700 24000 23000<br />
* The cell stacks were supplied with 1000 ppm NO + 10% O2 while the EIS spectra were recorded.<br />
‘ 300(post) refers to the impedance spectra recorded at the end <strong>of</strong> the experiment, i.e. after temperature variations and<br />
polarisation experiments had been performed.<br />
A possible explanation <strong>of</strong> the lower serial resistance for the impregnated cell stacks at low<br />
temperatures could be improved sintering <strong>of</strong> the stack due to the presence <strong>of</strong> potassium 162, 163 , or<br />
establishment <strong>of</strong> an easier current pathway through some part <strong>of</strong> the cell stack. The latter point<br />
follows from the conductivities <strong>of</strong> CGO being ≈0.001 S/cm at 350 °C 68 while the conductivity <strong>of</strong> the<br />
molten KNO3 at 350 °C is 0.699 S/cm 164 , which means at 350 °C the reduced serial resistance<br />
observed for the KNO3 impregnated sample may be explained by the current passing through the<br />
KNO3 instead <strong>of</strong> the CGO electrolyte. Unfortunately it has despite <strong>of</strong> extensive search not been<br />
possible to find information on the conductivity <strong>of</strong> K2O and solid KNO3 at 300 °C, for this reason it<br />
cannot be estimated here, if an alternative current path is a realistic explanation <strong>of</strong> the reduced<br />
serial resistance observed on the impregnated cell stacks at 300 °C. It is also noticed, while the<br />
serial resistance <strong>of</strong> the non-impregnated cell stacks is almost unchanged from the beginning to the<br />
end <strong>of</strong> the cell test, the serial resistance <strong>of</strong> the impregnated samples increases by a factor 8-10.<br />
With respect to the polarisation resistance missing values in Table 20 for the impregnated samples<br />
are due to poor quality <strong>of</strong> the impedance spectra recorded at low temperatures. With one<br />
exception the polarisation resistance during the cell test is always lower on the impregnated cell
6 <strong>NOx</strong>-conversion on Porous LSF15-CGO10 Cell Stacks with KNO3 or K2O Impregnation<br />
stacks compared to the non-impregnated cell stack. The polarisation resistance <strong>of</strong> the K2O<br />
impregnated sample is between 40 and 80% smaller than the polarisation resistance <strong>of</strong> the non-<br />
impregnated cell, even though from 450 °C to 500 °C the polarisation resistance <strong>of</strong> the K2O<br />
impregnated sample starts to increase. With respect to the polarisation resistance at 300 °C after<br />
the test, the resistance <strong>of</strong> both the impregnated cell stacks is more than twice the polarisation<br />
resistance <strong>of</strong> the non-impregnated cell stack.<br />
The impedance results are consistent with the results from the conversion measurements and the<br />
SEM images, as they show the impregnations increases the electrochemical performance <strong>of</strong> the<br />
cell stacks, but also causes severe degradation. The degradation causes the pronounced increased<br />
in Rs and Rp from the beginning to the end <strong>of</strong> the test, and is related to the breakdown <strong>of</strong> the<br />
electrode microstructure observed on the SEM images. Due to the degradation problems it was<br />
not possible to identify the processes contributing to the polarisation resistance <strong>of</strong> the<br />
impregnated cell stacks. However for the non-impregnated cell stack some <strong>of</strong> the processes could<br />
be identified, as described in the following.<br />
6.4.4 <strong>Electrochemical</strong> processes in the non-impregnated cell stack<br />
As previously mentioned, the impedance spectra recorded in 1000 ppm NO+ 10% O2 could be<br />
fitted with the equivalent circuit Rs(R1Q1)(R2Q2)(R3Q3). The process located at the highest<br />
frequency and fitted by the subcircuit (R1Q1) had the activation energy 1 eV and a near-equivalent<br />
capacitance <strong>of</strong> 2×10 -8 F/cm 2 , the near-equivalent capacitance remains constant with temperature.<br />
This process was recognized in spectra recorded in all the tree different atmospheres: 1000 ppm<br />
NO + 10% O2, 1000 ppm NO and in 10% O2. The independency on the atmosphere combined with<br />
the size <strong>of</strong> the activation energy identifies the arc as belonging to intrinsic processes in the cell<br />
stack, like oxygen ion transport in the electrolyte and across the electrolyte electrode interface 54 .<br />
The process located in the middle frequency region in 1000 ppm NO + 10% O2 has the activation<br />
energy 0.57 eV. The near-equivalent capacitance associated with the process increases with<br />
temperature, from 1.7×10 -5 F/cm 2 at 300 °C to 5.2×10 -5 F/cm 2 at 500 °C. In 10% O2 the<br />
characteristics <strong>of</strong> the middle frequency arc were similar, but not totally identical to in 1000 ppm<br />
NO +10% O2. In 10% O2 the arc had the activation energy 0.67 eV and the capacitance increased<br />
with temperature, but a little less steeply compared to in 1000 ppm NO + 10% O2. The fact that the<br />
99
6 <strong>NOx</strong>-conversion on Porous LSF15-CGO10 Cell Stacks with KNO3 or K2O Impregnation<br />
middle frequency arc depends on the atmosphere indicates the arc may be related to processes<br />
like adsorption, diffusion and charge transfer at or near the triple-phase boundary (TPB) 54 . This<br />
also correlates well with the temperature dependency observed for the capacitance, as increasing<br />
temperature will increase the TPB zone and thereby increase the associated capacitance. It should<br />
be noted the activation energy in 1000 ppm NO + 10% O2 is in good agreement with the activation<br />
energies reported by Werchmeister et al. for the TPB process in 1% NO on LSF/CGO electrodes 38 .<br />
In contradiction to this the activation energy 0.67 eV found in 10% O2 is considerably below the<br />
activation energy observed by Werchemister et al. in air, where the activation energies was in the<br />
range 1.2-1.5 eV 38 .<br />
The process located at the lowest frequency has the activation energy 0.52 eV in 1000 ppm NO +<br />
10% O2, and 0.20 eV in 10% O2. The large discrepancy between the two activation energies<br />
indicate this arc represent two different processes depending on whether NO is present in the<br />
atmosphere or not. The lack <strong>of</strong> temperature dependency for the process in 10% O2 combined with<br />
the appearance at the lowest frequencies in the spectrum indicates this process could be related<br />
to gas phase diffusion 54 . The low frequency process when NO is present is likely not a gas phase<br />
diffusion process due to the relatively high activation energy observed. In the work by<br />
Werchmeister et al. 38 the arc observed at the lowest frequencies in NO containing atmospheres<br />
was ascribed to conversion <strong>of</strong> intermediately formed NO2. However, for this NO2 conversion arc a<br />
low activation energy in the range 0.2-0.3 eV was reported, which makes it unlikely the arc<br />
observed in this work is an NO2 conversion arc. The best explanation <strong>of</strong> the low frequency arc is so<br />
far it is related to one <strong>of</strong> the processes dissociative adsorption, surface diffusion and charge<br />
transfer at or near the TPB. One or more <strong>of</strong> these processes were also expected to account for the<br />
middle frequency process observed in this work. It is interesting to note the activation energies<br />
0.57 eV and 0.52 eV found in this work for the middle and low frequency process respectively, are<br />
in good agreement with the activation energies observed by Werchmeister et al. for the TPB<br />
related processes on LSF and LSCF electrodes.<br />
100
6 <strong>NOx</strong>-conversion on Porous LSF15-CGO10 Cell Stacks with KNO3 or K2O Impregnation<br />
6.5 Conclusion<br />
In the present work the effect <strong>of</strong> KNO3 and K2O impregnation on the <strong>NOx</strong>-conversion on LSF15-<br />
CGO10 electrodes was investigated. In an atmosphere only containing 1000 ppm NO in Ar<br />
impregnation with KNO3 and K2O increased the conversion <strong>of</strong> NO significantly in the temperature<br />
range 300-350 °C. Increased NO2 concentration was observed in the temperature range where the<br />
cell stacks were most active, i.e. for the impregnated cell stacks the highest NO2 concentrations<br />
were observed in the low temperature range, and for the non-impregnated cell stack the highest<br />
NO2 concentrations were observed in the high temperature range.<br />
When oxygen was present in the atmosphere together with the NO neither the non-impregnated<br />
nor the impregnated cell stacks were able to convert <strong>NOx</strong> into N2. However a marked difference<br />
was observed between the non-impregnated and the impregnated cell stacks in 1000 ppm NO +<br />
10% O2: Whereas the non-impregnated cell stack converted NO into NO2 under polarisation the<br />
impregnated cell stacks converted NO2 into NO under polarisation.<br />
The impregnation with KNO3 and K2O overall decreased the polarisation resistance <strong>of</strong> the cell<br />
stacks, but also introduced severe degradation problems into the stack, as breakdown <strong>of</strong> the<br />
electrode microstructure was observed. Due to the degradation it was not possible to identify the<br />
processes contributing to the polarisation resistance <strong>of</strong> the impregnated stacks. However for the<br />
non-impregnated stack oxygen-ion transport and TPB related processes were found to dominate<br />
the polarisation resistance in 1000 ppm NO + 10% O2.<br />
Further experiments are needed to clarify, how KNO3 and K2O impregnation affects the <strong>NOx</strong><br />
conversion under polarisation, among this the role <strong>of</strong> NO2 in the reaction mechanism. Also the<br />
exact cause <strong>of</strong> the increased degradation observed on impregnated samples is currently not well-<br />
understood.<br />
6.6 Acknowledgements<br />
This work was supported by the Danish Strategic Research Council under contract no. 09-065183.<br />
Colleagues at the Fuel Cell and Solid State Chemistry Division, Technical University <strong>of</strong> Denmark, are<br />
thanked for help and fruitful discussions.<br />
101
7 <strong>NOx</strong>-conversion on LSF15-CGO10 cell stacks with BaO impregnation<br />
7 <strong>NOx</strong>-conversion on LSF15-CGO10 cell stacks with BaO impregnation<br />
This chapter deals as the previous chapter with results obtained during measurements on porous<br />
LSF15-CGO10 cell stacks. Whereas the previous chapter dealt with the effect <strong>of</strong> K2O-impregnation<br />
on the <strong>NOx</strong> conversion, the present chapter deals with the effect <strong>of</strong> BaO impregnation on the <strong>NOx</strong>-<br />
conversion. Results from tests on two BaO-impregnated stacks (B1 and B2) are reported. For<br />
comparison results from a non-impregnated stack (N1) are also reported. The results for the non-<br />
impregnated cell stack were also described in the previous chapter, but are in this chapter<br />
repeated to clarify the effect <strong>of</strong> the BaO-impregnation.<br />
7.1 Experimental<br />
7.1.1 Cell stack fabrication and impregnation<br />
As the cell stacks described in this chapter essentially are the same as the cell stacks described in<br />
the previous chapter the reader is referred to chapter 6 for information on the fabrication <strong>of</strong> the<br />
stacks. For impregnation <strong>of</strong> the porous cell stacks with BaO a 0.3 M aqueous Ba(NO3)2 (Merck)<br />
solution with 10 wt% P123 (BASF) was prepared. The cell stacks were covered with the Ba(NO3)2<br />
solution and put under vacuum for ≈10 s, whereafter excess impregnation solution was wiped <strong>of</strong><br />
the surface. The impregnated cell stacks were then heated to 700 °C for 1 h to decompose the<br />
Ba(NO3)2 into BaO, and the final BaO load on the tested cell stacks was 1.7±0.1 wt%.<br />
7.1.2 <strong>Electrochemical</strong> testing and conversion measurements<br />
The electrochemical testing and conversions measurements performed on the BaO impregnated<br />
LSF15-CGO10 cell stacks were essentially the same as the measurements performed on the K2O<br />
impregnated cell stacks described in the previous chapter. In short, conversion measurements<br />
were made with 3V polarisation in the temperature range 300-500 °C in 1000 ppm NO and 1000<br />
ppm NO + 10% O2. The conversion measurements were supplemented by an extensive impedance<br />
analysis with variation in gas compositions and flow rates to allow for identification <strong>of</strong> the<br />
processes contributing to the polarisation resistance <strong>of</strong> the BaO impregnated stacks. For a detailed<br />
description <strong>of</strong> how the electrochemical testing and conversion measurements were performed the<br />
reader is referred to chapter 6.<br />
102
7.1.3 SEM<br />
7 <strong>NOx</strong>-conversion on LSF15-CGO10 cell stacks with BaO impregnation<br />
Before and after testing the cell stacks were examined in a Zeiss Supra 35 scanning electron<br />
microscope. In order to obtain high magnification images <strong>of</strong> the electrode microstructure images<br />
were recorded with the in-lens detector and 3 keV acceleration voltage on cells just broken and<br />
put directly into the microscope.<br />
7.2 Results<br />
7.2.1 Conversion and current efficiencies<br />
In Table 21 and Table 22 the <strong>NOx</strong> conversion to N2 and the current efficiency are stated for the<br />
conversion measurements performed in 1000 ppm NO. The <strong>NOx</strong> conversion in the temperature<br />
range 350-450 °C is higher on the BaO impregnated stacks compared to the non-impregnated<br />
stack, whereas at 500 °C one BaO impregnated stack (B1) shows a much lower and the other (B2) a<br />
much higher <strong>NOx</strong>-conversion compared to the non-impregnated stack. With respect to the current<br />
efficiency an increased efficiency is observed on the BaO impregnated stacks at 350-400 °C, while<br />
at higher temperatures the BaO impregnated stacks show in three measurements out <strong>of</strong> four<br />
measurements a lower current efficiency compared to the non-impregnated stack. It is noted, that<br />
B1 which had the lowest <strong>NOx</strong> conversion at 500 °C, at the same temperature had the highest<br />
current efficiency when compared to the other stacks.<br />
Table 21. <strong>NOx</strong> conversion to N2 [%] during 2 h polarisation in 1000 ppm NO on non-impregnated<br />
(N1) and BaO impregnated (B1, B2) LSF15-CGO10 cell stacks.<br />
Temperature [°C] N1 B1 B2<br />
300 0 0 0<br />
350 0 6 2<br />
400 4 19 6<br />
450 15 75 41<br />
500 43 9 67<br />
103
7 <strong>NOx</strong>-conversion on LSF15-CGO10 cell stacks with BaO impregnation<br />
Table 22. Current efficiency [%] during 2 h polarisation in 1000 ppm NO on non-impregnated (N1)<br />
and BaO impregnated (B1, B2) LSF15-CGO10 cell stacks.<br />
Temperature [°C] N1 B1 B2<br />
300 0 0 0<br />
350 0 18 9<br />
400 5 22 19<br />
450 10 7 5<br />
500 11 15 5<br />
When 10% oxygen was present in the gas with 1000 ppm NO, formation <strong>of</strong> N2 was in no cases<br />
observed during 3 V polarisation. Apparently the polarisation caused a slight conversion between<br />
NO and NO2, which on both the non-impregnated stack and the BaO-impregnated stacks resulted<br />
in NO2 being converted into NO, as seen when Figure 42 and Figure 43 are compared.<br />
∆[NO]/[NO x ] unpol [%]<br />
20<br />
18<br />
16<br />
14<br />
12<br />
10<br />
8<br />
6<br />
4<br />
2<br />
N1<br />
B1<br />
B2<br />
250 300 350 400 450 500 550<br />
Temp. [°C]<br />
Figure 42. NO conversion during polarisation relative to the total <strong>NOx</strong> concentration before<br />
polarisation in 1000 ppm NO + 10% O2. The positive values mean NO is formed.<br />
104
7 <strong>NOx</strong>-conversion on LSF15-CGO10 cell stacks with BaO impregnation<br />
∆[NO 2 ]/[NO x ] unpol [%]<br />
6<br />
4<br />
2<br />
0<br />
-2<br />
-4<br />
-6<br />
-8<br />
-10<br />
-12<br />
N1<br />
B1<br />
B2<br />
250 300 350 400 450 500 550<br />
Temp. [°C]<br />
Figure 43. NO2 conversion during polarisation relative to the total <strong>NOx</strong> concentration before<br />
polarisation in 1000 ppm NO + 10% O2. Negative values means NO2 is removed.<br />
7.2.2 SEM<br />
Figure 44 shows the electrodes <strong>of</strong> a non-impregnated LSF15-CGO10 stack before and after test.<br />
Before test all the electrodes in the stack appeared as in Figure 44a, with very well-defined grains<br />
and smooth grain surfaces. After test the microstructure <strong>of</strong> the middle electrodes was unchanged<br />
(Figure 44b), while on the outer-electrodes nano-particles (20nm) on the electrode grains (Figure 45a). There seemed to be some tendency<br />
for the BaO particles to have a preferred orientation on the electrode grains. After test the<br />
microstructure <strong>of</strong> the electrodes was significantly altered (Figure 45b and Figure 45c). The<br />
microstructure <strong>of</strong> the electrodes was not the same for all the electrodes in the stack. In Figure 45b<br />
one <strong>of</strong> the outer electrodes is shown, and a very pr<strong>of</strong>ound change in microstructure is observed,<br />
as all the electrode grains appears more or less “covered” in a rugged layer. On the other outer<br />
electrode <strong>of</strong> the same cell stack, see Figure 45c, the change in microstructure appears less<br />
dramatic, as only some <strong>of</strong> the electrode grains appear to be covered by nanometer sized particles.<br />
In contrast to the microstructure <strong>of</strong> the two outer electrodes in the tested cell stack, the middle<br />
electrode <strong>of</strong> the cell stacks appeared similar to the electrodes on the non-impregnated and<br />
untested cell stack.<br />
105
7 <strong>NOx</strong>-conversion on LSF15-CGO10 cell stacks with BaO impregnation<br />
Figure 44. SEM images <strong>of</strong> non-impregnated LSF15-CGO10 electrodes a) outer electrode before test<br />
b) middle electrode after test and c) outer electrode after test.<br />
106
7 <strong>NOx</strong>-conversion on LSF15-CGO10 cell stacks with BaO impregnation<br />
Figure 45. Electrodes <strong>of</strong> BaO impregnated LSF15-CGO10 electrodes a) before test b) outer<br />
electrode after test c) outer electrode on the other side after test.<br />
107
7.2.3 Impedance<br />
7 <strong>NOx</strong>-conversion on LSF15-CGO10 cell stacks with BaO impregnation<br />
Impedance spectra <strong>of</strong> both non-impregnated and BaO impregnated cell stacks were fitted with the<br />
equivalent circuit Rs(R1Q1)(R2Q2)(R3Q3) using the fitting s<strong>of</strong>tware ZView Vers. 3.2 107 . In the<br />
equivalent circuit R represents a resistance and Q a constant phase element. In Table 23 the serial<br />
resistance and total polarisation resistance obtained from the fitting are stated. The serial<br />
resistances are fairly alike for all the cell stacks, with the one exception that the BaO impregnated<br />
cell stacks at 300 °C in the beginning <strong>of</strong> the test had a serial resistance higher when compared to<br />
the non-impregnated cell stack, while at 300 °C in the end <strong>of</strong> the test the situation is the opposite:<br />
the serial resistance <strong>of</strong> the BaO impregnated cell stacks is in the end significantly lower compared<br />
to the non-impregnated stack. With respect to the polarisation resistance the two BaO<br />
impregnated cell stacks shows a quite different behaviour at the beginning <strong>of</strong> the test, one <strong>of</strong> the<br />
stacks (B1) has a polarisation resistance much larger than the polarisation resistance <strong>of</strong> the non-<br />
impregnated cell stack, while the other one (B2) has a polarisation resistance only slightly larger<br />
compared to the non-impregnated stack. When the temperature is increased to 400 °C and higher,<br />
the polarisation resistance <strong>of</strong> the BaO impregnated cell stacks become significantly smaller than<br />
the polarisation resistance <strong>of</strong> the non-impregnated cell stack. At 300 °C in the end <strong>of</strong> the test both<br />
the BaO impregnated stacks had a polarisation resistance lower that the non-impregnated cell<br />
stacks, contrary to in the beginning.<br />
Table 23. Serial resistance (Rs) and polarisation resistance (Rp) in Ωcm 2 for a non-impregnated<br />
stack (N1) and for two BaO-impregnated (B1, B2) LSF15-CGO10 cell stacks subjected to 1000 ppm<br />
NO + 10% O2. Values are stated determined at 300 °C in the beginning <strong>of</strong> the test and at the end <strong>of</strong><br />
the test, the latter labelled 300(post).<br />
Rs<br />
Temp. N1 B1 B2 N1 B1 B2<br />
300 140 190 180 5700 19000 6400<br />
350 47 60 37 3200 7000 2100<br />
400 19 14 14 1700 1000 960<br />
450 11 6 7 920 400 280<br />
500 8 9 4 420 160 48<br />
300(post) 140 34 84 9700 7500 8200<br />
108<br />
Rp
7 <strong>NOx</strong>-conversion on LSF15-CGO10 cell stacks with BaO impregnation<br />
In order to investigate, if the difference in polarisation resistance between the non-impregnated<br />
and BaO impregnated cell stacks was due to a difference in one specific process, Arrhenius plots<br />
were made for each <strong>of</strong> the three processes contributing to the polarisation resistance, see Figure<br />
46, Figure 47 and Figure 48. From the Figure 46 it is observed, that the resistance <strong>of</strong> process 1<br />
located at the highest frequencies is lower for the BaO-impregnated cell stacks over almost the<br />
entire temperature range, with 500 °C as the one exception. When Figure 47 and Figure 48 are<br />
compared to Table 23 it is observed, the higher polarisation resistance <strong>of</strong> the BaO impregnated<br />
stacks at low temperatures can be attributed to a higher resistance in the process located at the<br />
lowest frequencies (process 3), while the smaller polarisation resistance observed at higher<br />
temperatures is due to a lower resistance <strong>of</strong> both the middle frequency process (process 2) and<br />
the low frequency process (process 3) .<br />
Figure 46. Arrhenius plot <strong>of</strong> high frequency arc (Arc 1) resistance in 1000 ppm NO +10% O2.<br />
109
7 <strong>NOx</strong>-conversion on LSF15-CGO10 cell stacks with BaO impregnation<br />
Figure 47. Arrhenius plot <strong>of</strong> middle frequency arc (Arc 2) resistance in 1000 ppm NO + 10% O2.<br />
Figure 48. Arrhenius plot <strong>of</strong> low frequency arc (Arc 3) resistance in 1000 ppm NO + 10% O2.<br />
In order to characterize the processes contributing to the polarisation resistance further,<br />
impedance spectra were recorded while the “standard” atmosphere 1000 ppm NO + 10% O2 was<br />
varied, first by varying the NO content between 1500 ppm NO and 500 ppm NO, and then by<br />
varying the O2 content between 5% and 15%. Furthermore the flowrate was varied from the<br />
“standard” 2 L/h to 2.5 and 3 L/h and impedance spectra were also recorded during current load.<br />
110
7 <strong>NOx</strong>-conversion on LSF15-CGO10 cell stacks with BaO impregnation<br />
These experiments were performed at 300 °C and the characteristics found for the individual<br />
processes are stated in Table 24. Furthermore impedance spectra recorded at OCV and under<br />
current load are shown in Figure 49. The characteristics <strong>of</strong> the individual processes and a possible<br />
identification <strong>of</strong> the processes will be discussed in the Discussion section.<br />
Table 24. Characteristics <strong>of</strong> the three processes contributing to the polarisation resistance <strong>of</strong> BaO-<br />
impregnated cell stacks in 1000 ppm NO + 10% O2. The stated frequency range covers the<br />
temperature range 300-500 °C. The dependency <strong>of</strong> R and Cω on pO2, pNO and polarisation was<br />
only investigated at 300 °C.<br />
Proces Freq. range Charactistic<br />
1 15000->1MHz - Cω temperature independent<br />
- R dependent on pO2 (decrease with decreasing pO2)<br />
- R dependent on pNO (decrease with decreasing pNO)<br />
- Cω dependent on pO2 and pNO (increase with decreasing pO2/pNO)<br />
2 0.1-30 Hz - Cω increases with temperature<br />
- Cω dependent on pO2 and pNO (increase with decreasing pO2/pNO)<br />
- R dependent on pO2 (increase with decreasing pO2)<br />
- R dependent on pNO (increase with decreasing pNO)<br />
3 0.01-0.1 Hz - Cω increases with temp. (B1) or show no clear temp. dependency (B2)<br />
- R dependent on pNO (increase with decreasing pNO)<br />
- R decreases with polarisation<br />
Figure 49. Impedance spectra recorded at OCV before and after polarisation, and during<br />
polarisation in 1000 ppm NO + 10% O2 on BaO impregnated LSF15-CGO10 cell stack. The<br />
frequencies are stated for the filled symbols.<br />
111
7.3 Discussion<br />
7 <strong>NOx</strong>-conversion on LSF15-CGO10 cell stacks with BaO impregnation<br />
7.3.1 Stability <strong>of</strong> the serial resistance<br />
A discrepancy between the serial resistance <strong>of</strong> the non-impregnated cell stack and the BaO-<br />
impregnated cell stacks was observed at the beginning <strong>of</strong> the tests. Since both the non-<br />
impregnated and the BaO impregnated stacks were from the same batch <strong>of</strong> LSF15-CGO10 cell<br />
stacks, the difference in serial resistance at the beginning <strong>of</strong> the tests may likely be ascribed to the<br />
impregnation. A higher serial resistance is typically related to a poorer electric contact, and a<br />
possible explanation is for this reason that three times impregnation including heat treatment at<br />
700 °C has lead to a slightly poorer contact between the Au current collector and the cell stack on<br />
the BaO impregnated stacks, leading to a higher serial resistance at the beginning <strong>of</strong> the test.<br />
Furthermore, a decrease in the serial resistance <strong>of</strong> the BaO impregnated stacks was observed<br />
during testing. Part <strong>of</strong> the decrease might be explained by the Au current collector on the BaO<br />
impregnated stacks regaining good contact with the cell stack. However, this is likely not the only<br />
explanation, as the serial resistance on the BaO impregnated cell stacks at the end is much lower<br />
than the serial resistance <strong>of</strong> the non-impregnated sample. A possible explanation <strong>of</strong> this could be<br />
that the BaO during testing has reacted with the electrode materials and formed new phases with<br />
a higher conductivity. This thesis is supported by the SEM images <strong>of</strong> the BaO impregnated<br />
electrodes after test, which show pr<strong>of</strong>ound microstructural changes in the electrodes.<br />
It should be noted, that a change in the serial resistance/the electric contact during the test also<br />
will affect the polarisation resistance 165 . However, as the Rs/Rp ratio is not same for the BaO<br />
impregnated cell stacks at the beginning and the end <strong>of</strong> the test, changes in the serial<br />
resistance/electric contact cannot solely explain the decrease in the polarisation resistance during<br />
the test, and another activation process must for this reason also take place.<br />
7.3.2 Identification <strong>of</strong> processes<br />
In the previous chapter it was suggested, that the processes contributing to the polarisation<br />
resistance on the non-impregnated cell stack in 1000 ppm NO + 10% O2 was the following: Firstly a<br />
process was located at the high frequencies and related to oxygen ion transport in the electrolyte<br />
and across the electrolyte-electrode interface. Secondly, two processes were located at lower<br />
112
7 <strong>NOx</strong>-conversion on LSF15-CGO10 cell stacks with BaO impregnation<br />
frequencies and ascribed to TPB related processes like adsorption, diffusion and charge transfer,<br />
however exactly which processes and species were involved could not be identified.<br />
On the BaO impregnated stacks described in this chapter, three processes were also identified to<br />
contribute to the polarisation resistance; some <strong>of</strong> the characteristics <strong>of</strong> these processes were<br />
listed in Table 24 in the results section. At the high frequency part <strong>of</strong> the impedance spectra a<br />
process was located, which had a Cω <strong>of</strong> approximately 1·10 -8 F/cm 2 independent <strong>of</strong> temperature,<br />
an activation energy <strong>of</strong> 0.9 eV and with the resistance and the Cω being dependent on both the<br />
oxygen content and the NO content in the gas. The two first characteristics, activation energy and<br />
Cω, indicate the high frequency process is the process related to oxygen ion transport in the<br />
electrolyte and across the electrolyte-electrode interface 36, 54, 166 . This process was previously<br />
identified on the non-impregnated cell stacks, but on the BaO impregnated cell stacks the<br />
assignment <strong>of</strong> the high frequency process to oxygen ion transport is contradicted by the apparent<br />
dependency <strong>of</strong> the process on the atmosphere. The suggestion is here, that the high frequency<br />
process on the BaO impregnated cell stack is indeed the process related the oxygen ion transport.<br />
The apparent dependency on the atmosphere is suggested to be an artefact due to poor<br />
separation between the high frequency process and the middle frequency process. As observed in<br />
Table 24 the resistance <strong>of</strong> the middle frequency process also depends on the O2 and NO content,<br />
and if the high frequency and middle frequency processes are overlapping, the dependency <strong>of</strong> the<br />
middle frequency process on the atmosphere may interfere with the resistance <strong>of</strong> the high<br />
frequency process.<br />
With respect to the middle frequency process, the process shows as mentioned dependency on<br />
the atmosphere, with the resistance increasing with decreasing O2 and NO concentration, and<br />
furthermore Cω shows dependency on both the atmosphere and the temperature. The<br />
dependency <strong>of</strong> the process on both atmosphere and temperature, together with a Cω around<br />
1·10 -4 F/cm 2 is consistent with the behaviour expected for a TPB related process. For this reason<br />
the middle frequency process is ascribed to a TPB related process.<br />
Finally, process 3 located at the lowest frequencies show a very strong dependency on the<br />
polarisation, as shown in Figure 49. Furthermore the resistance <strong>of</strong> the process increases with<br />
decreasing NO content, and in one <strong>of</strong> the tests the Cω <strong>of</strong> the process shows a clear dependency on<br />
113
7 <strong>NOx</strong>-conversion on LSF15-CGO10 cell stacks with BaO impregnation<br />
the temperature. The dependency on polarisation and temperature is consistent with the<br />
expectations for TPB related process, as both the polarisation and temperature increase should<br />
lead to a broadening <strong>of</strong> the TPB zone end thereby a decrease in resistance and increase in<br />
capacitance. Furthermore the dependency on the NO content but not the O2 content indicates<br />
that this TPB process located at the lowest frequencies is closely connected to a <strong>NOx</strong> specie either<br />
in the gas phase or adsorbed at the electrode surface.<br />
7.3.3 Effect <strong>of</strong> BaO impregnation <strong>NOx</strong> conversion and electrodeprocesses<br />
As shown in the results section, the BaO impregnation increased the <strong>NOx</strong> conversion at 350-450 °C<br />
and the current efficiency at 350-400 °C when no O2 was present. However, when 10% oxygen was<br />
present in the atmosphere, the conversion on the BaO impregnated sample was similar to the<br />
conversion on the non-impregnated sample, i.e. a bit <strong>of</strong> NO2 was converted to NO, but no<br />
conversion to N2 was observed. This could at first indicate, the BaO had no effect on the electrode<br />
processes in oxygen-containing atmosphere, but as shown by the impedance analysis, all three<br />
electrode processes were to a smaller or larger extent affected by the BaO impregnation, which<br />
mainly led to a decrease in polarisation resistance. This shows, that even though the BaO<br />
decreases the resistance <strong>of</strong> the electrode processes, the selectivity towards N2 formation is not<br />
increased on the LSF15-CGO10 cell stacks at the investigated conditions.<br />
7.4 Conclusion<br />
The effect <strong>of</strong> BaO impregnation on the <strong>NOx</strong> conversion on LSF15-CGO10 cell stacks was<br />
investigated. In an atmosphere with 1000 ppm NO and no O2 the BaO impregnation increased<br />
both the <strong>NOx</strong> conversion to N2 and the current efficiency. However, in the presence <strong>of</strong> 10% O2, no<br />
conversion <strong>of</strong> <strong>NOx</strong> to N2 was observed. The impedance analysis showed the BaO impregnated in<br />
most cases decreased the polarisation resistance in 1000 ppm NO + 10% O2, but as apparent from<br />
the conversion measurements an increased selectivity towards N2 formation during polarisation<br />
was not observed.<br />
114
8 <strong>NOx</strong>-conversion on LSM15-CGO10 cell stacks with BaO impregnation<br />
8 <strong>NOx</strong>-conversion on LSM15-CGO10 cell stacks with BaO impregnation<br />
This chapter is the manuscript “<strong>NOx</strong>-conversion on LSM15-CGO10 cell stacks with BaO<br />
impregnation” accepted for publication in Journal <strong>of</strong> Materials Chemistry.<br />
8.1 Abstract<br />
The electrochemical conversion <strong>of</strong> <strong>NOx</strong> on non-impregnated and BaO-impregnated LSM15-CGO10<br />
(La0.85Sr0.15MnO3-Ce0.9Gd0.1O1.95) porous cell stacks has been investigated, and extensive impedance<br />
analysis have been performed to identify the effect <strong>of</strong> the BaO on the electrode processes. The<br />
investigation was conducted in the temperature range 300-500 °C, a polarisation range from 3 V to<br />
9 V and in atmospheres containing 1000 ppm NO, 1000 ppm NO + 10% O2 and 10% O2. On the<br />
non-impregnated cell stacks no <strong>NOx</strong> conversion was observed at any <strong>of</strong> the investigated<br />
conditions. However, BaO impregnation greatly enhanced the <strong>NOx</strong> conversion and at 400 °C and 9<br />
V polarisation a BaO-impregnated cell stack showed 60% <strong>NOx</strong> conversion into N2 with 8% current<br />
efficiency in 1000 ppm NO + 10% O2. This demonstrates high <strong>NOx</strong> conversion can be achieved on<br />
an entirely ceramic cell without expensive noble metals. Furthermore the <strong>NOx</strong> conversion and<br />
current efficiency was shown to be strongly dependent on temperature and polarisation. The<br />
impedance analysis revealed that the BaO-impregnation increased the overall activity <strong>of</strong> the cell<br />
stacks, but also changed the adsorption state <strong>of</strong> <strong>NOx</strong> on the electrodes; whether the increased<br />
activity or the changed adsorption state is mainly responsible for the improved <strong>NOx</strong> conversion<br />
remains unknown.<br />
8.2 Introduction<br />
In Europe the <strong>NOx</strong>-emission from the road transport has been significantly reduced during the last<br />
10 years, mainly due to the introduction <strong>of</strong> the three-way-catalyst on gasoline vehicles 2 . Due to<br />
the negative impact <strong>of</strong> <strong>NOx</strong>-emissions on both human health and the environment 11 , a further<br />
<strong>reduction</strong> in the <strong>NOx</strong> emissions from the car fleet is desirable. However a major challenge in that<br />
connection is the increased number <strong>of</strong> diesel vehicles, as the conventional three-way-catalyst is<br />
incapable <strong>of</strong> removing <strong>NOx</strong> from diesel exhaust. For this reason much research is currently focused<br />
on <strong>NOx</strong>-removal technologies for diesel exhaust, the most heavily investigated technologies being<br />
selective catalytic <strong>reduction</strong> with ammonia (NH3-SCR), selective catalytic <strong>reduction</strong> with<br />
115
8 <strong>NOx</strong>-conversion on LSM15-CGO10 cell stacks with BaO impregnation<br />
hydrocarbons (HC-SCR) and the <strong>NOx</strong>-storage and <strong>reduction</strong> (NSR) catalyst 108 . In all these three<br />
technologies there is the need for a reducing agent, either coming from operating the engine<br />
occasionally in an excess fuel to air-ratio (HC-SCR and NSR) or supplied by a separate system (NH3-<br />
SCR). A <strong>NOx</strong> removal technology without the need for the addition <strong>of</strong> a reducing agent would be<br />
simpler and therefore advantageous compared to the aforementioned technologies.<br />
A suggestion for such a technology is electrochemical <strong>NOx</strong> removal, where the <strong>NOx</strong> is reduced to N2<br />
and O2 by electrons supplied to a polarised electrode 4 . The technology is inspired by the finding in<br />
1975 by Pancharatnam et al. 22 that NO can be reduced to N2 during polarisation <strong>of</strong> a zirconia based<br />
cell in the absence <strong>of</strong> oxygen, and later it was shown by Cicero et al. 24 and Hibino et al. 26 that <strong>NOx</strong><br />
also could be electrochemically reduced in the presence <strong>of</strong> oxygen. Since then several studies has<br />
been made in the field <strong>of</strong> electrochemical de<strong>NOx</strong> by different research groups 24, 26, 28, 30, 39, 44, 45, 167 .<br />
For electrochemical <strong>NOx</strong> removal to become a technology <strong>of</strong> practical interest, a first and major<br />
obstacle to be overcome is to find electrode materials with a sufficiently high activity and<br />
selectivity for <strong>NOx</strong> <strong>reduction</strong> 4 .<br />
With respect to selectivity the major problem is the competing <strong>reduction</strong> <strong>of</strong> O2; in equation 8.1 the<br />
desired NO <strong>reduction</strong> on the cathode is stated and the competing O2 <strong>reduction</strong> is stated in<br />
equation 8.2.<br />
NO + 2 e - → 0.5 N2 + O 2-<br />
0. 5 O2 + 2 e - → O 2-<br />
In this work it is investigated if the conversion <strong>of</strong> <strong>NOx</strong> at 300-500 °C on LSM15-CGO10 composite<br />
electrodes can be increased by impregnating the electrodes with BaO. BaO is the most commonly<br />
used <strong>NOx</strong> storage compound in the NSR catalyst 21 , and the idea in this work is to increase the <strong>NOx</strong><br />
conversion by up-concentrating the <strong>NOx</strong> on the electrode surface in the form <strong>of</strong> Ba(NO3)2. Previous<br />
work by Li et al. 41 and Yoshinobu et al. 49 have shown good results from combining BaO and<br />
electrochemical de<strong>NOx</strong>, but in both cases the investigated electrode systems contained Pt or other<br />
noble metals, which increases the cost <strong>of</strong> the system. The work by Simonsen et al. 43 showed<br />
LSM15 in combination with Ba could be an efficient catalyst for electrochemical <strong>NOx</strong> removal;<br />
116<br />
8.1<br />
8.2
8 <strong>NOx</strong>-conversion on LSM15-CGO10 cell stacks with BaO impregnation<br />
however the work did not include any conversion measurements. Conversion measurements are<br />
included in this work, where electrochemical <strong>NOx</strong> removal is investigated on an entirely ceramic<br />
system, i.e. a system without expensive noble metals. LSM15 is chosen as electrode material for<br />
this investigation, as LSM15 has good stability compared to other perovskites like La1-xSrxFe1-yCoyO3<br />
and Ba1-xSrxFe1-yCoyO3, eventhough these have a higher activity in the investigated temperature<br />
range 62 . CGO10 was chosen as electrolyte and component in the electrode, as the ionic<br />
conductivity <strong>of</strong> CGO10 is superior to the ionic conductivity <strong>of</strong> YSZ (Yttria Stabilized Zirconia) below<br />
600 °C 68 . The non-impregnated and BaO-impregnated electrodes were investigated in a set-up<br />
with a porous 11-layer cell stack, as the large contact area between gas flow and cell stack in this<br />
set-up increases the conversion and makes it easy to detect any changes in the gas composition.<br />
Two complementary approaches were used to investigate the effect <strong>of</strong> the BaO-impregnation on<br />
the electrode performance. The one approach involved measurements <strong>of</strong> the <strong>NOx</strong> conversion as<br />
function <strong>of</strong> temperature, polarisation and gas composition. This approach was supplemented by<br />
an extensive impedance analysis aimed at clarifying which processes contributed to the<br />
polarisation resistance <strong>of</strong> the cell stacks, and how these processes were affected by the BaO<br />
impregnation.<br />
8.3 Experimental<br />
8.3.1 Cell stack fabrication:<br />
The 11-layer porous cell stacks consisted <strong>of</strong> 11 alternating layers <strong>of</strong> composite electrode (65 wt%<br />
LSM15 (Haldor Topsøe) and 35 wt% CGO10 (Rhodia)) and electrolyte (CGO10). The porous<br />
composite electrode layers were manufactured by mixing LSM15, CGO10, solvent (mixture <strong>of</strong><br />
ethanol and butanone), binder (polyvinylbuyral), dispersant (polyvinylpyrrolidone) and pore<br />
former (graphite) into a slurry, ball mill the slurry and thereafter tape caste the slurry into green<br />
tapes <strong>of</strong> approximately 40 μm thickness, for more details see Hee et al. 159 . The porous CGO10<br />
layers were prepared in a similar manner, and subsequent the green electrode and electrolyte<br />
layers were laminated together and round cell stacks were stamped out. The cell stacks were<br />
sintered with the maximum temperature 1250 °C held for 4 hours and thereby achieved a<br />
diameter <strong>of</strong> ≈14 mm. Prior to mounting in the test-set-up the cell stacks were painted with gold<br />
paste (ESL Electro-Science) mixed with 20% carbon (Graphit Kropfmühl AG), which was burned <strong>of</strong>f<br />
at 800 °C in order to create porous gold current collectors on each side <strong>of</strong> the cell stack.<br />
117
8.3.2 Impregnation<br />
8 <strong>NOx</strong>-conversion on LSM15-CGO10 cell stacks with BaO impregnation<br />
For impregnation <strong>of</strong> the porous cell stacks with BaO a 0.3 M aqueous Ba(NO3)2 (Merck) solution<br />
with 10 wt% P123 (BASF) was prepared. The cell stacks were covered with the Ba(NO3)2 solution<br />
and put under vacuum for ≈10 s, whereafter excess impregnation solution was wiped <strong>of</strong> the<br />
surface. The impregnated cell stacks were then heated to 700 °C for 1 h to decompose the<br />
Ba(NO3)2 into BaO. 700 °C was chosen to assure total decomposition, since a DTA experiment<br />
showed Ba(NO3)2 decomposed at 600-640 °C, even though the decomposition temperature<br />
reported by literature in general were lower, in the range 500-600 °C 168-170 .<br />
8.3.3 Test-set-up<br />
For electrochemical cell testing the stack was mounted in between two alumina tubes, which<br />
contained channels for the gas flow and measurement probes for the electrochemical<br />
characterization. The cell and the alumina tubes were inclosed in a quartz tube and mounted<br />
vertically in a furnace. A sketch <strong>of</strong> the set-up is shown in Figure 50.<br />
Current<br />
collector<br />
Alumina<br />
tube<br />
Glass tube<br />
8.3.4 <strong>Electrochemical</strong> Testing and Conversion measurements:<br />
Gas in<br />
Gas out<br />
During the tests the cell stacks were characterized by electrochemical impedance spectroscopy<br />
(EIS). The impedance spectra were recorded with a Gamry Reference 600 potentiostat in the<br />
frequency range 1 MHz to 0.001 Hz with 6 points pr. decade and 36 mV rms amplitude. The Gamry<br />
Reference 600 potentiostat was also used for polarisation <strong>of</strong> the cells during the conversion<br />
118<br />
Electrolyte<br />
Electrode<br />
Figure 50. Sketch <strong>of</strong> test-set-up for porous 11-layer cell stack. Reprinted with permission from<br />
Werchmeister et al. 13
8 <strong>NOx</strong>-conversion on LSM15-CGO10 cell stacks with BaO impregnation<br />
measurements. During the experiments the outlet gas from the cell stack was constantly<br />
monitored. The NO and NO2 concentrations were monitored by a chemiluminiscense detector<br />
Model 42i High Level from Thermo Scientific, while the N2, N2O and O2 concentrations were<br />
monitored with a mass spectrometer from Pfeiffer Vacuum, type Omnistar GSD 301. In total five<br />
cell stacks were tested, two non-impregnated stacks named N1 and N2, and three BaO-<br />
impregnated stacks named B1, B2 and B3.<br />
8.3.5 Test conditions<br />
The conversion measurements were made at the flow rate 2 L/h in 1000 ppm NO and 1000 ppm<br />
NO + 10% O2 in both cases with balance Ar. These concentrations <strong>of</strong> NO and O2 were chosen as<br />
they resemble the concentrations which may be found in the exhaust from a diesel car 7 . It should<br />
be noted, that 1000 ppm NO + 10% O2 are the concentrations set during the experiments, while in<br />
reality the gas composition will contains some NO2 due to the equilibrium NO + ½ O2 NO2.<br />
Moreover impedance measurements were recorded in 10% O2 with balance Ar for comparison to<br />
impedance spectra recorded in NO containing atmospheres. The experiments were carried out in<br />
the temperature range 300-500 °C which is close to the expected temperature <strong>of</strong> diesel engine<br />
exhaust <strong>of</strong> 100-400 °C 171 . Polarisation experiments were made in the range 3-9 V. As each 11 layer<br />
cell stacks contain 5 “cells”, the polarisation range pr. cell was 0.6-1.8 V.<br />
8.3.6 SEM<br />
Before and after testing the cell stacks were examined in a Zeiss Supra 35 scanning electron<br />
microscope equipped with a field emission gun. In order to obtain high magnification images <strong>of</strong><br />
the electrode microstructure images were recorded with the in-lens detector and 3 keV<br />
acceleration voltage on cells just broken and put directly into the microscope.<br />
8.4 Results<br />
8.4.1 Conversion and current efficiency<br />
On the non-impregnated cell stacks no conversion <strong>of</strong> NO into N2 was observed during 3 V<br />
polarisation in the temperature range 300-500 °C, neither when the cell stacks were supplied with<br />
1000 ppm NO + 10% O2 nor when the stacks were supplied with only 1000 ppm NO. However, on<br />
the BaO impregnated cell stacks conversion <strong>of</strong> <strong>NOx</strong> into N2 was observed both without presence <strong>of</strong><br />
O2 and in the presence <strong>of</strong> 10% O2. In Figure 51 the results from the conversion measurement<br />
119
8 <strong>NOx</strong>-conversion on LSM15-CGO10 cell stacks with BaO impregnation<br />
without O2 in 1000 ppm NO on the BaO impregnated stacks are stated, the results are based on<br />
measurements on three different stacks. Figure 51 shows the <strong>NOx</strong> conversion increases with<br />
temperature, and especially from 400 °C to 450 °C a significant increase in the conversion is<br />
observed from below 20% to above 60%. A significant increase in the current efficiency is also<br />
observed from 400 to 450 °C, as the current efficiency increases from 4% to 16%.<br />
100<br />
[%]<br />
Figure 51. Percentage <strong>of</strong> <strong>NOx</strong> converted into N2 and the current efficiency (CE) during 3 V<br />
polarisation for 2 h in 1000 ppm NO on a BaO impregnated cell stack.<br />
When the BaO impregnated cell stacks were supplied with 1000 ppm NO + 10% O2 and polarised<br />
at 3 V the <strong>NOx</strong> conversion also increased with temperature, however the average <strong>NOx</strong> conversion<br />
achieved at 500 °C was only 4% and the corresponding current efficiency only 0.3%.<br />
On one <strong>of</strong> the BaO impregnated cell stacks the influence <strong>of</strong> varying the polarisation between 3 V, 5<br />
V, 7 V and 9 V was investigated at 300 °C, 400 °C and 500 °C. At each temperature the first<br />
measurements was made at 3 V whereafter the voltage was increased stepwise till 9 V was<br />
reached, each time with the voltage kept at the specified value for one hour, with a one hour<br />
break at OCV in between. After 9 V had been reached the measurements at 7 V, 5 V and 3 V were<br />
repeated while going down in voltage. The results for the <strong>NOx</strong> conversion are shown in Figure 52<br />
and for the current efficiency in Figure 53.<br />
80<br />
60<br />
40<br />
20<br />
<strong>NOx</strong> conversion<br />
CE<br />
0<br />
250 350 450 550<br />
Temperature [°C]<br />
120
8 <strong>NOx</strong>-conversion on LSM15-CGO10 cell stacks with BaO impregnation<br />
Figure 52. Percentage <strong>of</strong> <strong>NOx</strong> converted into N2 during polarisation for 2 h in 1000 ppm NO + 10%<br />
O2 on a BaO impregnated cell stack. Closed symbols labelled a were recorded during the stepwise<br />
voltage increase from 3 to 9 V, while open symbols labelled b were recorded during the<br />
subsequent voltage decrease from 9 V to 3 V.<br />
Figure 53. Current efficiency for conversion <strong>of</strong> <strong>NOx</strong> into N2 during polarisation for 2 h in 1000 ppm<br />
NO + 10% O2 on a BaO impregnated cell stack. Closed symbols labelled a were recorded during the<br />
stepwise voltage increase from 3 to 9 V, while open symbols labelled b were recorded during the<br />
subsequent voltage decrease from 9 V to 3 V.<br />
121
8 <strong>NOx</strong>-conversion on LSM15-CGO10 cell stacks with BaO impregnation<br />
With respect to the <strong>NOx</strong>-conversion, only a negligible effect <strong>of</strong> increasing the voltage is observed<br />
at 300 °C, where the <strong>NOx</strong> conversion only increased from 0% at 3 V to 2% at -9 V. Contrary to this a<br />
distinct effect is observed from increasing the voltage at 400 °C, where the <strong>NOx</strong> conversion<br />
increased from 0% at 3 V to 61% at 9 V. Moreover an activation effect is observed at 400 °C on<br />
both <strong>NOx</strong>-conversion and current efficiency, as both had increased when the measurements at 7 V,<br />
5 V and 3 V were repeated during the second half <strong>of</strong> experiment. For comparison a similar<br />
polarisation experiment was made at 400 °C on a non-impregnated cell stack, but no formation <strong>of</strong><br />
N2 was observed not even at 9 V polarisation. At 500 °C a distinct effect is again observed from<br />
increasing the voltage on the BaO-impregnated stack, the relative largest increase in <strong>NOx</strong><br />
conversion per voltage increase is observed when the voltage is increased from 3 V to 5 V, which<br />
makes the <strong>NOx</strong> conversion increase from 4% to 77%. The measurement at 9 V is missing at 500 °C,<br />
as the corresponding current exceeded the maximum current <strong>of</strong> the Gamry Ref 600 Potentiostat<br />
and the experiment for this reason was interrupted. In general with respect to the current<br />
efficiencies they appear to be more or less independent on the voltage at 300 °C and 500 °C and<br />
do in no cases exceed 5%, whereas at 400 °C the current efficiencies clearly increase with voltage<br />
until 7 V, where it reaches a maximum value <strong>of</strong> ≈10%.<br />
8.4.2 Deconvolution <strong>of</strong> impedance spectra<br />
The impedance spectra recorded on the non-impregnated and the BaO-impregnated cell stack<br />
were all fitted with a serial resistance and a series connection <strong>of</strong> 3-4 sub-circuits, each sub circuit<br />
containing a resistance and a constant phase-element in parallel. In general the process located at<br />
the highest frequencies was clearly separable from the lower frequency processes, which on the<br />
other hand were strongly overlapping in the impedance spectra. Due to the strong overlap in the<br />
low frequency region it was not possible to obtain a linear Arrhenius plot for the individual<br />
resistances in this frequency region. To enlighten the processes in the low frequency region the<br />
sum <strong>of</strong> the low frequency resistances (R2, R3 and in some cases R4) were instead plottet together.<br />
The Arrhenius plot <strong>of</strong> the serial resistance, R1 and R2+R3+R4 are shown in Figure 54, Figure 55 and<br />
Figure 56 respectively.<br />
122
8 <strong>NOx</strong>-conversion on LSM15-CGO10 cell stacks with BaO impregnation<br />
Figure 54. Arrhenius plot <strong>of</strong> the serial resistance obtained from fitting <strong>of</strong> impedance spectra<br />
recorded in 1000 ppm NO + 10% O2 on non-impregnated (N1 and N2) and BaO-impregnated (B1,<br />
B2 and B3) cell stacks.<br />
Figure 55. Arrhenius plot <strong>of</strong> the high frequency process resistance obtained from fitting <strong>of</strong><br />
impedance spectra recorded in 1000 ppm NO + 10% O2 on non-impregnated (N1 and N2) and BaOimpregnated<br />
(B1, B2 and B3) cell stacks.<br />
Figure 56. Arrhenius plot <strong>of</strong> the sum <strong>of</strong> the low frequency processes resistance. The resistances<br />
were obtained from fitting <strong>of</strong> impedance spectra recorded in 1000 ppm NO + 10% O2 on non-<br />
impregnated (N1 and N2) and BaO-impregnated (B1, B2 and B3) cell stacks.<br />
123
8 <strong>NOx</strong>-conversion on LSM15-CGO10 cell stacks with BaO impregnation<br />
The serial resistance <strong>of</strong> the two non-impregnated cell stacks is in almost exact agreement, which is<br />
also the case for the resistance <strong>of</strong> the high frequency process (R1) and the low frequency processes<br />
(R2+R3+R4). This means good reproducibility is obtained for the non-impregnated cell stacks. The<br />
serial resistances <strong>of</strong> the BaO-impregnated cell stacks are very close to those <strong>of</strong> the non-<br />
impregnated, however with a tendency to be slightly lower. For the high frequency process the<br />
serial resistance is consequently lower for the impregnated cell stacks, the difference between<br />
non-impregnated and impregnated stacks being largest at low temperatures. For the low<br />
frequency processes some discrepancy is observed between the impregnated stacks, but in all<br />
cases the low frequency resistances are lower on the BaO-impregnated stacks compared to non-<br />
impregnated. One <strong>of</strong> the impregnated stacks (B3) shows an activation energy in the low frequency<br />
region similar to the activation energy <strong>of</strong> the non-impregnated stacks. The two other impregnated<br />
stacks show in the low frequency region a quite different behaviour, as the resistance show very<br />
little temperature dependency. At the highest measured temperature (500 °C), the resistance <strong>of</strong><br />
all the impregnated cell stacks is quite equal.<br />
For comparison to the just described resistances in the cell stack in 1000 ppm NO + 10% O2, the<br />
total polarisation resistance in non- and BaO-impregnated cell stacks subjected to only 10% O2 is<br />
shown in Figure 57. A decrease in the polarisation resistance on the impregnated stacks similar to<br />
the one observed in 1000 ppm NO + 10 % O2 is also observed in 10% O2. This indicates the BaO<br />
impregnation cause a general increase in the activity <strong>of</strong> the electrodes.<br />
Figure 57. Polarisation resistance <strong>of</strong> non-impregnated and impregnated cell stacks in 10% O2.<br />
124
8 <strong>NOx</strong>-conversion on LSM15-CGO10 cell stacks with BaO impregnation<br />
8.4.3 Characteristics <strong>of</strong> processes<br />
In addition to the impedance spectra recorded during temperature variations impedance spectra<br />
were also recorded during variation in gas composition, flow rate and polarisation. For the<br />
concentration variations the “standard” gas composition 1000 ppm NO + 10% O2 was varied first<br />
by changing the NO content to 1500 ppm and to 500 ppm while keeping pO2 constant, whereafter<br />
the NO concentration was fixed at 1000 ppm NO while pO2 was changed to 5% and 15%. These<br />
experiments were repeated at several temperatures on the cell stacks. During flow variations the<br />
standard flow 2 L/h was increased to 2.5 L/h and 3 L/h. The majority <strong>of</strong> the reported impedance<br />
spectra were recorded at OCV, but at 400 °C a series <strong>of</strong> impedance spectra were recorded under<br />
0.1V, 1 V and 3 V polarisation on both the non- and the BaO-impregnated stacks. From the<br />
impedance spectra recorded at different conditions different characteristics could be found for the<br />
processes contributing to the polarisation resistance. These characteristics are listed for the non-<br />
impregnated stacks in Figure 50 and for the BaO-impregnated stacks in Table 26. It should be<br />
noted the characteristics are stated for the 3 dominating processes observed at all temperatures,<br />
while a fourth process occasionally appearing at 500 °C is not included. In addition to the process<br />
characteristics listed in the tables the impedance spectra recorded during polarisation on the non-<br />
impregnated stack and BaO-impregnated stack are shown in Figure 58 and Figure 59 respectively,<br />
and show a pr<strong>of</strong>ound change in the low frequency region during polarisation.<br />
125
8 <strong>NOx</strong>-conversion on LSM15-CGO10 cell stacks with BaO impregnation<br />
Table 25. Characteristics <strong>of</strong> processes contributing to the impedance spectra recorded on non-<br />
impregnated cell stacks in an atmosphere containing 500-1500 ppm NO and 5-15% O2 within the<br />
temperature range 300-500 °C.<br />
Process Freq. range Characteristic<br />
1 300-80000 Hz - Cω * temperature independent<br />
2 0.5-25 Hz - Cω increases from 300 to 400 °C, then decreases to 500 °C<br />
-Cω dependent on pO2 (increase with decreasing pO2)<br />
- R dependent on pO2 (increase with decreasing pO2)<br />
3 0.02-0.5 Hz - Cω increases with temperature<br />
* C ω is the near-equivalent capacitance <strong>of</strong> the process<br />
- Cω dependent on pO2 (increase with decreasing pO2)<br />
- R decreases with polarisation<br />
- R dependent on pNO (increase with decreasing pNO)<br />
Figure 58. Impedance spectra recorded on non-impregnated cell stack at OCV and during<br />
polarisation. The stack was at 400 °C and supplied with 1000 ppm NO + 10% O2. The stated<br />
frequencies are marked with closed symbols. The spectra labelled “OCV before” and “OCV after”<br />
refers are impedance spectra recorded at OCV immediately before and after impedance spectra<br />
were recorded under current load.<br />
126
8 <strong>NOx</strong>-conversion on LSM15-CGO10 cell stacks with BaO impregnation<br />
Table 26. Characteristics <strong>of</strong> processes contributing to the impedance spectra recorded on BaO-<br />
impregnated cell stacks in an atmosphere containing 500-1500 ppm NO and 5-15% O2 within the<br />
temperature range 300-500 °C.<br />
Process Freq. range Characteristic<br />
1 5000-70000Hz - Cω decreases with temp (B3) or increases with temp. (B1) and (B2)<br />
- R increases with polarisation<br />
2 8-40 Hz - Cω increases with temperature<br />
- Cω dependent on pO2 (decrease with decreasing pO2)<br />
- R decreases with polarisation<br />
3 4mHz-0.2 Hz - Cω increases with temperature<br />
- Cω dependent on pO2 (increase with decreasing pO2)<br />
- Cω dependent on pNO (increase with decreasing pNO)<br />
- R decreases with polarisation<br />
- R dependent on pNO (increase with decreasing pNO)<br />
Figure 59. Impedance spectra recorded on BaO-impregnated cell stack at OCV during polarisation.<br />
The stack was at 400 °C and supplied with 1000 ppm NO + 10% O2. The stated frequencies are<br />
marked with closed symbols. The spectra labelled “OCV before” and “OCV after” refers are<br />
impedance spectra recorded at OCV immediately before and after impedance spectra were<br />
recorded under current load.<br />
127
8.4.4 Degradation<br />
8 <strong>NOx</strong>-conversion on LSM15-CGO10 cell stacks with BaO impregnation<br />
On all the cell stacks an impedance spectrum was recorded at 300 °C in 1000 ppm NO + 10% O2 at<br />
the very beginning <strong>of</strong> the test and at the end <strong>of</strong> the test, i.e. after the temperature variations,<br />
polarisation experiments etc., had been performed. From these spectra the serial and polarisation<br />
resistances were determined (Table 27) and the percentage change in Rs, R1 and R2+R3+R4 during<br />
the cell tests was calculated (Table 28). The non-impregnated cell stacks and one <strong>of</strong> the BaO<br />
impregnated cell stacks (B3) activated during the cell test, as both Rs, R1 and R2+R3+R4 decreased. A<br />
decrease in Rs indicates an improved electric contact through the cell stack, but as the percentage<br />
change in the polarisation resistance differs from the percentage change in the serial resistances,<br />
improved contact cannot solely explain the changes observed in the polarisation resistances. The<br />
two BaO impregnated cell stacks, which had the lowest polarisation resistance in the beginning <strong>of</strong><br />
the test (B1 and B2), degraded during the test which caused a large increase in the resistance <strong>of</strong><br />
the low frequency processes, while Rs and R1 during the tests decreased as for the other cell<br />
stacks. It is worth noticing, that even though the BaO impregnated cell stacks have a very<br />
different initial performance and degradation behaviour, they all at the end <strong>of</strong> the cell test have a<br />
polarisation resistance significantly below the polarisation resistance <strong>of</strong> the non-impregnated<br />
stacks.<br />
Table 27. Serial resistance (Rs) and polarisation resistance (Rp) in 1000 ppm NO + 10% O2 at 300 °C<br />
at the start <strong>of</strong> the test and the end <strong>of</strong> the test. The values stated for non-impregnated samples are<br />
average values for two different tests, the deviation between resistances in the two tests were<br />
below 6%.<br />
Test start Test end<br />
Rs [Ωcm 2 ] Rp [Ωcm 2 ] Rs [Ωcm 2 ] Rp [Ωcm 2 ]<br />
Non-impregnated 67 46070 48 25320<br />
B1 60 923 30 1090<br />
B2 48 110 38 300<br />
B3 68 66253 44 7643<br />
128
8 <strong>NOx</strong>-conversion on LSM15-CGO10 cell stacks with BaO impregnation<br />
Table 28. Percentage change in serial resistance (Rs), resistance <strong>of</strong> the high frequency process (R1)<br />
and the sum <strong>of</strong> the low frequency processes (R2+R3+R4) between the start and the end <strong>of</strong> the test.<br />
The resistances are obtained from impedance spectra recorded in 1000 ppm NO + 10% O2 at 300<br />
°C.<br />
8.4.5 SEM microscopy<br />
129<br />
Rs R1 R2+R3+R4<br />
Non-impregnated -29 -91 -39<br />
B1 -50 -83 477<br />
B2 -20 -30 5277<br />
B3 -36 -96 -88<br />
Representative SEM images from the microscopy investigation <strong>of</strong> the electrodes are shown in<br />
Figure 60. The SEM images <strong>of</strong> the non-impregnated electrodes before test (Figure 60a) show<br />
slightly rugged LSM15 grains in between smooth CGO10 grains. No evident differences are<br />
observed between the non-impregnated electrode before test (Figure 60a) and after test (Figure<br />
60b). On the BaO impregnated electrodes before test (Figure 60c), the impregnated BaO is clearly<br />
visible as distinct particles located on the LSM15 grains. After testing the microstructure <strong>of</strong> the<br />
BaO impregnated electrodes had clearly changed, and three different kinds <strong>of</strong> microstructure were<br />
observed even within the same cell stack: electrode grains being almost entirely covered by<br />
nanometer sized, round and well-defined particles (Figure 60d), electrode grains covered in a<br />
more “fluffy” structure (Figure 60e) and electrode grains covered entirely in flake-like particles<br />
(Figure 60f). The weight load <strong>of</strong> BaO on the cell stacks used for the microscopy was 2±0.1wt%,<br />
which means differences in microstructure likely cannot be ascribed to differences in BaO weight<br />
load. Furthermore the SEM images showed a similar microstructure <strong>of</strong> the B1 and the B3 cell<br />
stacks, even though these stacks degraded/activated quite differently during the testing.
8 <strong>NOx</strong>-conversion on LSM15-CGO10 cell stacks with BaO impregnation<br />
Figure 60. SEM images <strong>of</strong> the following LSM15-CGO10 cell stacks: a) non-impregnated before test<br />
b) non-impregnated after test c) BaO-impregnated before test and d)-f) BaO-impregnated after<br />
test.<br />
130
8.5 Discussion<br />
8 <strong>NOx</strong>-conversion on LSM15-CGO10 cell stacks with BaO impregnation<br />
8.5.1 Processes on non-impregnated electrodes<br />
Three processes were dominating the polarisation resistance <strong>of</strong> the non-impregnated electrodes.<br />
The high-frequency process was characterized by a temperature independent Cω with a value<br />
around 1·10 -7 F/cm 2 , a resistance independent on atmosphere and an activation energy <strong>of</strong><br />
1.08±0.01eV in 1000 ppm NO + 10% O2. These characteristics are consistent with characteristics<br />
reported in literature for processes related to transfer <strong>of</strong> oxygen ions between the perovskite and<br />
the electrolyte 36, 54, 166 . For the middle frequency process R increased with decreasing pO2 which<br />
indicate O2 or an O-specie is participating in the middle frequency process. The Cω <strong>of</strong> the middle<br />
frequency arc varied in the range 1·10 -5 -1·10 -4 F/cm 2 , a range in fairly good agreement with the<br />
capacitance associated with adsorption and dissociation <strong>of</strong> oxygen on composite cathodes 152 . The<br />
Cω <strong>of</strong> the middle frequency arc showed a strange behaviour with respect to the temperature<br />
dependency as the Cω increases from 300 °C to 400 °C and decreases from 400 °C to 500 °C, the<br />
observation was made on two different stacks. The best explanation <strong>of</strong> this observation is the<br />
middle frequency process contains contributions from two different processes, which change<br />
relative importance with temperature. The low frequency process is characterized by Cω increasing<br />
with temperature and decreasing pO2, and R decreasing with polarisation. This is consistent with<br />
the low frequency process being dependent on the vacancy concentration <strong>of</strong> the oxide electrode<br />
materials and/or the extension/broadening <strong>of</strong> the triple phase boundary zone. As the resistance <strong>of</strong><br />
the low frequency process also increases with decreasing NO concentration, the process is<br />
ascribed to a <strong>NOx</strong> specie (NO or NO2) which is adsorbing, diffusing on the surface or participating in<br />
charge-transfer related processes at or near the triple phase boundary. The presence <strong>of</strong> such a<br />
process on perovskite/CGO10 electrodes is in good agreement with previous findings in our<br />
group 36, 113 .<br />
8.5.2 Processes on impregnated electrodes<br />
The impedance spectra recorded on the BaO-impregnated cell stacks are dominated by three<br />
processes. The high frequency process shares several characteristics with the high frequency<br />
process observed on the non-impregnated cell stack, namely summit frequency range, a Cω around<br />
1·10 -7 F/cm 2 and lack <strong>of</strong> dependency on gas composition. Therefore the high frequency arc is<br />
ascribed to the same process, as it also seems reasonable the process related to transfer <strong>of</strong> oxygen<br />
131
8 <strong>NOx</strong>-conversion on LSM15-CGO10 cell stacks with BaO impregnation<br />
ions/intermediates between the perovskite and the electrolyte, should be visible for both non-<br />
impregnated and impregnated cell stacks. However, Figure 55 showed the resistance <strong>of</strong> the high<br />
frequency process is consequently lower for the impregnated stacks. The decrease in the<br />
resistance could be related to the pr<strong>of</strong>ound microstructural changes observed in the BaO<br />
impregnated electrodes observed in Figure 60. The characteristics <strong>of</strong> the middle frequency arc are<br />
Cω increasing with temperature and decreasing with decreasing pO2, while R decreases with<br />
polarisation. The difference in characteristics between the non-impregnated and BaO-<br />
impregnated samples makes it less probable the middle frequency process is the same on the two<br />
different kinds <strong>of</strong> cell stacks. Due to the dependency on temperature and polarisation the middle<br />
frequency process on the BaO-impregnated stacks is likely due to a triple phase boundary related<br />
process, but exactly which process and which species are involved cannot be determined from the<br />
available data. Finally the low frequency process on the BaO-impregnated sample show almost<br />
identical characteristics with the low frequency process on the non-impregnated cell stack, the<br />
one exception being on the BaO-impregnated sample the Cω also depend on the pNO. Due to the<br />
similar characteristics the process is for the BaO-impregnated cell stack also ascribed to triple-<br />
phase boundary related adsorption, diffusion and/or charge transfer involving NO or NO2.<br />
However, an important difference between the non- and BaO-impregnated samples is the<br />
resistance <strong>of</strong> the process is much smaller on the BaO-impregnated samples, for instance at 500 °C<br />
approximately an order <strong>of</strong> magnitude smaller compared to the non-impregnated sample. The<br />
difference in the low frequency arc resistance to a large extent explains the decreased resistance<br />
in the low frequency region <strong>of</strong> the impregnated samples observed in Figure 56. It is suggested the<br />
decreased resistance <strong>of</strong> the low frequency process is due to NO/NO2 getting adsorbed on the BaO<br />
in the form <strong>of</strong> Ba(NO3)2 rather than getting adsorbed on the LSM15 and/or CGO10 as in the non-<br />
impregnated cell stack. The implication <strong>of</strong> the difference in adsorption for the entire electrode<br />
process and <strong>NOx</strong>-<strong>reduction</strong> will be discussed in the next section.<br />
8.5.3 Effect <strong>of</strong> BaO-impregnation on electrode processes and <strong>NOx</strong> conversion<br />
In the previous two sections the electrode processes on the non-impregnated and the BaO-<br />
impregnated cell stacks were identified and compared and it was suggested the difference in<br />
electrode processes in 1000 ppm NO + 10% O2 could be explained by <strong>NOx</strong> adsorbing either directly<br />
on the LSM15-CGO10 or on the BaO. From FTIR studies <strong>of</strong> <strong>NOx</strong> adsorption it is known that <strong>NOx</strong> at<br />
132
8 <strong>NOx</strong>-conversion on LSM15-CGO10 cell stacks with BaO impregnation<br />
higher temperatures is adsorbed in the form <strong>of</strong> NO3 - , and that the NO3 - formation is preceded by<br />
either NO/O2 co-adsorption or NO2 formation and subsequent adsorption, these observations has<br />
been made both on CGO10/ceria 116 and perovskites 142 . Moreover it was shown in the work by<br />
Werchmeister et al. that NO2 is an important reaction intermediate in electrochemical de<strong>NOx</strong> 36, 38 ,<br />
considering the findings from FTIR studies this is likely because NO2 must be formed before<br />
adsorption/formation <strong>of</strong> nitrate on the electrode surface can occur, a step which necessarily must<br />
preceed the electrochemical <strong>reduction</strong>. Formation <strong>of</strong> NO3 - from NO2 requires an O - specie<br />
according to the reaction scheme NO2+O - →NO3 - (or presence <strong>of</strong> an adsorbed O-atom and an<br />
electron). For the non-impregnated electrode two <strong>of</strong> the identified processes were one related to<br />
O2 adsorption and dissociation (Process 2) and one related to <strong>NOx</strong> adsorption/diffuse/charge<br />
transfer at the triple phase boundary (Process 3). This is in very good agreement with the expected<br />
mechanism, were O - /O(ads) needs to be formed (corresponding to Process 2), before NO3 - can be<br />
formed and react in the triple phase boundary region (corresponding to Process 3). With respect<br />
to adsorption <strong>of</strong> <strong>NOx</strong> on BaO and formation <strong>of</strong> Ba(NO3)2, this process has been shown by FTIR to<br />
proceed fastest with NO2 117 even though the exact mechanism <strong>of</strong> Ba(NO3)2 formation is still under<br />
discussion 69-71 . The reaction scheme for Ba(NO3)2 formation with NO2 is BaO + 2 NO2 + ½ O2→<br />
Ba(NO3)2 and in NSR catalysis this storage process takes place without involving any<br />
electrochemical steps. It is suggested that during electrochemical de<strong>NOx</strong> the <strong>NOx</strong> storage process<br />
also takes place without involving any electrochemical steps. This is supported by the fact that the<br />
polarisation resistance on the impregnated cell stack show no dependency on O2 adsorption and<br />
dissociation related processes. By combining the results from the impedance analysis with the<br />
observation from the conversion measurements, which showed increased <strong>NOx</strong> conversion on BaO<br />
impregnated cell stacks, it becomes likely that the increased <strong>NOx</strong> conversion at least to some<br />
extent is due to the adsorption on BaO rather than on LSM15-CGO10, which establishes an easier<br />
reaction path for the electrochemical <strong>reduction</strong> <strong>of</strong> <strong>NOx</strong> in the cell stacks. The suggestion, that the<br />
<strong>NOx</strong> adsorption on the BaO impregnated cell stack proceeds via a route only dependent on O2(g)<br />
and not electrochemically enhanced O2 adsorption/dissociation, does however not explain the<br />
increased <strong>NOx</strong> conversion in 1000 ppm NO without oxygen. A detailed impedance analysis was not<br />
carried out in 1000 ppm NO, as the very low oxygen partial pressure in 1000 ppm NO alters the<br />
stochiometry <strong>of</strong> the oxide electrode materials during time and this instability hinders a reasonable<br />
interpretation <strong>of</strong> the impedance spectra. However, the increased <strong>NOx</strong> conversion in 1000 ppm NO<br />
133
8 <strong>NOx</strong>-conversion on LSM15-CGO10 cell stacks with BaO impregnation<br />
could be explained by the general increase in electrode activity caused by the BaO-impregnation.<br />
In the results section it was also shown the BaO-impregnation in general caused an increased<br />
electrode activity, as the BaO-impregnation also decreased the polarisation resistance in 10% O2,<br />
which is in agreement with the reportings on BaO-containing cathodes being superior in activity to<br />
conventional LSM15 cathodes. Therefore it can from this work be concluded, that impregnation<br />
with BaO definitely increases the <strong>NOx</strong>-conversion on LSM15-CGO10 cathodes, but whether the<br />
increased conversion in 1000 ppm NO + 10% O2 mainly is caused by a change in adsorption state<br />
or by a general increase in electrode activity remains an unanswered question.<br />
8.5.4 Degradation/activation behaviour <strong>of</strong> cell stacks related to microstructural changes<br />
The SEM images showed pr<strong>of</strong>ound changes in the microstructure <strong>of</strong> the BaO-impregnated cell<br />
stacks after testing. The microstructure appeared similar between cell stacks even though they<br />
degraded/activated differently during testing. Moreover the images clearly showed areas with<br />
different microstructure, which were characterized by 1) Round and well-defined particles, 2)<br />
“Fluffy” structure and 3) Flake-like particles. Eventually the differences in microstructure could be<br />
different stages <strong>of</strong> the same process going on in the electrodes. A possible explanation <strong>of</strong> the<br />
microstructural changes could be the BaO may react with the electrode materials, LSM15 and/or<br />
CGO10, and form new compounds. A possible compound could be BaCeO3 or BaCe1-xGdxOy,<br />
however it is hard from literature to estimate the risk for BaCeO3 formation. In many studies CGO<br />
is used as electrolyte in connection with Ba-containing cathodes and none <strong>of</strong> the studies report<br />
BaCeO3 formation below 900 °C 93-95 , however the aforementioned studies only consider the<br />
temperature effect on material stability and do not consider the effect <strong>of</strong> polarisation. With<br />
respect to the LSM studies some studies indicate there will be no reaction between Ba-containing<br />
compounds and LSM 90, 91 while the work by Yang et al. show Ba diffusing from<br />
Ba0.5Sr0.5Co0.8Fe0.2O3-δ into LSM 92 . In conclusion further microstructural and elemental analysis<br />
must be conducted to investigate, if cations have migrated and/or new phases have formed in the<br />
BaO-impregnated samples in this work.<br />
134
8.6 Conclusion<br />
8 <strong>NOx</strong>-conversion on LSM15-CGO10 cell stacks with BaO impregnation<br />
The electrochemical conversion <strong>of</strong> <strong>NOx</strong> on non-impregnated and BaO-impregnated LSM15-CGO10<br />
porous cell stacks has been investigated, and extensive impedance analysis have been performed<br />
to identify the effect <strong>of</strong> the BaO on the electrode processes. Non-impregnated LSM15-CGO10 cell<br />
stacks were not capable <strong>of</strong> converting <strong>NOx</strong> into N2 at any <strong>of</strong> the investigated conditions (300-500<br />
°C, 3 V-9 V polarisation, 1000 ppm NO or 1000 ppm NO + 10% O2). In contrast BaO impregnated<br />
cell stacks could convert <strong>NOx</strong> to N2, even in the presence <strong>of</strong> 10% O2, which shows <strong>NOx</strong> conversion<br />
can be achieved in an entirely ceramic, noble metal-free electrochemical cell. The <strong>NOx</strong> conversion<br />
to N2 on the impregnated stacks was significantly enhanced when the temperature was increased<br />
from 300 °C to 400 °C or higher, and when the polarisation was increased from 3 V to 5 V or<br />
higher. The impedance analysis revealed that the BaO-impregnation both increased the overall<br />
activity <strong>of</strong> the cell stacks and also changed the adsorption state <strong>of</strong> <strong>NOx</strong> on the electrodes, which <strong>of</strong><br />
the effects are mainly responsible for the increased <strong>NOx</strong> conversion remains unknown. The BaO-<br />
impregnated cell stacks showed a pr<strong>of</strong>ound change in microstructure after testing, the cause <strong>of</strong><br />
this change needs to be investigated further.<br />
8.7 Acknowledgement<br />
This work was supported by the Danish Strategic Research Council under contract no. 09-065183.<br />
Colleagues at the Fuel Cell and Solid State Chemistry Division, Technical University <strong>of</strong> Denmark, are<br />
thanked for help and fruitful discussions.<br />
135
9 <strong>NOx</strong>-conversion on LSM15-CGO10 cell stacks with K2O impregnation<br />
9 <strong>NOx</strong>-conversion on LSM15-CGO10 cell stacks with K2O impregnation<br />
This chapter deals as the preceding chapter with <strong>NOx</strong> conversion on porous LSM15-CGO10 cell<br />
stacks. In the preceding chapter the effect <strong>of</strong> BaO impregnation on the <strong>NOx</strong> conversion was<br />
investigated, whereas in this chapter the effect <strong>of</strong> K2O impregnation is investigated. The effect <strong>of</strong><br />
the K2O impregnation is studied in conversion measurements and by means <strong>of</strong> impedance<br />
spectroscopy. Two K2O impregnated cell stacks were investigated (K1 and K2). Of these two<br />
samples, one was used for conversion measurements (K1), while both <strong>of</strong> them were studied by<br />
impedance spectroscopy. For comparison results from two tests on non-impregnated LSM15-<br />
CGO10 cell stacks (N1 and N2) are also reported. The results from the non-impregnated cell stacks<br />
were also reported in the preceding chapter, but are in this chapter repeated to make it easier to<br />
identify the effect <strong>of</strong> the K2O impregnation.<br />
9.1 Experimental<br />
9.1.1 Cell stack fabrication and impregnation<br />
The LSM15-CGO10 cell stacks described in this chapter were from the same batch as the cell stacks<br />
previously described in chapter 8. For this reason the reader is referred to chapter 8 for<br />
information regarding the fabrication <strong>of</strong> the cell stacks. The impregnation <strong>of</strong> the cell stacks with<br />
K2O was made in the following way: An aqueous solution <strong>of</strong> 3.1 M KNO3 (Alfa Aesar) was prepared.<br />
The solution also contained 10 wt% P123 (BASF) with respect to the water. The cell stacks were<br />
covered with the impregnation solution and placed in a vacuum chamber, which was evacuated to<br />
a pressure below 0.1 mbar for approximately 15 s. Excess impregnation solution was wiped <strong>of</strong> the<br />
surface <strong>of</strong> the cell stack, and thereafter the cells were first heated to 350 °C to decompose the<br />
P123. After cool down the cell stacks were reheated to 700 °C to decompose the KNO3 into K2O. In<br />
principle the decomposition <strong>of</strong> P123 and KNO3 could just as well have been performed in one step,<br />
simply by heating the cell stacks to 700 °C from the beginning. However at the time <strong>of</strong> the<br />
experiments it was considered to do some experiments in which the KNO3 was kept as KNO3 in the<br />
cell stacks, which was the reason the heating was split into two steps. The final load <strong>of</strong> K2O on the<br />
tested cell stacks was 1.6±0.02 wt%.<br />
136
9 <strong>NOx</strong>-conversion on LSM15-CGO10 cell stacks with K2O impregnation<br />
9.1.2 <strong>Electrochemical</strong> testing and conversion measurements<br />
The electrochemical testing and conversion measurements performed on the K2O impregnated<br />
cell stacks were essentially the same as described in chapter 8. This means conversion<br />
measurements and impedance spectroscopy were made in the temperature range 300-500 °C in<br />
atmospheres containing 1000 ppm NO or 1000 pppm NO + 10% O2. The conversion measurements<br />
were made at 3V polarisation and as previously stated only one <strong>of</strong> the K2O impregnated cell stacks<br />
(K1) was subjected to conversion measurements. The other stack (K2) was subjected to an<br />
extensive impedance analysis, including temperature variations, concentration variations and flow<br />
variations. For more details on the how the conversion and impedance measurements were<br />
performed the reader is referred to chapter 8.<br />
9.1.3 SEM<br />
The K2O impregnated stacks were investigated in two different ways. In order to enlighten the<br />
microstructure <strong>of</strong> the impregnated K2O in the electrodes, the cell stacks were simply broken and<br />
placed directly in the microscope, whereafter the fractured surface was investigated using the in-<br />
lens detector at a low accelerating voltage (3 kV). To investigate the electrode structure on a<br />
slightly larger scale the cell stacks were mounted in epoxy, polished and carbon coated prior to a<br />
microscopy investigation with the back-scattered detector. The advantage <strong>of</strong> the latter method is<br />
this method makes it possible to study the connection between the electrode grains and the<br />
distribution <strong>of</strong> CGO10 and LSM15 in the electrodes.<br />
9.2 Results<br />
9.2.1 Conversion and current efficiency<br />
On the non-impregnated LSM15-CGO10 cell stack no conversion <strong>of</strong> NO into N2 was detected,<br />
neither when the cell stacks were supplied with 1000 ppm NO + 10% O2, nor when the cell stack<br />
was supplied with only 1000 ppm NO. On the K2O impregnated cell stack some conversion <strong>of</strong> NO<br />
to N2 was observed in 1000 ppm NO when the cell stack was polarised at 3V, see Figure 61, which<br />
shows the <strong>NOx</strong> conversion and the current efficiency for N2 formation. Figure 61 shows that both<br />
the <strong>NOx</strong> conversion and the current efficiency was highest at 350 °C, where the <strong>NOx</strong> conversion<br />
was 12% and the current efficiency 1.4%.<br />
137
9 <strong>NOx</strong>-conversion on LSM15-CGO10 cell stacks with K2O impregnation<br />
Figure 61. <strong>NOx</strong> conversion to N2 and current efficiency during 3V polarisation in 1000 ppm NO <strong>of</strong><br />
LSM15-CGO10 cell stack impregnated with K2O.<br />
When 10% O2 was present in the atmosphere, no conversion <strong>of</strong> NO into N2 was detected. Instead a<br />
change was observed in the conversion between NO and NO2. This can be seen when comparing<br />
Figure 62 and Figure 63, which shows the change in NO and NO2 concentration during polarisation<br />
relative to the <strong>NOx</strong> concentration before polarisation. On the non-impregnated cell stacks a small<br />
amount <strong>of</strong> NO2 (arising from the NO + ½ O2 NO2 equilibrium) is converted to NO during<br />
polarisation, whereas on the K2O impregnated cell stack, a small amount <strong>of</strong> NO is converted to<br />
NO2 during polarisation.<br />
NO x conversion[%]<br />
20<br />
15<br />
10<br />
5<br />
0<br />
0.0<br />
250 350 450<br />
Temperature [°C]<br />
550<br />
138<br />
<strong>NOx</strong> conversion<br />
CE<br />
2.0<br />
1.5<br />
1.0<br />
0.5<br />
CE [%]
9 <strong>NOx</strong>-conversion on LSM15-CGO10 cell stacks with K2O impregnation<br />
Figure 62. Change in NO concentration during 3V polarisation in 1000 ppm NO + 10% O2 relative to<br />
the <strong>NOx</strong> concentration before polarisation. N1 and N2 are non-impregnated LSF15-CGO10 cell<br />
stacks while K1 is impregnated with K2O. Negative values mean NO is removed while positive<br />
values mean NO is formed. The data point marked by a filled triangle was by mistake recorded at<br />
only 1.5V polarisation.<br />
Figure 63. Change in NO2 concentration during 3V polarisation in 1000 ppm NO + 10% O2 relative<br />
to the <strong>NOx</strong> concentration before polarisation. N1 and N2 are non-impregnated LSF15-CGO10 cell<br />
stacks while K1 is impregnated with K2O. Negative values mean NO2 is removed while positive<br />
values mean NO2 is formed. The data point marked by a filled triangle was by mistake recorded at<br />
only 1.5V polarisation.<br />
139
9.2.2 Impedance results<br />
9 <strong>NOx</strong>-conversion on LSM15-CGO10 cell stacks with K2O impregnation<br />
9.2.2.1 Serial and polarisation resistances<br />
Impedance spectra were recorded in 1000 ppm NO + 10% O2 in the temperature range 300-500 °C.<br />
The serial resistance (Rs) and polarisation resistance (Rp) determined from the impedance spectra<br />
are stated in Table 29. As observed in Table 29, good reproducibility was obtained for the two<br />
non-impregnated cell stacks, both with respect to Rs and Rp, even though one <strong>of</strong> the non-<br />
impregnated stacks (N2) consistently had a slightly lower Rp compared to the other one. Moreover<br />
both the non-impregnated cell stacks showed activation and/or improved electric contact during<br />
the cell test, which resulted in a decrease <strong>of</strong> both Rs and Rp, which is observed when the values at<br />
300 °C in the beginning and the end <strong>of</strong> the cell tests are compared. The two K2O impregnated<br />
stacks behaved much different from the non-impregnated cell stacks, as the K2O impregnated<br />
stacks had a lower Rs and especially a much lower Rp. In addition to this the two K2O impregnated<br />
stacks differed significantly from each other. First <strong>of</strong> all the K1 stack in general had a much lower<br />
Rp compared to the K2 cell stack. Secondly the impregnated cell stacks behaved differently during<br />
the test when the temperature was increased. Whereas the K2 stack, which was not subjected to<br />
longer conversion/polarisation experiments, showed a decrease in both Rs and Rp with increasing<br />
temperature as expected, the K1 cell stack showed an increase in Rs in the temperature range 400-<br />
500 °C and a more or less constant Rp in the temperature range 350-500 °C. It is believed the<br />
difference in the initial performance between the impregnated cell stacks is due to an inadequate<br />
reproducibility <strong>of</strong> the impregnation step. The difference in behaviour during the cell test was likely<br />
caused by the one stacks being subjected to polarisation while the other was not. The difference<br />
in degradation behaviour will be discussed further in the discussion section, where also the<br />
difference between the non-impregnated and the impregnated cell stacks will be discussed.<br />
140
9 <strong>NOx</strong>-conversion on LSM15-CGO10 cell stacks with K2O impregnation<br />
Table 29. Serial resistance (Rs) and polarisation resistance (Rp) <strong>of</strong> non-impregnated (N1, N2) and<br />
K2O impregnated LSF15-CGO10 cell stacks in 1000 ppm NO + 10% O2. The bottom line labelled<br />
300(post) states the resistance at 300 °C at the end <strong>of</strong> the test.<br />
Rs[Ωcm 2 ]<br />
Rp[Ωcm 2 ]<br />
Temp. N1 N2 K1 K2 N1 N2 K1 K2<br />
300 66 68 31 48 47000 45000 86 1800<br />
350 25 20 6 10* 19000 12000 54 880*<br />
400 9 9 7 6* 6100 4100 65 450*<br />
450 6 5 16 4* 2400 980 53 220*<br />
500 5 4 20 3 920 480 63 180<br />
300(post) 48 48 35 42 26000 25000 117 880<br />
* For all the measurements the temperature was the stated temperature with a deviation less then 2 °C. The one<br />
exception is the values labelled with an asterisk, where the exact temperature due to a poor temperature control was<br />
355, 408 and 461 °C at 350, 400 and 450 °C respectively.<br />
9.2.2.2 Characterization <strong>of</strong> processes<br />
One <strong>of</strong> the aims by recording impedance spectra during the cell stack test was to use the<br />
impedance spectra to identify the processes contributing to the polarisation resistance in 1000<br />
ppm NO + 10% O2. However, as explained in the previous section on serial resistance and<br />
polarisation resistance, the K2O impregnated cell stack subjected to polarisation during testing<br />
degraded heavily, and furthermore the two K2O impregnated stacks showed a quite different<br />
initial performance. The heavy degradation on the one stack makes it difficult to use the<br />
impedance spectra recorded on this stack in a meaningful study <strong>of</strong> the electrode processes, and<br />
the difference in initial performance raises the question whether electrode processes identified on<br />
the less degrading cell stack (K2) also are descriptive for the electrode processes occurring on the<br />
other cell stack. The latter question cannot be answered before more experiments have been<br />
performed on LSM15-CGO10 cell stacks with K2O impregnation.<br />
As a starting point an attempt to identify the processes occurring on the one K2O impregnated cell<br />
stack (K2) will be made, and the reader should bear in mind, that this identification is based on<br />
one test only. The identification is based on impedance spectra recorded during temperature<br />
141
9 <strong>NOx</strong>-conversion on LSM15-CGO10 cell stacks with K2O impregnation<br />
variations, during variations in the NO and O2 concentrations and during flow variations. First <strong>of</strong> all<br />
temperature variations were made in the interval 250-500 °C, and impedance spectra were<br />
recorded for each 25 °C in 1000 ppm NO + 10% O2. The recorded impedance spectra were<br />
deconvoluted by using the ZView s<strong>of</strong>tware 107 and an equivalent circuit consisting <strong>of</strong> a serial<br />
resistance and 3-4 RQ elements in series, where R is a resistance and Q is a constant phase<br />
element. As illustrated in Figure 64 a change <strong>of</strong> slope was observed in the Arrhenius plot for both<br />
the serial resistance and the resistance <strong>of</strong> the low frequency arc/arc4 between 325 °C and 350 °C.<br />
This temperature interval covers the melting point <strong>of</strong> KNO3 (mp= 334 °C 97 ) and the results thus<br />
indicate, that presence <strong>of</strong> molten KNO3 alters the current path through the cell stack and the<br />
electrode processes. The concentration and flow variations were made at 400 and 500 °C, and the<br />
results obtained during these variations are thus descriptive for processes occurring above 350 °C.<br />
However, as indicated in Figure 64 different processes may have dominated the impedance<br />
spectra below 350 °C.<br />
Figure 64. Arrhenius plot showing the serial resistance and resistance <strong>of</strong> low frequency Arc/Arc4 <strong>of</strong><br />
K2O impregnated LSM15-CGO10 cell stack (K2).<br />
142
9 <strong>NOx</strong>-conversion on LSM15-CGO10 cell stacks with K2O impregnation<br />
In the temperature range 350 °C-500 °C the impedance spectra were in general fitted with a serial<br />
resistance and 4 RQ elements. Each <strong>of</strong> the RQ elements is assumed to describe a physical process<br />
in the stack. No effect <strong>of</strong> flow variations from 2 L/h to 2.5 L/h and 3 L/h was observed on any <strong>of</strong><br />
the electrode processes. In contrast, changing the NO concentration and the oxygen concentration<br />
had a significant effect on the resistance and the Cω <strong>of</strong> several <strong>of</strong> the electrode processes. The<br />
characteristics <strong>of</strong> each <strong>of</strong> the four identified processes are collected in Table 30 and in the<br />
discussion section these processes will be discussed in further detail. A representative impedance<br />
spectrum recorded in 1000 ppm NO + 10% O2 at 400 °C is shown in Figure 65.<br />
Table 30. Characteristics <strong>of</strong> processes on K2O impregnated LSM15-CGO10 cell stacks (K2) in the<br />
temperature range 400-500 °C.<br />
Proces Freq. range Charactistic<br />
1 2000-130000 - Cω temperature independent<br />
- R dependent on pO2 and pNO (increase with decreasing pO2/pNO)<br />
2 200-400 - Cω increases with temperature from 350 °C<br />
3 0.2-3 - Cω increases with temperature from 350 °C<br />
- R dependent on pO2 and pNO (increase with decreasing pO2/pNO)<br />
- Cω dependent on pO2 (decrease with decreasing pO2)<br />
- Cω dependent pNO (increase with decreasing pNO)<br />
4 0.01-0.03 - Cω increases with temperature from 350 °C<br />
- R dependent on pO2 and pNO (decrease with decreasing pO2/pNO)<br />
-Z'' [Ωcm 2 ]<br />
200<br />
150<br />
100<br />
50<br />
0<br />
-50<br />
- Cω dependent on pO2 (increase with decreasing pO2)<br />
- Cω dependent pNO (increase with decreasing pNO)<br />
Arc 1<br />
and 2<br />
0.2 Hz<br />
Arc 3<br />
20 mHz<br />
0 100 200 300 400 500 600<br />
Z' [Ωcm 2 ]<br />
143<br />
Arc 4<br />
2 mHz<br />
Figure 65. Example <strong>of</strong> impedance spectrum recorded at 400 °C in 1000 ppm NO + 10% O2 on a K2O<br />
impregnated cell stack.
9.2.3 SEM<br />
9 <strong>NOx</strong>-conversion on LSM15-CGO10 cell stacks with K2O impregnation<br />
SEM images were recorded with the in-lens detector on cell stacks just broken and placed directly<br />
in the microscope, in order to study the microstructure <strong>of</strong> the impregnated K2O. In Figure 66a the<br />
microstructure <strong>of</strong> the K2O-impregnated electrodes before test is shown, and appears to be<br />
dominated by many irregular K2O crystals which lies higgledy-piggledy in the electrode. After<br />
testing the electrode appear much different, as the electrode grains now appear covered in a thin,<br />
snowlike layer, as observed in Figure 66b.<br />
Figure 66. Microstructure <strong>of</strong> the electrode in a K2O impregnated LSM15-CGO10 cell stack a) before<br />
test and b) after test<br />
To survey the connection between the electrode grains and distribution <strong>of</strong> LSM15 and CGO10 in<br />
the electrodes images were taken with the backscattered detector on epoxy mounted samples,<br />
the images are shown in Figure 67. Figure 67a and Figure 67b shows images recorded on a non-<br />
impregnated electrode before and after test. In Figure 67c and Figure 67d the images <strong>of</strong> a K2O<br />
impregnated electrode before test and after test are shown respectively. Finally Figure 67e shows<br />
the microstructure <strong>of</strong> an K2O impregnated electrode only subjected to EIS testing, which means<br />
the electrode has experienced the same temperature pr<strong>of</strong>ile as the electrode shown in Figure 67d,<br />
144
9 <strong>NOx</strong>-conversion on LSM15-CGO10 cell stacks with K2O impregnation<br />
but has only been subjected to low polarisation, namely 36 mV rms across the entire cell stack<br />
during recording <strong>of</strong> the EIS. On the non-impregnated electrode and the K2O impregnated electrode<br />
before test the electrode appear to be dominated by the LSM15 phase (dark grey) with the CGO10<br />
phase (light grey) in between. When the electrode microstructure on the K2O impregnated sample<br />
before test is compared to after test a significant change in the connection between the electrode<br />
grains appear. Before testing all the electrode grains appeared very well connected while after<br />
testing the electrode grains appear separated from each other (Figure 67d). The separation <strong>of</strong><br />
electrode grains appear for both the LSM phase and the CGO phase, the reason for this change in<br />
microstructure will be further discussed in the discussion section.<br />
145<br />
Figure 67. SEM images recorded with<br />
backscatter detector on various LSM15-CGO<br />
electrodes:<br />
a) non-impregnated before test,<br />
b) non-impregnated after test,<br />
c) K2O impregnated before test,<br />
d) K2O impregnated after test,<br />
e) K2O impregnated only subjected to EIS test.
9.3 Discussion<br />
9 <strong>NOx</strong>-conversion on LSM15-CGO10 cell stacks with K2O impregnation<br />
9.3.1 Identification <strong>of</strong> electrode processes<br />
On the non-impregnated LSM15-CGO10 cell stacks the polarisation resistance was in the preceding<br />
chapter 8 determined to be dominated by three different processes in 1000 ppm NO + 10% O2. At<br />
the highest frequencies <strong>of</strong> the impedance spectra a processes related to oxygen ion transfer<br />
between the LSM and the CGO and possibly through the CGO was identified. Around the middle<br />
frequencies a process related to oxygen adsorption/dissociation was identified, and finally at the<br />
lower frequencies a process related to adsorbtion, surface diffusion and/or charge transfer related<br />
processes involving a <strong>NOx</strong> species was identified.<br />
On the K2O impregnated cell stack four different processes were identified and characterised at<br />
400 and 500 °C. The characteristics <strong>of</strong> these four processes were listed in Table 30, in general the<br />
impedance spectra were entirely dominated by the two processes located at the lower<br />
frequencies, while the two processes locate in the high frequency end only constituted a smaller<br />
part <strong>of</strong> the entire polarisation resistance, which is also illustrated in the impedance spectra in<br />
Figure 65.<br />
The process located at the highest frequencies (Process 1) had a temperature independent Cω<br />
around 1·10 -7 F/cm 2 . This value would at first hand fit well with the process related to oxygen ion<br />
transfer in the electrode materials 36, 54, 166 , which was also identified in the high frequency end <strong>of</strong><br />
the impedance spectra for the non-impregnated cell stack. However, as stated in Table 30 the<br />
resistance <strong>of</strong> the high frequency process apparently also depends on both the NO concentration<br />
and the O2 concentration, which is not expected for the oxygen ion transport process 36, 54 . A<br />
contradistinction for the interpretation <strong>of</strong> the high frequency process thus exists between the low<br />
value <strong>of</strong> the Cω indicating an intrinsic oxygen ion transport process, and the dependency on the gas<br />
composition indicating a triple phase boundary related process. A possibly explanation could be,<br />
that the separation between process 1 and process 2 located at the high frequencies is poor, and<br />
characteristics like dependency on gas composition falsely is assigned to process 1 rather than<br />
process 2 due to overlap <strong>of</strong> the two high-frequency processes. To clarify this, further investigations<br />
are needed on more K2O impregnated LSM15-CGO10 electrodes.<br />
146
9 <strong>NOx</strong>-conversion on LSM15-CGO10 cell stacks with K2O impregnation<br />
With respect to process 2 this process has a Cω in the range 1·10 -5 - 1·10 -4 F/cm 2 , which increases<br />
with temperature. The range <strong>of</strong> Cω is in the low end, but otherwise corresponds well with the<br />
capacitances found for oxygen adsorption and dissociation processes on composite electrodes 152 .<br />
However, for an oxygen adsorption and dissociation process dependency on the pO2 is<br />
expected 152 , which was not observed for arc 2 in this work. The identification <strong>of</strong> process 2 is due to<br />
the limited and contradictory characteristics difficult and further experiments are needed to make<br />
identification <strong>of</strong> this process possible.<br />
The identification <strong>of</strong> process 3 and process 4 will be discussed together, as the processes share<br />
some characteristics. The shared characteristics are Cω increasing with temperature and increasing<br />
with decreasing pNO. The Cw dependency on temperature indicates a broadening <strong>of</strong> the reactions<br />
zone, for instance the TPB, with increasing temperature. The increase in Cω with decreasing pNO<br />
indicates a dependency <strong>of</strong> both the processes on a <strong>NOx</strong>-specie. For process 3 the resistance<br />
increases when either the pO2 or the pNO is decreased, which indicate both O2 and NO, or similar<br />
species, acts as reactants for process 3. With respect to process 4 the resistance also show a<br />
dependency on the pNO and the pO2, but in contrast to process 3 process 4 shows a decrease in<br />
resistance when either pNO or pO2 is decreased. A first thought would be that NO or O2 species<br />
act as inhibitors for process 4, but since NO/O2 are the only possible reactants in the gas, it seems<br />
unlikely they both should act as inhibitors for a process, in which at least one <strong>of</strong> them is expected<br />
to participate. In conclusion, both process 3 and process 4 show a strong dependency on the gas<br />
composition, both with respect to the resistance and the Cω, which indicate the processes are<br />
related to adsorption, surface diffusion and/or charge transfer processes in the TPB region.<br />
To summarize, the polarization resistance <strong>of</strong> the non-impregnated cell stacks was due to 3<br />
processes: oxygen ion transport, O2 adsorption/dissociation and a TPB process involving a <strong>NOx</strong>-<br />
specie. On the K2O impregnated cell stack 4 processes contributed to the polarisation resistance:<br />
two small processes located at high frequencies, <strong>of</strong> which one could be an oxygen ion transport<br />
process while the other remained un-identified, and two dominating processes located at lower<br />
frequencies, which both were ascribed to TPB related process.<br />
147
9 <strong>NOx</strong>-conversion on LSM15-CGO10 cell stacks with K2O impregnation<br />
9.3.2 Effect <strong>of</strong> K2O impregnation on performance and degradation<br />
As shown in the results section, the non-impregnated cell stacks activated during the test, as Rs<br />
decreased by ≈30%, and Rp by ≈45%. The decrease in Rs is explained by improved electric contact,<br />
either due to improved attachment <strong>of</strong> the Au current collector during testing, or due to an<br />
improvement in the sintering between the electrode and the electrolyte layers during the test.<br />
And improved electric contact through the cell stack will give the same relative decrease in Rp as in<br />
Rs 165 . However, as a relatively larger decrease in the Rp is observed, another activation<br />
phenomenon only affecting the Rp must have taken place. A suggestion for this activation<br />
phenomenon is polarisation induced changes in the electrode microstructure, as this has<br />
previously been observed on LSM electrodes, where the mobility <strong>of</strong> oxygen vacancies and Mn ions<br />
were suggested to be main responsible for the activation 58, 59 .<br />
When the resistances <strong>of</strong> the K2O impregnated cell stack not subjected to polarisation experiments<br />
is compared to the resistances <strong>of</strong> the non-impregnated cell stack, the K2O impregnated cell stack<br />
appear to have both lower Rs and significantly lower Rp. The lower Rs could above 350 °C be<br />
explained by the current through the cell stack to some extent passing through the molten KNO3,<br />
as molten KNO3 has a significantly higher conductivity (ρ(KNO3)=0.699 S/cm at 350 °C 164 )<br />
compared to CGO(ρ(CGO)=0.001 S/cm at 350 °C 68 . The K2O impregnated cell stack subjected to<br />
polarisation experiments showed a clear degradation with respect to both Rs and Rp. The SEM<br />
images <strong>of</strong> this cell stack showed after testing a pr<strong>of</strong>ound breakdown <strong>of</strong> the electrode<br />
microstructure <strong>of</strong> the outer electrodes in this cell stack. As this breakdown was not observed<br />
neither on the non-impregnated cell stacks, nor on the K2O impregnated stacks not subjected to<br />
polarisation, the breakdown must be due to the combination <strong>of</strong> K2O presence in the electrode and<br />
polarisation. However exactly how this combination K2O and polarisation leads to detachment<br />
between the LSM and the CGO grains remain an un-answered question.<br />
148
9.4 Conclusion<br />
9 <strong>NOx</strong>-conversion on LSM15-CGO10 cell stacks with K2O impregnation<br />
The conversion <strong>of</strong> <strong>NOx</strong> on a K2O impregnated LSM15-CGO10 cell stack was measured, and K2O<br />
impregnation was found to increase the <strong>NOx</strong> conversion to N2 in 1000 ppm NO compared to non-<br />
impregnated stacks, while in the presence <strong>of</strong> 10% O2 no formation <strong>of</strong> N2 could be detected during<br />
3V polarisation on the K2O impregnated cell stack. In the presence <strong>of</strong> 10% O2 the K2O impregnation<br />
did however change the conversion between NO and NO2. Furthermore, impedance spectroscopy<br />
was applied on the tested stack and another similar stack to investigate how the K2O impregnation<br />
altered the electrode processes compared to the processes on the non-impregnated stacks. The<br />
K2O impregnation led to a significant <strong>reduction</strong> in the polarisation resistance, and electrode<br />
processes occurring in the TPB zone appeared to have been significantly altered by the<br />
impregnation. The K2O impregnation did also cause severe degradation problems in the cell stacks<br />
when they were polarised, which led to a remarkable breakdown <strong>of</strong> the electrode microstructure<br />
<strong>of</strong> the K2O impregnated cell stack.<br />
149
10 Measurements on LSM15-CGO10 electrodes in a 3-electrode set-up.<br />
10 Measurements on LSM15-CGO10 electrodes in a 3-electrode set-up.<br />
10.1 Introduction<br />
As described in the experimental chapter (chapter 3), the most detailed electrode studies can be<br />
made in a 3-electrode set-up, due to the presence <strong>of</strong> one single working-electrode in the set-up in<br />
combination with a reference electrode with a well-defined potential. For this reason CGO 3-<br />
electrode pellets were prepared with non-impregnated and BaO-impregnated LSM15-CGO10<br />
working electrodes and tested in the 3EP set-up described in the experimental chapter. The aim<br />
<strong>of</strong> doing this was to complement the work on symmetric cells and porous cell stacks described in<br />
the previous chapters. In this chapter the initial results from testing <strong>of</strong> a non-impregnated and<br />
BaO-impregnated LSM15-CGO10 electrode will be described, the results include conversion<br />
measurements, cyclic voltammetry and impedance analysis.<br />
10.2 Experimental<br />
10.2.1 Preparation <strong>of</strong> CGO-3EP pellets<br />
For preparation <strong>of</strong> CGO-3EPs low surface area (LSA) CGO10 (Rhodia) was mixed with liquid glycerin<br />
(Fluka), stearic acid in solid form (Merck) and polyvinyl butyral (PVB) (Wacker). The weight<br />
percentages in the mixture was 93 wt% CGO10, 1 wt% liquid glycerin, 1 wt% stearic acid and 5<br />
wt% PVB. Afterwards ethanol was added to the mixture and the mixture was ball milled for ≈24 h.<br />
Following the ball milling the mixture was dried on a hotplate and subsequent crushed to powder<br />
with particle size d50=0.5 μm and d90=2 μm in a planetary mill. The powder was pressed into<br />
cylinders with diameter 16 mm and height 19 mm first by mechanical pressing at 1 t for 30 s and<br />
then by isostatic pressing at 50 tons for 20 s. The CGO cylinders were sintered with the maximum<br />
temperature 1500 °C held for 3 hours. After sintering the density <strong>of</strong> the cylinders was 99% <strong>of</strong> the<br />
theoretical density. Finally the sintered cylinders were shaped into the 3EP form by grinding with<br />
diamond tools.<br />
150
10 Measurements on LSM15-CGO10 electrodes in a 3-electrode set-up.<br />
10.2.2 Screen-printing <strong>of</strong> LSM15-CGO10 electrodes<br />
The LSM15-CGO10 working electrodes were screen-printed on the 3EP exactly like the electrodes<br />
were screen-printed on the symmetric cells described in chapter 5 using the same screen printing<br />
paste. For this reason the reader is referred to chapter 5 section 5.3.1 for information regarding<br />
the fabrication <strong>of</strong> the screen printed electrodes.<br />
10.2.3 Impregnation with BaO<br />
For impregnation with BaO an aqueous 0.3 M solution <strong>of</strong> Ba(NO3)2 (Merck) was prepared. The<br />
screen-printed electrode on top <strong>of</strong> the CGO-3EPs was immersed into the Ba(NO3)2 solution, while<br />
the remainder <strong>of</strong> the 3EP was kept <strong>of</strong> the solution. The electrodes/3EPs were subjected to vacuum<br />
for 10 s and wiped dry. Finally the impregnated Ba(NO3)2 was decomposed to BaO by heating to<br />
700 °C for 1 h. This procedure was repeated 3 times.<br />
10.2.4 <strong>Electrochemical</strong> characterization and conversion measurements<br />
The 3EP was mounted in the 3EP test set-up as described in chapter 3. The set-up was heated to<br />
700 ° for one hour to tighten the Ag sealings whereafter the temperature was decreased and the<br />
experiments performed in the temperature range 450 °C-650 °C. This temperature range, which is<br />
higher than the temperature range 300-500 °C used in the symmetric cell and porous stack tests,<br />
had to be chosen, since below 450 °C the resistance <strong>of</strong> the CGO 3EP was too high to perform any<br />
experiments. The experiments performed were polarisation/conversion experiments, cyclic<br />
voltammetry and impedance measurements; all performed by use <strong>of</strong> a Gamry Ref 600<br />
potentiostat. The polarisations were performed at -0.6 V polarisation for 2 h in 1000 ppm NO and<br />
1000 ppm NO + 10% O2, while the NO, NO2 and <strong>NOx</strong> concentration was monitored with a<br />
chemiluminscence detector (ThermoScientific). The cylic voltammetry was performed in the range<br />
± 0.8 V, at various sweep rates within the range 1-100 mV/s. Impedance spectra were recorded in<br />
the frequency range 1 MHz-0.001 Hz with 36 mV rms amplitude and 6 points pr. decade.<br />
10.3 Results<br />
10.3.1 Conversion<br />
Conversion measurements were made by monitoring changes in the gas composition during 2 h<br />
polarisation at -0.6 V. In Figure 68 and Figure 69 the conversion is stated for the non-impregnated<br />
and BaO-impregnated electrodes respectively, the conversion is stated relative to the <strong>NOx</strong>-<br />
151
10 Measurements on LSM15-CGO10 electrodes in a 3-electrode set-up.<br />
concentration measured before the polarisation. For both the non-impregnated and the BaO-<br />
impregnated electrode a total <strong>NOx</strong>-conversion in the range 60-80% is observed without a clear<br />
dependency on temperature. The NO2 conversion stays within 10-20% in the entire temperature<br />
range. On both electrodes the NO conversion apparently increases with temperature, with a jump<br />
in the NO conversion between 550 and 600 °C on the non-impregnated sample as the one<br />
exception. Impedance spectra recorded before and after each polarisation yielded no information<br />
on why a jump was observed in the conversion from 550 °C to 600 °C on the non-impregnated<br />
electrode.<br />
Figure 68. Conversion on non-impregnated LSM15-CGO10 electrode during 2 h polarisation at -0.6<br />
V in 1000 ppm NO.<br />
Figure 69. Conversion on Ba-impregnated LSM15-CGO10 electrode during 2 h polarisation at -0.6 V<br />
in 1000 ppm NO.<br />
152
10 Measurements on LSM15-CGO10 electrodes in a 3-electrode set-up.<br />
In the presence <strong>of</strong> 10% O2 <strong>NOx</strong> conversion in the range 1-4% was observed on both the non-<br />
impregnated and the BaO-impregnated electrode. Such low conversions are considered below the<br />
uncertainty <strong>of</strong> the experiments, and thus in reality no <strong>NOx</strong> conversion was observed in the<br />
presence <strong>of</strong> 10% O2 at -0.6V polarisation.<br />
In addition to the just described conversion measurements during 2 h <strong>of</strong> constant polarisation,<br />
short “conversion” experiments under variable polarisation were also conducted, as the gas<br />
composition was analysed during recording <strong>of</strong> CVs at various sweep rates (1 mV/s, 5 mV/s, 10<br />
mV/s, 15 mV/s, 50 mV/s and 100 mV/s). For high sweep rates (50 mV/s and 100 mV/s) the<br />
concentration changes were too fast for the CLD to detect, but at the lower sweep rates<br />
concentration changes during cathodic and anodic sweeps could clearly be distinguished. Exactly<br />
the same tendencies with respect to conversion <strong>of</strong> NO and NO2 was observed on the non-<br />
impregnated and the BaO-impregnated electrode, even though at 450 °C the non-impregnated<br />
electrode performed slightly better, i.e. caused the largest concentration changes, compared to<br />
the BaO-impregnated electrode, while at 650°C the BaO-impregnated cell stack showed the best<br />
performance. In Figure 70 to Figure 73 the changes in NO, NO2 and total <strong>NOx</strong> concentrations are<br />
illustrated for the BaO-impregnated electrode, as explained the same tendencies were observed<br />
on the non-impregnated sample. In 1000 ppm NO at 450 °C (Figure 70) it is observed how the<br />
cathodic polarisation to -0.8V is not enough to reduce the <strong>NOx</strong> to N2, while the anodic polarisation<br />
to +0.8V is sufficient polarisation for oxidation <strong>of</strong> NO to NO2. At 650 °C in 1000 ppm NO (Figure 71)<br />
oxidation <strong>of</strong> NO to NO2 is again observed during the anodic sweep, and during the cathodic sweep<br />
the polarisation to -0.8V has now become enough to reduce the <strong>NOx</strong> into N2. In the presence <strong>of</strong><br />
10% O2 at 450 °C (Figure 72), NO2 is reduced to NO during the cathodic sweep, and during anodic<br />
sweep the reverse process is going on: NO is oxidized to NO2. This is also observed in the presence<br />
<strong>of</strong> 10% O2 at 650 °C (Figure 73), only is the amount converted at this temperature very small,<br />
indicating the majority <strong>of</strong> the current is used for O2 <strong>reduction</strong>/O 2- oxidation.<br />
153
10 Measurements on LSM15-CGO10 electrodes in a 3-electrode set-up.<br />
Figure 70. Concentration changes in NO, NO2 and <strong>NOx</strong> during cyclic voltammetry at ±0.8V, sweep<br />
rate 1 mV/s in 1000 ppm NO at 450 °C on BaO-impregnated electrode.<br />
Figure 71. Concentration changes in NO, NO2 and <strong>NOx</strong> during cyclic voltammetry at ±0.8V, sweep<br />
rate 1 mV/s in 1000 ppm NO at 650 °C on BaO-impregnated electrode.<br />
154
10 Measurements on LSM15-CGO10 electrodes in a 3-electrode set-up.<br />
Figure 72. Concentration changes in NO, NO2 and <strong>NOx</strong> during cyclic voltammetry at ±0.8V, sweep<br />
rate 1 mV/s in 1000 ppm NO + 10% O2 at 450 °C on BaO-impregnated electrode.<br />
Figure 73. Concentration changes in NO, NO2 and <strong>NOx</strong> during cyclic voltammetry at ±0.8V, sweep<br />
rate 1 mV/s in 1000 ppm NO + 10% O2 at 650 °C on BaO-impregnated electrode.<br />
155
10 Measurements on LSM15-CGO10 electrodes in a 3-electrode set-up.<br />
10.3.2 Cyclic voltammetry<br />
Cyclic voltammograms were recorded between the voltage limits ±0.8V. Even though the potential<br />
applied (Uapplied) was ±0.8V the electrode potential (Uelectrode) would differ from Uapplied due to the<br />
potential drop through the thick CGO10 3EP. Theoretically Uelectrode may be calculated according to<br />
equation 10.1:<br />
Uelectrode= Uapplied-RsI 10.1<br />
- In which Rs is the serial resistance <strong>of</strong> the CGO10 3EP. It was attempted to calculate Uelectrode<br />
according to equation 10.1 by using the Rs determined from impedance spectra recorded before<br />
and after the cyclic voltammograms. However this led to erroneous results as shown in Figure 74,<br />
where it is illustrated how this approach leads to “over-correcting” during the anodic sweep,<br />
which after the correction has moved partly to negative polarisations. The over-correction<br />
indicates the Rs determined at OCV before the cyclic voltammetry was higher than the actual Rs<br />
during the cyclic voltammetry. The Rs decrease during polarisation could be due to resistive<br />
heating <strong>of</strong> the CGO 3EP or an activation phenomenon occurring during polarisation, both<br />
possibilities will be discussed further in the discussion section.<br />
Figure 74. Cyclic voltammogram recorded on BaO-impregnated electrode at 650 °C in 1000 ppm<br />
NO at sweep rate 10 mV/s. The cyclic voltammogram without IR correction and with (erroneous)<br />
IR correction is shown.<br />
156
10 Measurements on LSM15-CGO10 electrodes in a 3-electrode set-up.<br />
10.3.3 Impedance results<br />
Impedance spectra were recorded on both the non-impregnated and the BaO-impregnated<br />
electrode at various conditions. In order to investigate the temperature dependence impedance<br />
spectra were recorded in the temperature range 450-650 °C for each 50 °C in both 10% O2 and<br />
1000 ppm NO + 10% O2. For a further investigation <strong>of</strong> the processes contributing to the<br />
polarisation resistances impedance spectra were recorded at 450 °C and 650 °C at various<br />
concentrations and flow rate: First the NO concentration was varied between 1000 ppm NO, 1500<br />
ppm NO and 2000 ppm NO while the O2 concentration was fixed at 10%, secondly the O2<br />
concentration was varied between 10, 5 and 15% while the NO concentration was fixed at 1000<br />
ppm NO, and finally the gas flow rate in both 1000 ppm NO and in 1000 ppm NO + 10% O2 was<br />
varied between 5, 7.5 and 6 ml/min. Furthermore experiments were made during which Uapplied<br />
was increased from OCV to 0.1, 0.2, 0.3, 0.6 and 0.8 V. The impedance spectra recorded were<br />
deconvoluted using the Zview2 s<strong>of</strong>tware 107 and an equivalent circuit consisting <strong>of</strong> one serial<br />
resistance and 3-5 R-CPE elements in series.<br />
10.3.4 General observations<br />
On the non-impregnated electrode the impedance spectra recorded in 10% O2 at 450 °C are<br />
dominated by one single arc, which is slightly distorted in the high frequency part, see Figure 75<br />
for comparison <strong>of</strong> impedance spectra recorded in 10% O2 and 1000 ppm NO + 10% O2. As the<br />
temperature is increased from 450 °C to 650 °C, the high frequency part becomes increasingly<br />
affected by a capacitive contribution. This capacitive contribution is caused by a large impedance<br />
at the reference electrode, and is thus related to the measurement set-up and not working<br />
electrode under study 172 . In 1000 ppm NO + 10% O2 the polarisation resistance at 550 °C and<br />
below appear to be significantly smaller compared to in 10% O2, and furthermore the impedance<br />
spectra recorded at 550 °C and below appear to contain contributions from at least two<br />
dominating arcs. As the temperature is increased, the impedance spectra recorded in 1000 ppm<br />
NO + 10% O2 become more and more similar to those recorded in 10% O2, as the polarisation<br />
resistances become similar, the spectra appear to be dominated by one arc, and a capacitive<br />
contribution in the high frequency becomes visible<br />
157
10 Measurements on LSM15-CGO10 electrodes in a 3-electrode set-up.<br />
Figure 75. Impedance spectra recorded on non-impregnated LSM15-CGO10 electrode in 10% O2 or<br />
1000 ppm NO + 10% O2 at a) 450 °C and b) 650 °C.<br />
For the BaO impregnated electrode the polarisation resistance is first <strong>of</strong> all significantly lower<br />
compared to the non-impregnated electrode, see Figure 76 for a comparison between spectra<br />
recorded on the non-impregnated and the BaO-impregnated electrodes at various temperatures.<br />
Apart from the difference in total polarisation resistance, many <strong>of</strong> the tendencies observed on the<br />
BaO-impregnated electrodes are similar to the tendencies observed on the non-impregnated<br />
electrodes, namely increasing alikeness between the spectra recorded in 10% O2 and 1000 ppm<br />
NO + 10% O2 with increasing temperature, and the appearance <strong>of</strong> an capacitive contribution in the<br />
high frequency part caused by the measurement set-up. One significant difference is however<br />
observed between the non-impregnated and the BaO-impregnated electrodes at 600 and 650 °C,<br />
as the high frequency part at these temperatures become dominated by an inductive tail rather<br />
than a capacitive contribution, see Figure 76c.<br />
158
10 Measurements on LSM15-CGO10 electrodes in a 3-electrode set-up.<br />
Figure 76. Impedance spectra recorded in 1000 ppm NO + 10% O2 on non-impregnated (N) and<br />
BaO-impregnated (B) electrodes at a) 450 °C, b) 550 °C and c) 650 °C.<br />
159
10 Measurements on LSM15-CGO10 electrodes in a 3-electrode set-up.<br />
10.3.5 Serial resistance and polarisation resistance<br />
The serial resistance obtained from fitting <strong>of</strong> the impedance spectra recorded in 1000 ppm NO +<br />
10% O2 and 10% O2 are shown in Figure 77. Fairly good agreement is obtained for the serial<br />
resistances independent <strong>of</strong> atmosphere and independent <strong>of</strong> whether the working electrode was<br />
impregnated or not. The one exception is the serial resistances obtained in 10% O2 on the non-<br />
impregnated cell stacks, as these values for unknown reasons appear to be slightly lower than the<br />
others. Overall, the good agreement between the serial resistances determined indicate, that any<br />
differences observed in the polarisation resistances between the non-impregnated and the BaO-<br />
impregnated electrodes are due to a difference in electrodes rather than a difference in electric<br />
contacting through in the set-up.<br />
Figure 77. Serial resistance on 3EPs with a non-impregnated (N) and BaO-impregnated (B) working<br />
electrode. The values are determined from impedance spectra recorded in 1000 ppm NO + 10% O2<br />
or 10% O2 only.<br />
The polarisation resistances for the non-impregnated and the BaO-impregnated electrodes are<br />
shown in Figure 78. Clearly the BaO impregnation has caused a general decrease in the<br />
polarisation resistance both in 1000 ppm NO + 10 % O2 and in 10% O2. Another clear tendency<br />
observed in Figure 78 is the polarisation resistance at temperatures ≤550 °C is lower in 1000 ppm<br />
NO + 10% O2 compared to in 10% O2, whereas above 550 °C the polarisation resistance in the two<br />
160
10 Measurements on LSM15-CGO10 electrodes in a 3-electrode set-up.<br />
different atmospheres become alike. This tendency is observed both on the non-impregnated and<br />
the BaO-impregnated electrodes.<br />
Figure 78. Polarisation resistance on non-impregnated (N) and BaO-impregnated (B) electrodes in<br />
1000 ppm NO +10% O2 and 10% O2.<br />
10.3.6 Identification <strong>of</strong> electrode processes<br />
On the non-impregnated electrodes 4 R-CPE elements were used for fitting <strong>of</strong> the impedance<br />
spectra recorded in 1000 ppm NO + 10% O2 at 450 °C, indicating that four processes contributed to<br />
the polarisation resistance. The fitting <strong>of</strong> the process located at the highest frequencies was<br />
questionable due to distortion <strong>of</strong> the spectra in this region. The three processes located at the<br />
lower frequencies were all similar in size and dominated the impedance spectra, see Figure 79a for<br />
an illustration <strong>of</strong> the deconvolution <strong>of</strong> an impedance spectra recorded at 450 °C. At 650 °C 4<br />
processes contributed to the polarisation resistance, and <strong>of</strong> these processes the process located at<br />
the lowest frequencies was entirely dominating. A representative example <strong>of</strong> fitting <strong>of</strong> the<br />
impedance spectra recorded at 650 °C is shown in Figure 79b.<br />
161
10 Measurements on LSM15-CGO10 electrodes in a 3-electrode set-up.<br />
Figure 79. Deconvolution <strong>of</strong> impedance spectra recorded on non-impregnated electrode in 1000<br />
ppm NO + 10% O2.at a) 450 °C and b) 650 °C.<br />
As previously explained variations in flow, concentration and polarisation were performed in order<br />
to characterize the processes contributing to the polarisation resistance <strong>of</strong> the electrodes. No<br />
effect at all was observed when varying the flow in 1000 ppm NO or 1000 ppm NO + 10% O2.<br />
Furthermore no clear effect on the Cω’s was observed neither when temperature was varied nor<br />
while the concentrations were changed. For this reason the characteristics identified and listed in<br />
Table 31 are limited to the resistances dependency on concentrations and polarisation. The<br />
resistance <strong>of</strong> the two processes located at the lowest frequencies did at both 450 °C and 650 °C<br />
decrease with increasing NO concentration, while only at 650 °C, a decrease in the arc 4 resistance<br />
was observed with increasing O2 concentration. The activation energy <strong>of</strong> process 4 was calculated<br />
to be 0.81 eV in 1000 ppm NO + 10% O2. The resistance <strong>of</strong> both arc 2, 3 and 4 changed during<br />
polarisation at 450 °C. The effect <strong>of</strong> the polarisation at 450 °C is illustrated in Figure 80. Fitting <strong>of</strong><br />
the impedance spectra recorded before and during polarisation showed, that during polarisation<br />
at small voltages (0.1V, 0.2V and 0.3V) the resistance <strong>of</strong> process 3 decreased while the resistance<br />
<strong>of</strong> process 2 and 4 increased, while at higher polarisation (0.6V) the resistances <strong>of</strong> process 2, 3 and<br />
4 all decreased and the impedance spectra changed shape dramatically, as also evident in Figure<br />
80.<br />
162
10 Measurements on LSM15-CGO10 electrodes in a 3-electrode set-up.<br />
Table 31. Characteristics <strong>of</strong> processes on the non-impregnated electrodes.<br />
Proces Freq. range Characteristic<br />
1 60-300 kHz<br />
2+3 80-3000 Hz - R dependent on pNO at 650 °C (decrease with increasing pNO)<br />
- R dependent on polarisation<br />
4 1-11 Hz - R dependent on pNO at 450 °C(decrease with increasing pNO)<br />
- R dependent on pO2 at 650 °C (decrease with increasing pO2)<br />
- R dependent on polarisation<br />
5~ 0.07-0.5 Hz - R dependent on pNO (decrease with increasing pNO)<br />
~only observed at 450 °C<br />
Figure 80. Effect <strong>of</strong> polarisation on non-impregnated electrode.<br />
For the BaO-impregnated electrodes the impedance spectra recorded at 450 °C were fitted with 5<br />
R-CPE elements, indicating 5 processes contributed to the polarisation resistance. As for the non-<br />
impregnated electrode the fitting <strong>of</strong> the high frequency process was questionable due to a<br />
distortion <strong>of</strong> the spectra in that frequency range. The main contributors to the polarisation<br />
resistance was the three processes located at the lowest frequencies, and finally in between the<br />
high frequency process and the three low frequency processes a tiny process was located, see<br />
Figure 81a for a representative deconvolution <strong>of</strong> an impedance spectre recorded at 450 °C in 1000<br />
ppm NO + 10% O2. It should be noted, that even though the arc corresponding to process 2<br />
appears insignificant in size compared to the other arcs, omitting process 2 from the fitting was<br />
not an possibility, as this led to a total and unfavourable change in the fit. At 650 °C 4 processes<br />
contributed to the polarisation resistance <strong>of</strong> the BaO-impregnated electrode, 3 <strong>of</strong> these arcs<br />
dominated the impedance spectra; while the last process located at the lowest frequencies only<br />
gave a small contribution to the polarisation resistance, see Figure 81b for an example <strong>of</strong> the<br />
deconvolution <strong>of</strong> an impedance spectra recorded at 650 °C.<br />
163
10 Measurements on LSM15-CGO10 electrodes in a 3-electrode set-up.<br />
Figure 81. Representative deconvolution <strong>of</strong> impedance spectra recorded on a BaO-impregnated<br />
electrode in 1000 ppm NO + 10% O2 at a) 450 °C and b) 650 °C.<br />
The characteristics <strong>of</strong> the electrode processes determined during concentration and polarisation<br />
variations are stated in Table 32 and in Figure 82 the effect <strong>of</strong> polarisation on the impedance<br />
spectra is shown. In general, when flow variations were performed no significant changes were<br />
observed in the impedance spectra. With respect to the effect <strong>of</strong> concentration variations, the<br />
resistance <strong>of</strong> process 4 appeared to be the only resistance with a clear dependency on the gas-<br />
composition, as the resistance <strong>of</strong> the process decreased with increasing NO concentration at 450<br />
°C and decreased with increasing O2 concentration at 650 °C. The activation energy calculated for<br />
this process was 1.13 eV. With respect to polarisation some <strong>of</strong> the processes appeared to be more<br />
sensitive towards polarisation than others. At 0.6 V and 0.8 V polarisation the resistance <strong>of</strong> all the<br />
processes decreased, while at lower polarisations (0.1 V, 0.2 V and 0.3 V) only the resistance <strong>of</strong><br />
process 3 and 5 decreased during polarisation.<br />
164
10 Measurements on LSM15-CGO10 electrodes in a 3-electrode set-up.<br />
Table 32. Characteristics <strong>of</strong> processes identified on BaO-impregnated electrodes.<br />
Proces Freq. range Characteristic<br />
1 6-25 kHz - R decreases with polarisation ≥0.6V<br />
2* 4 kHz<br />
3 0.3-2 kHz - Cω dependent on pNO (increase with increasing pNO)<br />
- R decreases with polarisation<br />
4 2-200 Hz - R dependent on pNO at 450 °C (decreasing with increasing pNO)<br />
- R dependent on pO2 at 650 °C (decreasing with increasing pO2)<br />
- R decreases with polarisation ≥0.6V<br />
5’ 0.04-60 Hz - Cω dependent on pO2 at 650 °C (increase with increasing pO2)<br />
* only at 450 °C, ‘ at 450 °C and 650 °C<br />
- R decreases with polarisation<br />
Figure 82. Impedance spectra recorded on BaO-impregnated electrode at OCV and during<br />
different polarisations.<br />
165
10.4 Discussion<br />
10 Measurements on LSM15-CGO10 electrodes in a 3-electrode set-up.<br />
10.4.1 Comparison <strong>of</strong> electrode processes on non-impregnated and BaO-impregnated<br />
electrodes<br />
In Table 31 and Table 32 the characteristics <strong>of</strong> the electrode processes on the non-impregnated<br />
and BaO-impregnated electrodes were listed. A common feature for both the non-impregnated<br />
and the BaO-impregnated electrodes was process 4 located within the frequency range 1-300 Hz<br />
which gave a significant contribution to the polarisation resistance. On both the non-impregnated<br />
and the BaO-impregnated electrode process 4 was dependent on the NO concentration at 450 °C<br />
and the O2 concentration at 650 °C and decreased with polarisation. Due to the dependency on gas<br />
composition and polarisation, the process is assumed to be due to a dissociative adsorption,<br />
surface diffusion or charge transfer at the TPB region, and considering the findings in chapter 8 a<br />
first suggestion is the process is due to <strong>NOx</strong> adsorption/nitrate formation at the electrode. The<br />
fact that process 4 does not depend on the same gas component at 450 °C and 650 °C could at first<br />
hand led to the conclusion, that an arc in the impedance spectra falsely had been ascribed to the<br />
same process even though the arc in reality was caused by one NO dependent process at 450 °C<br />
and a different more O2 dependent process at 650 °C. To clarify this an Arrhenius plot <strong>of</strong> the<br />
process 4 resistance was made, both with resistances found in 1000 ppm NO + 10% O2<br />
atmosphere and in only 10% O2, see Figure 83. On the Arrhenius plot very good linearity is<br />
obtained (R 2 >0.99) for both kind <strong>of</strong> electrodes, with the one exception that R 2 in 1000 ppm NO +<br />
10% O2 on the non-impregnated electrode is only 0.98. This slightly lower R 2 value could indicate a<br />
change in the process occurring on the non-impregnated electrode with temperature, but could<br />
also just be accidental, considering R=0.98 still is fairly high value. A shift in electrode process with<br />
temperature is supported by the finding by Reinhardt et al. that in NO and O2 containing<br />
atmospheres LSM/YSZ electrodes reacts preferably with NO/NO2 below 650 °C and preferably<br />
with O2 at T≥650 °C 25 , which is overlapping with the temperature range used in these experiments.<br />
With respect to the BaO-impregnated electrode, no change in process 4 with temperature is<br />
observed, as the Arrhenius plot is very linear, and as previously mentioned the characteristic<br />
during flow variation and polarisation was very similar for process 4 on both the non-impregnated<br />
and the BaO-impregnated electrode. Another clear feature in Figure 83 is the resistance is<br />
consequently lower on the BaO-impregnated electrode, both in 1000 ppm NO + 10% O2 and in<br />
166
10 Measurements on LSM15-CGO10 electrodes in a 3-electrode set-up.<br />
10% O2 only, the same tendency was observed on the Arrhenius plot <strong>of</strong> the total polarisation<br />
resistance shown in Figure 78, which is consistent with finding in chapter 8 <strong>of</strong> a general activation<br />
<strong>of</strong> the electrode caused by the BaO impregnation. Finally Figure 83 also show a significant<br />
difference in the activation energies for arc 4 on the non-impregnated electrodes (0.81 eV (1000<br />
ppm NO + 10% O2) and 1.81 eV (10% O2) whereas on the BaO-impregnated electrodes the<br />
activation energies in 1000 ppm NO + 10% O2 and 10% O2 are very alike (1.13 eV (1000 ppm NO +<br />
10% O2) and 1.19 eV (10% O2)). Further experiments are needed to clarify the reason for this.<br />
Figure 83. Arrhenius plot <strong>of</strong> the resistances <strong>of</strong> process 4 on the non-impregnated and the BaO-<br />
impregnated electrode.<br />
With respect to the other processes occurring on the electrodes the characteristics are too few to<br />
justify any attempt to identify the processes.<br />
10.4.2 Comparison to conversion on porous cell stacks<br />
The <strong>NOx</strong> conversion on the BaO-impregnated LSM15-CGO10 electrodes in the 3EP set-up was 60-<br />
80% when the electrode was supplied with 1000 ppm NO in the temperature range 450-650 °C,<br />
which is in fairly good agreement with the conversion obtained on the Ba-impregnated LSM15-<br />
CGO10 porous cell stacks at similar conditions (see Figure 51 in chapter 8). Surprisingly, the non-<br />
impregnated LSM15-CGO10 electrode in the 3EP set-up showed a similar high conversion, while<br />
no <strong>NOx</strong> conversion was observed on non-impregnated LSM15-CGO10 cell stacks. The difference<br />
could be due to the difference in temperature range and flow rate/flow distribution between the<br />
167
10 Measurements on LSM15-CGO10 electrodes in a 3-electrode set-up.<br />
porous cell stack set-up and the 3EP set-up. Furthermore <strong>NOx</strong> conversion was observed on the<br />
BaO-impregnated porous cell stack in the presence <strong>of</strong> 10% O2, which was not observed in the 3EP<br />
set-up. Probably this was because the electrode in the 3EP set-up was not polarised enough, but<br />
as explained in the following section determining the actual polarisation across the electrode by<br />
correcting for the IR drop was problematic in these 3EP experiments.<br />
10.4.3 IR correction<br />
As shown in the Results section IR correction <strong>of</strong> the cylic voltammograms by means <strong>of</strong> Rs<br />
determined from impedance spectra led to erroneous results. The correction problem occurred on<br />
cyclic voltammograms recorded at 650 °C, but not on those recorded at 450 °C. A first possible<br />
explanation could be Rs at 650 °C was determined falsely at a too large value, possibly due to the<br />
large inductive distortion in the high frequency region <strong>of</strong> the spectra. However, the inductance <strong>of</strong><br />
the set-up was determined to 2.2x10 -6 H, and as this inductance was included in the fitting <strong>of</strong> the<br />
impedance spectra, the Rs <strong>of</strong> impedance spectra recorded before and after the cyclic<br />
voltammegrams was correctly determined. This indicates Rs actually decreased during the cyclic<br />
voltammetry/polarisation.<br />
A possible explanation <strong>of</strong> the decrease in Rs is resistive heating <strong>of</strong> the CGO 3EP during the<br />
polarisation, as resistive heating previously had been observed significantly to affect<br />
measurements on YSZ 3EP during polarisation 173 . Unfortunately the temperature <strong>of</strong> the 3EP could<br />
only be measured at OCV, as the probe for temperature measurements was the same probe as<br />
used for polarisation <strong>of</strong> the electrode. The logging frequency <strong>of</strong> the temperature measurement<br />
was once every minute. When the temperature <strong>of</strong> the 3EP immediately before and immediately<br />
after the cyclic voltammetry was compared a temperature difference <strong>of</strong> maximum 1 °C was<br />
observed, which was also the maximum temperature measured before and after the 2 h at<br />
constant -0.6V polarisation. If resistive heating is occurring in the 3EP during polarisation it cannot<br />
be a dramatic heating, since the 3EP apparently cooled down to the furnace temperature within 1<br />
minute after the polarisation was removed, which questions resistive heating as an explanation <strong>of</strong><br />
the Rs decrease. An argument against resistive heating is also the problem with overcorrection <strong>of</strong><br />
CV’s appeared at 650 °C but not at 450 °C, whereas resistive heating would be expected to<br />
increase with decreasing temperature. This argument is however not as simple, since the resistive<br />
heating is not only dependent on the resistance, but also on the current passing, which increase<br />
168
10 Measurements on LSM15-CGO10 electrodes in a 3-electrode set-up.<br />
with the electrode activity, which increases with temperature. In principle it should be also be<br />
possible to determine the resistive heating from impedance spectra recorded under current load.<br />
However the impedance spectra recorded under current load (as in Figure 80 and Figure 82)<br />
where all recorded in a way where the current load was applied exactly when the recording <strong>of</strong> the<br />
impedance spectrum was started. The Rs in the impedance spectrum is determined during less<br />
than a minute in the beginning <strong>of</strong> the measurement, which likely is before the resistive heating<br />
start to play a role, which means the impedance spectra recorded under current load in these<br />
experiments cannot be used for determination <strong>of</strong> the resistive heating. For the next experiments<br />
it would be advantageous to check for resistive heating by mounting an extra thermocouple for<br />
temperature determination at the vicinity <strong>of</strong> the 3EP.<br />
The decrease in Rs during polarisation could possibly be explained by other reason than resistive<br />
heating. During consideration <strong>of</strong> other explanations it must be kept in mind the Rs decrease<br />
occurred only during polarisation, as Rs determined on impedance spectra recorded at OCV<br />
immediately before and after polarisation was constant. Activation <strong>of</strong> LSM-electrodes during<br />
polarisation is a well-known phenomenon which has been studied by several groups, but usually<br />
only a decrease in the polarisation resistance is observed while the serial resistance remains<br />
unaffected or increases 156, 174, 175 . A phenomenon, which may have an impact on the serial<br />
resistance was studied by Backhaus-Ricoult 59 . By means <strong>of</strong> scanning photoelectron microscopy <strong>of</strong><br />
the LSM-YSZ interface during polarisation, it was observed Mn 2+ ion spread over the YSZ surface<br />
during polarisation, and this strong enrichment <strong>of</strong> the YSZ surface caused a high electronic<br />
conductivity in the electrolyte 59 . The spreading <strong>of</strong> the Mn 2 + ions was a reversible process, as the<br />
ions withdraw when the polarisation was removed 59 . Kharton et al. has previously identified that<br />
during doping <strong>of</strong> CGO with manganese, the electronic conductivity increased if the 10% solubility<br />
limit <strong>of</strong> manganese in CGO was exceeded 176 . It is therefore suggested the temporary decrease in Rs<br />
during polarisation observed in this work is due to spreading <strong>of</strong> manganese ions on the CGO<br />
electrolyte surface caused by the polarisation, followed by an increase in the electronic<br />
conductivity in the CGO surface due to the manganese enrichment.<br />
169
10.5 Conclusion<br />
10 Measurements on LSM15-CGO10 electrodes in a 3-electrode set-up.<br />
<strong>Electrochemical</strong> measurements (EIS and CV) were made on a non-impregnated and a BaO-<br />
impregnated electrode in a 3EP set-up. The experiments were aimed at giving a more detailed<br />
insight into the electrochemical de<strong>NOx</strong> processes compared to the measurements performed on<br />
symmetric cell and porous cell stacks. The more detailed insight was expected as the 3EP set-up<br />
contained one well-defined working electrode in a three-electrode set-up with a fixed reference<br />
potential, and furthermore the outlet gas from the set-up was monitored by a CLD. Whereas the<br />
impedance spectra revealed a decrease in the polarisation resistance due to the BaO<br />
impregnation, a better performance <strong>of</strong> the BaO-impregnated electrodes was not measured during<br />
the conversion measurements as measured on the porous cell stacks. The reason for the lack <strong>of</strong><br />
better performance may be the chosen temperature and polarisation range. Furthermore<br />
problems were encountered in determining the IR drop and thereby the electrode polarisation<br />
during the polarisation experiments, by comparison to literature this was suggested to be due<br />
manganese enrichment <strong>of</strong> the CGO surface during polarisation. As only two electrodes were<br />
investigated in the 3EP set-up (one non-impregnated and one BaO-impregnated) it is<br />
recommended to do more experiments in the 3EP set-up to allow for a better comparison to the<br />
experiments performed in the other set-ups.<br />
170
11 Construction <strong>of</strong> an in situ XANES test house<br />
11 Construction <strong>of</strong> an in situ XANES test house<br />
11.1 Introduction<br />
In chapter 4 on DRIFT spectroscopy the focus was on <strong>NOx</strong> species adsorbed on the electrode<br />
materials, and how the adsorbed species changed depending on the experimental conditions:<br />
temperature, atmosphere etc. In order to understand the processes occurring during<br />
electrochemical de<strong>NOx</strong> it is however important, not only to consider the species adsorbed on the<br />
electrode, but also to consider changes occurring in the electrode material during operation.<br />
Knowledge on this may increase the understanding <strong>of</strong> the electrocatalytic properties <strong>of</strong> different<br />
electrode materials and ultimately guide the search for new, better performing electrodes.<br />
During polarization <strong>of</strong> a solid oxide electrode one <strong>of</strong> the changes expected to happen is a change<br />
in the oxidation state <strong>of</strong> one or more <strong>of</strong> the elements in the electrode (for instance Mn in LSM<br />
electrodes or Co in LSCF electrodes). A change in oxidation state may be detected by application <strong>of</strong><br />
X-ray Absorbtion Near Edge Spectroscopy (XANES) and in agreement with the theory a change in<br />
oxidation state caused by polarisation has been detected by means <strong>of</strong> XANES on thin-film<br />
electrodes <strong>of</strong> LSCF 177 and LSM 178 . Unfortunately none <strong>of</strong> the aforementioned in situ XANES studies<br />
report clearly how the measurements were made, i. e. how the test house was constructed in<br />
order to perform the in situ studies. True in situ XANES studies require: 1) a controlled<br />
atmosphere 2) heating <strong>of</strong> the sample 3) electric contact to the sample and 4) a “window” through<br />
which the X-ray beam can access the electrode surface and a window through which the<br />
fluorescence light from the electrode can reach the detector. Due to requirement 4) an in situ<br />
XANES test house must be designed quite differently from the test houses normally used for<br />
electrochemical characterization <strong>of</strong> solid oxide electrodes.<br />
This chapter describes how an in situ XANES test house was designed and constructed, and also<br />
the results from the first initial measurements on LSM15-CGO10 composite electrodes are<br />
described. The construction <strong>of</strong> the in situ XANES test house and the subsequent measurements<br />
was a joint project made together with Anke Hagen, Ragnar Kiebach and Bjørn Sejr Johansen, who<br />
all at the time were employed in the Fuel Cell and Solid State Chemistry Division. The projected<br />
also resulted in an article published in Journal <strong>of</strong> Synchroton Radiation, see appendix A.<br />
171
11.2 Theory<br />
78, 179<br />
11.2.1 XAS<br />
11 Construction <strong>of</strong> an in situ XANES test house<br />
X-ray Absorption Spectroscopy (XAS), is, as the name implies, based on the absorption <strong>of</strong> X-rays.<br />
When an incident X-ray photon hits an element and the X-ray energy matches the binding energy<br />
<strong>of</strong> an electron <strong>of</strong> the atom, the photon may get absorbed causing a drop in the X-ray intensity. The<br />
result is an absorption edge in the X-ray absorption spectrum, which is element specific due to the<br />
different binding energies <strong>of</strong> the electrons in the atoms and furthermore dependent on the<br />
oxidation state <strong>of</strong> the element.<br />
An X-ray absorption spectrum can be recorded either by measuring the transmission or the<br />
fluorescence signal, in this project the fluorescence signal was used. Using the fluorescence signal<br />
for XAS is based on the following principle: After an absorption event, the atom is in an excited<br />
state, with one <strong>of</strong> the core electron levels left empty (core hole). One important mechanism for<br />
the decay <strong>of</strong> the excited atomic state following an X-ray absorption event is X-ray fluorescence, in<br />
which a higher energy electron core-level electron fills the deeper core hole, ejecting an X-ray <strong>of</strong><br />
well-defined energy. Detection <strong>of</strong> the fluorescence energies emitted in this way may then be used<br />
for creation <strong>of</strong> an X-ray absorption spectrum.<br />
In an X-ray absorption spectrum the electronic transitions give rise to distinct features like<br />
absorption edges, pre-edge features and post-edge features. These features may be used for<br />
analyses in X-ray Absorption Near Edge Structures (XANES), which focuses on the region around<br />
the absorption edge, or in Extendend X-ray Absorption Fine Structure (EXAFS) spectroscopy, which<br />
focuses on the post edge features. In Figure 84 a sketch <strong>of</strong> an X-ray absorption spectrum is shown<br />
and the regions <strong>of</strong> the spectrum investigated in XANES and EXAFS are marked. EXAFS can be used<br />
for determination <strong>of</strong> the coordination environment around specific atoms, while in XANES the<br />
position <strong>of</strong> the absorption edge may be used for determination <strong>of</strong> the oxidation state <strong>of</strong> an<br />
element. For transition metals <strong>of</strong> the 4 th period the K absorption edge, which corresponds to<br />
transition <strong>of</strong> a 1s core electron into a p-like unoccupied state, is typically used in XANES for<br />
determination <strong>of</strong> the oxidation state. Correspondingly, in this work the Mn K absorption edge was<br />
investigated during XANES measurement, in order to monitor a possible change in Mn oxidation<br />
state due to polarisation.<br />
172
11 Construction <strong>of</strong> an in situ XANES test house<br />
Figure 84. Sketch <strong>of</strong> X-ray absorption spectrum around an absorption edge.<br />
11.2.2 Polarisation <strong>of</strong> solid oxide electrodes<br />
As stated in the introduction, a change in oxidation state is expected and has been experimentally<br />
measured in solid oxide electrodes during polarization. The change in oxidation state follows from<br />
the change in oxygen stochiometry caused by the polarization. Due to the polarization the O 2- ions<br />
move through the crystal lattice <strong>of</strong> the solid oxide electrode, which increases the number <strong>of</strong><br />
oxygen vacancies, and in order to retain charge neutrality the oxidation state <strong>of</strong> the cations is<br />
changing, which may be detected by XANES. However, the change in oxidation state will not occur<br />
evenly through the entire electrode 155 . The reason for this is easiest explained with reference to<br />
the equivalent circuit for a mixed-conducting electrode shown in Figure 85. As shown in the<br />
equivalent circuit, the current may pass through the electrode to the electrolyte either via<br />
electronic conduction or ionic conduction, but before the O 2- conducting electrolyte is reached the<br />
oxygen charge transfer must have taken place. The extension <strong>of</strong> O 2- conduction through the<br />
electrode depends on the temperature. At low temperatures the oxygen charge transfer<br />
resistance will be much higher than the ohmic resistance <strong>of</strong> the electrode (RCT>>RΩ), for this reason<br />
an extensive ionic conduction will take place through the electrode. In contrast, at higher<br />
temperatures, the charge transfer resistance will be much lower compared to the ohmich<br />
resistance (RCT
11 Construction <strong>of</strong> an in situ XANES test house<br />
Figure 85. Infinite transmission-line describing a mixed ionic-electronic conductor<br />
In the work described in this chapter conventional 10 μm thick porous LSM15-CGO10 electrodes<br />
were employed, and the measurements were performed at 300-350 °C. However, as discussed in<br />
the results section the combination <strong>of</strong> electrode thickness and temperature may have been<br />
insufficient for detection <strong>of</strong> changes in electrode oxidation states by means <strong>of</strong> XANES.<br />
11.2.3 Previous work on in situ XANES on electrochemical devices<br />
To the best <strong>of</strong> the author’s knowledge, in situ studies on solid oxide electrodes/electrolytes<br />
including polarisation have so far only been reported by Japanese scientists, who studied the<br />
effect <strong>of</strong> polarisation on LSM electrodes 178 , LSCF electrodes 177 and Mn doped YSZ electrolyte 180 .<br />
However the studies were only reported in short meeting abstracts, which yielded little<br />
information on the actual set-up/test-house used for the in situ measurements. Inspiration for<br />
construction <strong>of</strong> an in situ test house can be gained from another field, namely the lithium-ion<br />
battery field, where for instance Braun et al. 181 and Balasubramanian et al. 182 have given detailed<br />
descriptions <strong>of</strong> tests houses used for in situ XAS <strong>of</strong> lithium-ion battery electrodes. Even though<br />
these test houses are useful as inspiration, their construction is not directly applicable in the solid<br />
oxide electrode field, as the lithium-ion batteries operate at room temperature. For this reason<br />
the litium-ion battery in situ test house does not need a system for heating the sample, which is a<br />
necessity for in situ studies <strong>of</strong> solid oxide electrodes.<br />
174
11.3 Experimental<br />
11.3.1 Design <strong>of</strong> in situ XANES test house<br />
11 Construction <strong>of</strong> an in situ XANES test house<br />
Two photos <strong>of</strong> the test house designed for the in situ XANES measurements are shown in Figure<br />
86, one front view and one side view. The test house is basically a small aluminium chamber (8 cm<br />
x 8 cm x 4 cm) in which the sample is placed in the middle fixed to a thin alumina tube. Heating <strong>of</strong><br />
the sample is achieved by means <strong>of</strong> a halogen lamp (Osram, model XENOPHOT® 64635 HLX, max.<br />
voltage 15 V, max. effect 15 W) located at the back <strong>of</strong> the chamber. On the sides <strong>of</strong> the chamber<br />
an inlet and outlet for the gas flow is located, together with windows covered by Kapton® foil for<br />
the X-ray beam to pass through. The sample is as mentioned fixed to an alumina tube, which is<br />
mounted in the top <strong>of</strong> the chamber. Finally the front <strong>of</strong> the chamber is covered by a Kapton® foil<br />
window which is 5 cm in diameter. It is through this window the fluorescence signal from the<br />
sample is detected.<br />
11.3.2 Sample preparation and mounting<br />
Figure 86. In situ XANES cell front view and side view<br />
The samples used in this work were symmetric cells with a dense 200 μm thick CGO10 electrolyte<br />
(Kerafol) and porous, 10 μm thick LSM15-CGO10 composite electrodes. The LSM15 used for the<br />
electrodes was synthesized in-house by the glycine-nitrate combustion synthesis 150 using nitrates<br />
from Alfa Aesar. The stochiometry <strong>of</strong> the synthesized LSM15 was (La0.85Sr0.15)0.99MnO3, i.e. the<br />
LSM15 was slightly deficient on the A-site. The LSM15 was mixed with CGO10 (Rhodia) in a<br />
terpineol based paste with 50 wt% LSM15 and 50 wt% CGO10. Subsequent the paste was screen-<br />
printed on the CGO electrolyte and the cells were sintered with the maximum temperature 1050<br />
°C held for 2 h, whereafter they were cut into 6 mm x 6 mm squares.<br />
175
11 Construction <strong>of</strong> an in situ XANES test house<br />
For mounting <strong>of</strong> the cells a sample holder with Pt wires was prepared. Two platinum wires were<br />
pulled through the channels <strong>of</strong> an 80 mm long and 4 mm thick alumina tube. The channels were<br />
closed and the Pt wires fixed by applying glass paste on each end <strong>of</strong> the alumina tube and heat to<br />
1000 °C. Pt paste (Ferro) was applied on the electrodes for current collection and as “glue” for<br />
fixing the cell to the Pt wires. The one electrode was fully covered by the current collector, on the<br />
other a small 1 mm x 1 mm square was left free in the middle for collection <strong>of</strong> the XRD<br />
fluorescence signal from the electrode surface. A close-up <strong>of</strong> the cell mounted on the alumina<br />
tube is shown in Figure 87.<br />
Figure 87. Symmetric cell mounted for in situ XANES measurement.<br />
11.3.3 Heating and temperature determination<br />
Heating <strong>of</strong> the sample was achieved by use <strong>of</strong> a halogen lamp, as using a lamp made it possible to<br />
heat the sample directly without the need for a furnace. In the focal point <strong>of</strong> the halogen lamp a<br />
black body will be heated to 1300 °C when the maximum voltage 15 V is applied on the lamp.<br />
Initial experiments showed that placing the sample directly in the focal point caused too<br />
vigorously heating <strong>of</strong> the sample, for this reason the sample was displaced ≈ 6 mm away from the<br />
focal point.<br />
The exact temperature <strong>of</strong> the sample was determined by combining impedance spectra recorded<br />
during the in situ XANES test with knowledge on the temperature dependence <strong>of</strong> the cells serial<br />
resistance. Prior to the in situ XANES tests impedance spectra were recorded on symmetric cells in<br />
a conventional furnace set-up in the temperature range 300-500 °C. From these spectra the serial<br />
resistance was determined and an Arrhenius plot made, see Figure 88.<br />
176
11 Construction <strong>of</strong> an in situ XANES test house<br />
Figure 88. Arrhenius plot <strong>of</strong> serial resistance<br />
As observed in Figure 88 good linearity was obtained on the Arrhenius plots (R 2 ≥0.998). For this<br />
reason sample temperature during the in situ XANES measurements could be determined from the<br />
Arrhenius expression stated in eq. 11.1, which is calculated from the results shown in Figure 88.<br />
⎛ 1 ⎞<br />
ln<br />
⎜ = 7.<br />
6<br />
R ⎟<br />
⎝ 0 ⎠<br />
−<br />
177<br />
1000<br />
0.<br />
79<br />
T<br />
The activation energy determined for the serial resistance was 0.57±0.002 eV, which is below the<br />
activation energy 0.7 eV for the ionic conduction in CGO10 154 . As the ionic conduction in CGO10 is<br />
expected to be the main contributor to the serial resistance, similar activation energies were<br />
expected, the reason for the discrepancy is unknown.<br />
11.3.4 EIS and polarisation experiments<br />
Before and after polarisation <strong>of</strong> the cells impedance spectra were recorded. This was done in<br />
order determine the temperature <strong>of</strong> the sample, as explained in the previous section, and to<br />
monitor if the cells were stable or changed during the experiment due to heating, polarisation etc.<br />
Moreover impedance spectra recorded in the in situ XANES set-up made it possible to compare to<br />
impedance spectra recorded in the conventional furnace set-up, to estimate the reproducibility<br />
between the two set-ups. A Gamry reference 600 potentisat was used for the impedance<br />
measurements which were made in the frequency range 1 MHz-0.1 Hz with 36 mV rms amplitude<br />
and 6 points recorded pr. decade. The Gamry potentiostat was also used for the polarisation<br />
experiments, during which the cells were polarised corresponding to 100 mV, 300 mV and 500 mV<br />
polarisation across each <strong>of</strong> the electrodes for ≈ 1 h.<br />
11.1
11.3.5 XANES measurements<br />
11 Construction <strong>of</strong> an in situ XANES test house<br />
The in situ XANES measurements were carried out at Hamburger Synchrotonstrahlungslabor<br />
(Hasylab), DESY (Deutsches Elektronen-Synchroton) in Hamburg. The measurements were made at<br />
beamline A1 and two Si 111 crystal pairs were used as monochromaters for the X-ray beam. The K<br />
absorption edge <strong>of</strong> Mn metal is located at 6539 eV while for Mn 3+ the K absorption edge is located<br />
at 6551 eV 183 . In order to cover the energy range around the absorption edge the XANES spectra<br />
were for this reason recorded in the energy interval 6490-6590 eV. The step size during the<br />
measurements was 0.5 eV at 6490-6534 eV and 6560-6590 eV, while in the energy range closest to<br />
the absorption edge, 6534-6560 eV, a stepsize <strong>of</strong> 0.1 eV was used.<br />
The fluorescence signal from the electrode was detected by a Passivated Implanted Planar Silicon<br />
(PIPS) detector, which in principle is a photodiode with a large area. The current signal from the<br />
PIPS detector was measured by a Keithley 428 current amplifier. As the PIPS detector is sensitive<br />
both to heat and visible light, the detector was during the measurements shielded by two Mylar<br />
foils. A top-view schematic <strong>of</strong> the measurement set-up is shown in Figure 89.<br />
Figure 89. Top-view schematic <strong>of</strong> the in situ XANES test house including incoming X-rays and<br />
emitted fluorescence signal.<br />
During the measurement the flow through the test house was 20 ml/min 21% O2 in He and the<br />
oxygen content in the outlet flow was constantly monitored by an oxygen sensor. The<br />
temperature <strong>of</strong> the sample during the measurements was 300-350 °C.<br />
178
11.4 Results<br />
11.4.1 Impedance measurements<br />
11 Construction <strong>of</strong> an in situ XANES test house<br />
Impedance spectra recorded on a symmetric LSM15-CGO10 cell mounted in the in situ XANES test<br />
house is shown in Figure 90, and for comparison Figure 91 shows an impedance spectrum<br />
recorded on a similar cell mounted in a conventional furnace set-up. Clearly there is a significant<br />
difference between the impedance spectra recorded in the two set-ups, as the difference in<br />
polarisation resistance is more than an order <strong>of</strong> magnitude. An order <strong>of</strong> magnitude is unlikely to be<br />
due to the difference in gascomposition (10% O2 in Ar vs. 21% O2 in He) and the reason for the<br />
dissimilarity is then likely the difference in sample mounting and eventually heating. With respect<br />
to the conventional furnace set-up the 4 cells mounted in this set-up in general showed good<br />
reproducibility, as the variation in Rp was 12% at 350 °C in 10% O2. As only one test was made in<br />
the in situ test house it is hard to estimate a cause for the different impedance response, and<br />
further experiments are needed to clarify why the impedance spectra are so different. However<br />
the results show, that it is possible to characterize a cell mounted in the in situ test house by<br />
impedance spectroscopy.<br />
-Z'' [Ωcm 2 ]<br />
200<br />
150<br />
100<br />
50<br />
0<br />
20 Hz<br />
2 Hz<br />
0 100 200 300 400 500<br />
Z' [Ωcm 2 ]<br />
179<br />
0.2 Hz<br />
Figure 90. Impedance spectra recorded on a symmetric LSM15-CGO10 cell mounted in the in situ<br />
XANES test house. The gascomposition was 21% O2 in He and the sample temperature 356 °C.
11 Construction <strong>of</strong> an in situ XANES test house<br />
-Z'' [Ωcm 2 ]<br />
6000<br />
4000<br />
2000<br />
0<br />
20 mHz<br />
0 4000 8000 12000<br />
Z' [Ωcm 2 ]<br />
180<br />
2 mHz<br />
0.2 mHz<br />
Figure 91. Impedance spectra recorded on symmetric LSM15-CGO10 cell mounted in a<br />
conventional furnace set-up. The gas composition was 10% O2 in Ar and the temperature 350 °C.<br />
The impedance spectra recorded in the in situ XANES set-up showed a continuously increase in the<br />
polarisation resistance during time as shown in Figure 92. The increase in polarisation resistance<br />
was unaffected by the polarisation as the (a) spectra in Figure 92 were recorded before -500 mV<br />
polarisation pr. electrode, while the (b) spectra were recorded after the polarisation. The<br />
instability in the polarisation resistance only occurred in the low frequency region, whereas the<br />
high frequency region and Rs remained entirely stable during the test. Furthermore the impedance<br />
spectra in Figure 92 show, that polarisation <strong>of</strong> the cell in the in situ XANES test house did not have<br />
a detrimental effect on the cell or the mounting/attachment <strong>of</strong> the cell, as both Rs and Rp<br />
remained unaffected by the polarisation.<br />
Figure 92. Impedance spectra recorded before (marked by (a)) and after (marked by (b)) 500 mV<br />
polarisation <strong>of</strong> the sample mounted in the in situ XANES test house.
11.4.2 XANES<br />
11 Construction <strong>of</strong> an in situ XANES test house<br />
XANES spectra were recorded while the electrode was polarised at 100, 300 and 500 mV; and<br />
before and after each <strong>of</strong> the polarisation experiments. At each experimental condition 3-4 spectra<br />
were recorded, and from these spectra the position <strong>of</strong> the absorption edge was determined, see<br />
Table 33 for the absorption edge position and Figure 93 for two representative XANES spectra. As<br />
observed in Table 33 and Figure 93 polarisation did not affect the position <strong>of</strong> the absorption edge,<br />
which means no change in Mn oxidation state could be detected during the polarisation. As<br />
explained in the theory section a change in Mn oxidation state was expected, why this change was<br />
not observed will be discussed in section 11.5.1.<br />
Table 33. Edge energies <strong>of</strong> the Mn K absorption edge on the electrode wile unpolarised and during<br />
polarisation.<br />
Temperature Electrode polarisation Mn XANES edge [eV]<br />
356 °C Unpolarised 6553.6(1)<br />
100 mV 6553.7(3)<br />
300 mV 6553.7(1)<br />
500 mV 6553.6(3)<br />
300 °C Unpolarised 6553.6(1)<br />
500 mV 6553.4(2)<br />
Signal intensity<br />
2.4<br />
2.2<br />
2.0<br />
1.8<br />
1.6<br />
1.4<br />
Unpolarised<br />
500 mV polarisation<br />
1.2<br />
6530 6540 6550 6560 6570<br />
Energy [eV]<br />
Figure 93. XANES spectra <strong>of</strong> the Mn absorption edge in the unpolarised electrode and during 500<br />
mV polarisation <strong>of</strong> the electrode at 300 °C.<br />
181
11.5 Discussion<br />
11.5.1 Polarisation effect and reproducibility<br />
11 Construction <strong>of</strong> an in situ XANES test house<br />
As described in the results section, the in situ XANES test house made it possible to do X-ray<br />
absorption spectroscopy on solid oxide electrodes under true in situ conditions, i.e. in controlled<br />
atmosphere, at elevated temperature and under polarisation. Furthermore impedance<br />
spectroscopy could be used during the measurement to monitor the state <strong>of</strong> the solid oxide cell<br />
and to determine the sample temperature. The construction <strong>of</strong> the in situ XANES test house was<br />
for this reason to a large extent successful; however the first test on porous LSM15-CGO10<br />
electrodes raised two major questions regarding the results: 1) Why was a change in the<br />
manganese oxidation state not observed during the polarisation? 2) Why was the impedance<br />
spectra recorded on a cell in the in situ XANES test house much different from spectra recorded in<br />
a conventional furnace set-up?<br />
Regarding question 1) the explanation is likely, that with the 10 μm thick porous electrode at 300-<br />
350 °C the change in the Mn oxidation state is happening in the depth <strong>of</strong> the electrode near the<br />
electrolyte, as explained in the theory section, and not in the bulk Mn in the electrode. This means<br />
that only a small proportion <strong>of</strong> Mn in the electrode will have changed oxidation state during<br />
polarisation, and this proportion has apparently been too small to give any detectable changes on<br />
the XANES spectra. Repeating the experiment with thinner electrodes would therefore increase<br />
the change <strong>of</strong> detecting a change in the Mn oxidation state, as in thinner electrodes a larger<br />
proportion <strong>of</strong> Mn will change oxidation state during polarisation. Preferably LSM thin film<br />
electrodes should be employed, as these electrodes can be fabricated in 200-300 nm thickness.<br />
Regarding question 2) about the cause <strong>of</strong> the difference in impedance spectra between the in situ<br />
XANES set-up and the conventional set-up, the answer to this may be found when more tests have<br />
been performed in the in situ XANES set-up. Preferably tests should be performed where<br />
application <strong>of</strong> the current collector is varied (electrodes fully covered by the current collector vs.<br />
with a current collector free hole in the middle), where gas composition and flow rate is varied to<br />
allow for identification <strong>of</strong> the processes contributing to the polarisation resistance and eventually<br />
where the position <strong>of</strong> the cell relative to the halogen lamp is varied. The latter is <strong>of</strong> interest since<br />
182
11 Construction <strong>of</strong> an in situ XANES test house<br />
the tilting <strong>of</strong> sample relative to the halogen lamp (see Figure 89) may cause an uneven heat<br />
distribution in the cell. This is discussed further in the next section.<br />
11.5.2 Improvements <strong>of</strong> the in situ XANES tests and test house<br />
The in situ XANES test house was a first model, and even though it proved very functional, further<br />
improvements can still be made. A major concern during the measurement was the heat<br />
distribution in the cell. As shown in Figure 89 the sample had to be tilted relative to the front <strong>of</strong><br />
the halogen lamp, for the sake <strong>of</strong> the incoming X-ray beam and the detection <strong>of</strong> the fluorescence<br />
signal. However as the heating from the halogen lamp is dependent on the distance to the lamp,<br />
the tilting <strong>of</strong> the sample meant the cell edge furthest away from the halogen lamp would<br />
experience a heat effect only 25% <strong>of</strong> the effect closest to the halogen lamp. The implication <strong>of</strong> this<br />
is the cell in the in situ set-up experiences a constant thermal gradient from the one cell edge to<br />
the other, which could explain why one <strong>of</strong> the mounted cells suddenly cracked through the<br />
middle. In order to circumvent this problem a second model <strong>of</strong> the in situ XANES test house should<br />
be made with the halogen lamp mounted with the lamp edge parallel to the cell, or alternatives to<br />
heating the cell with an halogen lamp should be found.<br />
With respect to the heating <strong>of</strong> the cell another concern was, if the temperature <strong>of</strong> the electrode<br />
pointing away from the halogen lamp was exactly the same as the temperature determined from<br />
the serial resistance, as this electrode may be cooler since it only was heated by heat transfer<br />
trough the cell and not directly by the halogen lamp. A way to check this would be to mount a<br />
thermocouple through the alumina tube sample holder and let this thermocouple measure the<br />
temperature <strong>of</strong> the electrode.<br />
Regarding the next in situ XANES measurements the gas tightness <strong>of</strong> the test house should be<br />
checked, and if tight enough XANES measurements should be made with variation in pO2 from 1<br />
atm to 0.001 atm. The variation in Mn oxidation state caused by the change in oxygen partial<br />
pressure and the corresponding change in oxygen vacancies could then be correlated with the<br />
change in Mn oxidation state caused by the polarisation and the corresponding change in oxygen<br />
vacancies.<br />
183
11 Construction <strong>of</strong> an in situ XANES test house<br />
Finally, the constructed in situ XANES test house is not limited to XANES measurements only, but<br />
could also be used for in situ EXAFS measurement, thereby yielding an even deeper understanding<br />
<strong>of</strong> changes occurring in the electrodes during polarisation.<br />
11.6 Conclusion<br />
An in situ XANES test house was designed and it was proven the test house could be used for<br />
XANES measurements on solid oxide electrodes in controlled atmosphere, at elevated<br />
temperatures and under polarisation, i.e. under true in situ conditions. The initial experiments on<br />
porous LSM15-CGO10 electrodes did not show the expected change in Mn oxidation state during<br />
polarisation, likely due to the thickness <strong>of</strong> the sample. Furthermore the impedance spectra<br />
recorded on cells in the in situ test house were quite different from impedance spectra recorded<br />
at similar conditions in a conventional set-up; further experiments are needed in order to clarify<br />
the reason for this difference.<br />
184
12 Overall Discussion, Conclusion and Outlook<br />
12 Overall Discussion, Conclusion and Outlook<br />
In the preceding chapters several different experiments have been described, which have aimed at<br />
clarifying whether impregnation with <strong>NOx</strong> storage compounds increases the <strong>NOx</strong>-conversion<br />
during electrochemical de<strong>NOx</strong> on solid oxide electrodes. In this chapter the findings from the<br />
different experiments will be discussed in relation to each other before the overall conclusions<br />
from the project are drawn and put into perspective.<br />
12.1 Discussion<br />
12.1.1 The optimal electrode composition and <strong>NOx</strong> storage compound<br />
The main focus in this project was on LSM15-CGO10 and LSF15-CGO10 electrodes in combination<br />
with the <strong>NOx</strong>-storage compounds K2O and BaO. The chapters 6 to 9 describe a series <strong>of</strong><br />
experiments made in a porous cell stack test set-up with the four different possible combinations<br />
<strong>of</strong> LSM15-CGO10 and LSF15-CGO10 electrodes with K2O or BaO impregnations. From the point <strong>of</strong><br />
view <strong>of</strong> developing the electrochemical de<strong>NOx</strong> technology into a commercial state, the most<br />
promising finding in the aforementioned chapters was the observation <strong>of</strong> a significant <strong>NOx</strong><br />
conversion in the presence <strong>of</strong> 10% O2 on LSM15-CGO10 electrodes with BaO impregnation. This<br />
raises the question whether LSM15-CGO10 with BaO impregnation is the best combination <strong>of</strong><br />
materials <strong>of</strong> the four aforementioned for electrochemical de<strong>NOx</strong>? Definitely K2O impregnation can<br />
be ruled out as method for improving the <strong>NOx</strong> conversion on solid oxide electrodes, as K2O<br />
impregnation on both LSM15-CGO10 and LSF15-CGO10 electrodes lead to severe degradation<br />
problems, visible as an entire deterioration <strong>of</strong> the electrode microstructure. The reason for this<br />
deterioration is likely the corrosiveness <strong>of</strong> molten KNO3, as it is stated by Bloom that molten<br />
nitrates may dissolute oxides 184 , however in addition to this the degradation does also seem to<br />
depend on polarisation as explained in chapter 9. The combination <strong>of</strong> LSF15-CGO10 with BaO did<br />
increase the <strong>NOx</strong> conversion without presence <strong>of</strong> O2, but no conversion <strong>of</strong> <strong>NOx</strong> was observed in the<br />
presence <strong>of</strong> 10% O2. A reason for this could be the LSF15-CGO10 cell stacks with BaO impregnation<br />
never was polarized at more than 3V, while on the BaO impregnated LSM15-CGO10 cell stack, the<br />
<strong>NOx</strong> conversion in presence <strong>of</strong> O2 was only observed at polarisation larger than 3V. For this reason<br />
experiments with LSF15-CGO10 porous cell stacks and BaO impregnation should be repeated at<br />
higher polarisation.<br />
185
12.1.2 Phase formation during testing<br />
12 Overall Discussion, Conclusion and Outlook<br />
Neither the LSM15-CGO10 nor the LSF15-CGO10 electrodes with BaO showed severe sign <strong>of</strong><br />
degradation during testing, when the serial resistance and the polarisation resistance at the<br />
beginning and the end <strong>of</strong> each test was compared. Consistently all the tests on the BaO<br />
impregnated stacks ended with both the serial and the polarisation resistance being lower when<br />
compared to the corresponding non-impregnated tests. A common characteristics for the BaO<br />
impregnated tests was pr<strong>of</strong>ound changes in the electrode microstructure at the end <strong>of</strong> the tests,<br />
as the SEM images after test revealed electrode surfaces covered with either an “explosion” <strong>of</strong><br />
nanoparticles, “fluffy” structures or flake like particles. The dramatic change in microstructure<br />
could be a sign <strong>of</strong> formation <strong>of</strong> new phases, even though previous studies as described in chapter<br />
8 did not indicate new phase formation would occur. The tested electrodes with BaO<br />
impregnation should for this reason be investigated for the formation <strong>of</strong> new phases. The most<br />
suitable technique for this is likely Transmission Electron Microscopy (TEM), as TEM would allow<br />
for both elemental analysis and crystal structure determination in the nanometer range at the<br />
surface <strong>of</strong> the electrode grains.<br />
12.1.3 Effect <strong>of</strong> impregnation<br />
All the impregnations (MnOx, K2O, BaO) caused an activation/decrease in polarisation resistance <strong>of</strong><br />
the electrodes, at least until the undesirable degradation for the MnOx and K2O impregnated<br />
sample started to influence the experiments. An important observation with respect to the<br />
activation caused by the impregnation was it was not only observed in <strong>NOx</strong>-containing<br />
atmospheres, but also in atmospheres with only 10% O2. This shows that the impregnations did<br />
not only affect the <strong>NOx</strong> adsorption on the electrode, but the impregnations also caused a general<br />
activation. The question is why this activation occurred? A common explanation is impregnations<br />
due to the high surface area <strong>of</strong> the impregnated nanoparticles increases the TPB in the electrode<br />
and thereby causes an activation 147, 185 . This explanation makes most sense, when the impregnated<br />
compound is either electronic or ionic conductive, as the TPB is defined as the active reaction zone<br />
around the border between gas phase, the ion-conducting phase and the electronic conductive<br />
phase. However the findings from literature on conductivities <strong>of</strong> the <strong>NOx</strong> storage compounds,<br />
stated in chapter 2, does indicate the conductivity <strong>of</strong> the compounds is at the best very limited,<br />
and thus questions whether an extension <strong>of</strong> the TPB is the right explanation <strong>of</strong> the activation<br />
186
12 Overall Discussion, Conclusion and Outlook<br />
caused by the MnOx, K2O, or BaO impregnation. Another possible explanation could be the<br />
impregnated compounds act as impurity scavengers, which previously has been suggested as an<br />
explanation <strong>of</strong> why impregnation with non-conductive CeO2 increased the performance <strong>of</strong> solid<br />
oxide electrodes 186 .<br />
In addition to the effect <strong>of</strong> impregnation on the general electrode activity, the effect on the <strong>NOx</strong><br />
adsorption and conversion should also be considered. For the K2O impregnations the conversion<br />
measurements in 1000 ppm NO + 10% O2 on a porous cell stacks showed a change in the<br />
conversion between NO and NO2 on both the LSF15-CGO10 and the LSM15-CGO10 electrodes. The<br />
change in <strong>NOx</strong> conversion indicate the <strong>NOx</strong>-conversion reaction on the electrode is affected by the<br />
presence <strong>of</strong> K2O, which also supported by the impedance results, the cyclic voltammetry on the<br />
symmetric cells and the results from the DRIFT spectroscopy. With respect to the BaO<br />
impregnation the impedance analysis on the non-impregnated and BaO-impregnated LSM15-<br />
CGO10 cell stacks show the BaO impregnation affects the <strong>NOx</strong>-adsorption, which was also<br />
indicated by the results from the DRIFT spectroscopy.<br />
12.1.4 <strong>NOx</strong> adsorption studied by DRIFT spectroscopy<br />
DRIFT spectroscopy was performed on the <strong>NOx</strong> adsorption on non-impregnated and K2O or BaO<br />
impregnated CGO10. The DRIFT spectroscopy revealed a significant change in the adsorbed <strong>NOx</strong><br />
species in the investigated temperature range 300 °C-500 °C, from a variety <strong>of</strong> adsorbed <strong>NOx</strong>-<br />
species at 300 °C to predominantly adsorbed NO3 - species at 500 °C. Furthermore the DRIFT<br />
spectroscopy revealed a very significant difference in the adsorbed <strong>NOx</strong> species depending on<br />
whether only NO was present in the atmosphere or NO2/NO+O2 was present in the atmosphere.<br />
This last finding implies the reaction mechanism in atmospheres only with NO likely is different<br />
from the reaction mechanism in NO2/NO+O2, due to the difference in adsorbed species. For this<br />
reason results obtained in only NO containing atmospheres are likely only to a very limited extent<br />
valid in NO and O2 containing atmosphere, which is a more realistic atmosphere for<br />
electrochemical de<strong>NOx</strong>, considering diesel exhaust contain up to 15% O2 7 . With respect to the<br />
finding that NO3 - was predominant adsorbed <strong>NOx</strong> specie, this finding was used in the<br />
interpretation <strong>of</strong> the results from the impedance measurement, and thus illustrates the strength<br />
<strong>of</strong> combining impedance measurements with other techniques. An even larger advantage would<br />
be gained, if electrochemical characterization was combined with surface spectroscopic<br />
187
12 Overall Discussion, Conclusion and Outlook<br />
techniques like FTIR at in-situ conditions as done by MacLeod et al. 42 . The work on developing an<br />
in situ test house for XANES spectroscopy showed that doing in situ measurements on solid oxide<br />
electrodes is not a trivial task, but possibly the experiences gained from developing the in situ<br />
XANES testhouse may also be used in the development <strong>of</strong> a set-up for in situ FTIR measurements<br />
on solid oxide electrodes.<br />
12.1.5 Comparison between test set-ups<br />
In this project three different test set-ups were used for the electrochemical testing: the<br />
symmetric cell test-set-up, the porous stack test set-up and the 3EP test set-up. When the results<br />
from the different test set-ups were compared, some differences were observed between the set-<br />
ups, for instance an NO2 conversion arc was only observed in impedance spectra recorded on the<br />
symmetric cell test set-up, and a significant difference was observed in the conversion obtained on<br />
the porous cell stack set-up and the 3EP set-up. This illustrates, that the processes responsible for<br />
the polarisation losses are strongly dependent on the flow conditions around the electrodes.<br />
Therefore the design <strong>of</strong> the electrochemical de<strong>NOx</strong> filter to be used in real life diesel exhaust is<br />
very important for the development <strong>of</strong> the electrochemical de<strong>NOx</strong> technology, and the filter<br />
should be designed in a way which minimizes undesirable polarisation losses due to poor gas flow<br />
distribution.<br />
12.1.6 Commercialization<br />
As previously stated the future goal is to develop the electrochemical de<strong>NOx</strong> technology into a<br />
stage where it is useful for cleaning <strong>of</strong> real diesel engine exhaust. In that perspective it is <strong>of</strong><br />
interest to consider, how far the results achieved on the porous cell stacks are from the<br />
requirements for an operable de<strong>NOx</strong> technology. Transferring the results from the porous cell<br />
stacks to real engine exhaust must however be taken with a grain <strong>of</strong> salt, among other reasons as<br />
<strong>NOx</strong> conversion is much dependent on the flow rate and flow distribution across the electrodes, as<br />
illustrated when comparing the results from the porous cell stacks with the measurements on the<br />
3EPs. However with this in mind the results achieved on the porous LSM15-CGO10 cell stack with<br />
BaO impregnation will be compared to realistic de<strong>NOx</strong> requirements. First <strong>of</strong> all it will be assumed<br />
the electrochemical de<strong>NOx</strong> filter is operating at 400 °C with a 10% current efficiency in an exhaust<br />
gas containing 1000 ppm NO and 10% O2, i.e. at conditions corresponding to the experiments<br />
described in chapter 8. According to Bosch the requirements for de<strong>NOx</strong> technology should be a<br />
188
12 Overall Discussion, Conclusion and Outlook<br />
mean power consumption measured during the New European Driving Cycle 65% 187 . For a 1.4L<br />
diesel engine driving 130 km/h at the highway the exhaust gas flow will be ≈400 m 3 /h assuming an<br />
exhaust temperature <strong>of</strong> 400 °C iii . In the experiments performed on the BaO impregnated LSM15-<br />
CGO10, the <strong>NOx</strong> conversion was ≈60%, and assuming 60% conversion <strong>of</strong> the <strong>NOx</strong> is enough, a total<br />
porous cell stack area <strong>of</strong> 30 m 2 would be necessary to clean the exhaust from the 1.4 L engine,<br />
leading to a total power supply <strong>of</strong> 70000 W. Obviously 30 m 2 cells stacks and 70000 W power<br />
consumption is much too large compared to the Bosch requirements for a De<strong>NOx</strong> technology. This<br />
illustrates the need for a continued improvement <strong>of</strong> the electrochemical de<strong>NOx</strong> electrodes, but<br />
also for the development <strong>of</strong> an electrochemical filter for testing in real exhaust, to give a more<br />
realistic evaluation <strong>of</strong> the performance <strong>of</strong> electrochemical de<strong>NOx</strong>, compared to just up-scaling<br />
results from porous cell stacks.<br />
iii The specification <strong>of</strong> this 1.4. diesel engine corresponds the specifications <strong>of</strong> the engine in a Citroen C2, a<br />
small personal car. Such a diesel engine is used for realistic diesel engine tests at <strong>DTU</strong> MEK.<br />
189
12.2 Conclusion<br />
12 Overall Discussion, Conclusion and Outlook<br />
To the best <strong>of</strong> the author’s knowledge, the present project for the first time shows<br />
electrochemical <strong>reduction</strong> <strong>of</strong> <strong>NOx</strong> in the presence <strong>of</strong> 10% O2 on all ceramic electrodes. The <strong>NOx</strong><br />
conversion in presence <strong>of</strong> 10% O2 was measured on a LSM15-CGO10 porous cell stack<br />
impregnated with BaO as <strong>NOx</strong> storage compound. At 400 °C 60% <strong>NOx</strong> conversion was achieved<br />
with current efficiency 10%, the conversion was observed to increase with increasing temperature<br />
and polarisation. Through impedance analysis and DRIFT spectroscopy it was shown, that BaO<br />
impregnation affected the reactions on the LSM15-CGO10 electrodes by causing a general<br />
electrode activation, and also by acting as an adsorbent for <strong>NOx</strong> adsorption and storage on the<br />
LSM15-CGO10 electrodes. However it was not possible to identify, which <strong>of</strong> the two<br />
aforementioned effects was mainly responsible for the increased <strong>NOx</strong> conversion observed on the<br />
BaO impregnated cell stacks. As no <strong>NOx</strong> conversion at all was observed on non-impregnated<br />
LSM15-CGO10 cell stacks, neither in the presence <strong>of</strong> 10% O2 nor when only NO was present, the<br />
results seem to confirm addition <strong>of</strong> <strong>NOx</strong> storage compounds can increase the conversion during<br />
electrochemical de<strong>NOx</strong>. However, the results also showed significant differences depending on<br />
which <strong>NOx</strong> storage compounds and solid oxide electrode materials were combined. Even though<br />
addition <strong>of</strong> K2O as <strong>NOx</strong> storage compound increased the NO conversion in the absence <strong>of</strong> oxygen<br />
on both LSM15-CGO10 and LSF15-CGO10 electrodes, the K2O impregnation caused major<br />
degradation issues in the electrodes, and must for this reason be considered unsuitable as a <strong>NOx</strong><br />
storage compound in solid oxide electrodes. Similarly significant degradation problems were<br />
observed, when MnOx was impregnated on LSM5-CGO10 electrodes as a <strong>NOx</strong> storage compound.<br />
The degradation problems on the K2O and MnOx impregnated electrodes thus illustrates the<br />
compatibility between the solid oxides electrodes and <strong>NOx</strong> storage compounds must be carefully<br />
considered and studied, when the conversion during electrochemical de<strong>NOx</strong> is attempted<br />
improved by the addition <strong>of</strong> a <strong>NOx</strong> storage compound. So far the results achieved with increasing<br />
the <strong>NOx</strong> conversion on LSM15-CGO10 electrodes by BaO impregnation appear very promising, and<br />
definitely justify further studies on the LSM15-CGO10/BaO system just as well as investigations <strong>of</strong><br />
other combinations <strong>of</strong> solid oxide electrode and <strong>NOx</strong> storage compounds.<br />
190
12.3 Outlook<br />
12 Overall Discussion, Conclusion and Outlook<br />
As stated in the conclusion, the results achieved in this project encourage further studies on solid<br />
oxide electrodes in combination with <strong>NOx</strong> storage compounds. A general challenge in<br />
electrochemical de<strong>NOx</strong>, including this project, is to achieve a sufficiently high <strong>NOx</strong> conversion in<br />
the 200-300 °C temperature range <strong>of</strong> diesel exhaust, for this reason it is suggested to focus more<br />
on mixed electronic-ionic conducting electrodes as LSF in this work, and other materials currently<br />
under investigation for use in intermediate temperature solid oxide fuel cell, like for instance LSCF<br />
and LSC 62 . Furthermore other <strong>NOx</strong>-storage materials than K2O and BaO should be included in the<br />
investigation, for instance other alkaline (Na, Cs) and alkaline earth (Mg, Ca, Sr) oxides.<br />
With respect to further studies on the LSM15-CGO10/BaO system an important point is to clarify,<br />
whether any new phases were formed in the electrodes during testing. As stated in the overall<br />
discussion, the most suitable technique for that investigation would be TEM. A deeper theoretical<br />
understanding <strong>of</strong> why the <strong>NOx</strong> conversion in the presence <strong>of</strong> 10% O2 only is observed on the BaO<br />
impregnated cell stack at temperatures ≥350 °C and polarisations >3V is also desirable.<br />
Furthermore more focus should be on recording and interpretation <strong>of</strong> impedance spectra during<br />
current load. The majority <strong>of</strong> the impedance spectra in this work were recorded at OCV, and in<br />
general the OCV results appear to correlate well with conversions measurements, as low<br />
polarisation resistance at OCV usually is correlated with high <strong>NOx</strong>-conversion. However, only using<br />
the OCV spectra for evaluation <strong>of</strong> the electrode processes increases the risk <strong>of</strong> overemphasizing<br />
the importance <strong>of</strong> one or more processes, since the impedance spectra recorded under current<br />
load in general differ from spectra recorded at OCV.<br />
With the identification <strong>of</strong> BaO impregnated LSM15-CGO10 electrodes as being capable <strong>of</strong><br />
converting <strong>NOx</strong> in the presence <strong>of</strong> 10% O2 the development <strong>of</strong> electrodes for electrochemical<br />
de<strong>NOx</strong> has been put one step forward, but much more work is needed before commercialization<br />
<strong>of</strong> the technology becomes possible. This work should firstly focus on stability and durability tests<br />
<strong>of</strong> impregnated electrodes, aimed at clarifying at which temperatures and voltages the electrodes<br />
can be considered stable. Furthermore it should be investigated how other components in diesel<br />
engine exhaust, like unburned hydrocarbons, H2O, CO2, CO, SO2; affects the electrode<br />
191
12 Overall Discussion, Conclusion and Outlook<br />
performance and stability, and the influence <strong>of</strong> combining <strong>NOx</strong> <strong>reduction</strong> and hydrocarbon<br />
oxidation in the same electrochemical cell should be investigated.<br />
At the end the final goal is the development <strong>of</strong> a one component electrocatalytic filter, which<br />
during polarisation is capable <strong>of</strong> both reducing the <strong>NOx</strong> and oxidizing the unburned hydrocarbons<br />
from diesel engine exhaust. The findings in this project contributes to the development <strong>of</strong> this<br />
technology, however much more research with respect to electrode testing and improvement is<br />
needed, not to mention research on the actual design and real life testing <strong>of</strong> the filter, before the<br />
technology becomes commercially competitive to other <strong>NOx</strong> removal technologies on the market.<br />
192
References<br />
References<br />
1 G. Rayner-Canham, Descriptive Inorganic Chemistry, Second Edition, W. H. Freeman and<br />
Company, New York, 2000.<br />
2 European Environment Agency, www.eea.europa.eu, (accessed 22/12, 2011).<br />
3 V. Vestreng, L. Ntziachristos, A. Semb, S. Reis, I. S. A. Isaksen and L. Tarrason, Atmos. Chem.<br />
Phys., 2009, 9, 1503-1520.<br />
4 K. K. Hansen, Appl. Catal. B, 2010, 100, 427-432.<br />
5 H. Bosch and F. Janssen, Catal. Today, 1988, 2, 369-379.<br />
6 J. B. Zeldovich, C. R. Acad. Sci. URSS, 1946, 51, 217-220.<br />
7 J. Kaspar, P. Fornasiero and N. Hickey, Catal. Today, 2003, 77, 419-449.<br />
8 F. Garin, Appl. Catal. A, 2001, 222, 183-219.<br />
9 R. G. Derwent and H. N. M. Stewart, Atmos. Environ., 1973, 7, 385-401.<br />
10 S. Grice, J. Stedman, A. Kent, M. Hobson, J. Norris, J. Abbott and S. Cooke, Atmos. Environ.,<br />
2009, 43, 2154-2167.<br />
11 K. Wark, C. F. Warner and W. T. Davis, Air Pollution its Origin and Control, Third Edition, Addison<br />
Wesley Longman, Inc., USA, 1998.<br />
12 Ecopoint Inc., www. dieselnet. com/standards/eu/hd.php, (accessed 21/6 2011).<br />
193
13 M. V. Twigg, Appl. Catal. B, 2007, 70, 2-15.<br />
References<br />
14 P. Granger and V. I. Parvulescu, Chem. Rev., 2011, 111, 3155-3207.<br />
15 Amminex A/S, www. amminex.net, (accessed 30/4 2012).<br />
16 Y. Zhao, J. Hu, L. Hua, S. Shuai and J. Wang, Ind. Eng. Chem. Res., 2011, 50, 11863-11871.<br />
17 Y. Traa, B. Burger and J. Weitkamp, Microporous Mesoporous Mater., 1999, 30, 3-41.<br />
18 R. Burch, J. P. Breen and F. C. Meunier, Appl. Catal. , B, 2002, 39, 283-303.<br />
19 N. Takahashi, H. Shinjoh, T. Iijima, T. Suzuki, K. Yamazaki, K. Yokota, H. Suzuki, N. Miyoshi, S.<br />
Matsumoto, T. Tanizawa, T. Tanaka, S. Tateishi and K. Kasahara, Catal. Today, 1996, 27, 63-<br />
69.<br />
20 S. Matsumoto, CATTECH, 2000, 4, 102-109.<br />
21 W. S. Epling, L. E. Campbell, A. Yezerets, N. W. Currier and J. E. Parks, Catal. Rev. Sci. Eng., 2004,<br />
46, 163-245.<br />
22 S. Pancharatnam, R. A. Huggins and D. M. Mason, J. Electrochem. Soc., 1975, 122, 869-875.<br />
23 T. Gür and R. Huggins, J. Electrochem. Soc., 1979, 126, 1067-1075.<br />
24 D. C. Cicero and L. A. Jarr, Sep. Sci. Technol., 1990, 25, 1455-1472.<br />
25 G. Reinhardt, H. -. Wiemhoefer and W. Goepel, Ionics, 1995, 1, 32-39.<br />
194
26 T. Hibino, Chem. Lett., 1994, 5, 927-930.<br />
References<br />
27 T. Hibino, K. Ushiki, Y. Kuwahara, M. Mizuno, A. Mazegi and H. Iwahara, J. Chem. Soc. Faraday<br />
Trans., 1995, 91, .<br />
28 T. Hibino, T. Inoue and M. Sano, Solid State Ionics, 2000, 130, 19-29.<br />
29 K. J. Walsh and P. S. Fedkiw, Solid State Ionics, 1997, 104, 97-108.<br />
30 K. J. Walsh and P. S. Fedkiw, Solid State Ionics, 1996, 93, 17-31.<br />
31 S. Bredikhin, K. Maeda and M. Awano, J. Electrochem. Soc., 2001, 148, D133-D138.<br />
32 S. Bredikhin, K. Maeda and M. Awano, Solid State Ionics, 2002, 152, 727-733.<br />
33 K. K. Hansen and E. M. Skou, Proc. Nordic Workshop on Mat. for Energy Conv., 2000, 73.<br />
34 K. K. Hansen, H. Christensen and E. M. Skou, Ionics, 2000, 6, 340.<br />
35 K. K. Hansen, E. M. Skou and H. Christensen, J. Electrochem. Soc., 2000, 147, 2007-2012.<br />
36 R. M. L. Werchmeister, K. K. Hansen and M. Mogensen, J. Electrochem. Soc., 2010, 157, P35-<br />
P42.<br />
37 R. M. L. Werchmeister, K. Kammer Hansen and M. B. Mogensen, J. Solid State Electrochem.,<br />
2011, .<br />
38 R. M. L. Werchmeister, K. K. Hansen and M. Mogensen, J. Electrochem. Soc., 2010, 157, P107-<br />
P112.<br />
195
References<br />
39 R. M. L. Werchmeister, K. K. Hansen and M. Mogensen, Mater. Res. Bull., 2010, 45, 1554-1561.<br />
40 T. Kobayashi, K. Abe, Y. Ukyo and H. Iwahara, Solid State Ionics, 2002, 154–155, 699-705.<br />
41 X. Li and P. Vernoux, Appl. Catal. B, 2005, 61, 267-273.<br />
42 N. MacLeod, F. J. Williams, M. S. Tikhov and R. M. Lambert, Angewandte Chemie-International<br />
Edition, 2005, 44, 3730-3732.<br />
43 V. L. E. Simonsen, M. M. Johnsen and K. K. Hansen, Top. Catal., 2007, 45, 131-135.<br />
44 K. Hamamoto, Y. Fujishiro and M. Awano, J. Electrochem. Soc., 2008, 155, E109-E111.<br />
45 K. Hamamoto, T. Suzuki, Y. Fujishiro and M. Awano, J. Electrochem. Soc., 2011, 158, B1050-<br />
B1053.<br />
46 A. de Lucas-Consuegra, A. Caravaca, P. Sanchez, F. Dorado and J. L. Valverde, J. Catal., 2008,<br />
259, 54-65.<br />
47 A. de Lucas-Consuegra, A. Caravaca, F. Dorado and J. L. Valverde, Catal. Today, 2009, 146, 330-<br />
335.<br />
48 A. de Lucas-Consuegra, F. Dorado, C. Jimenez-Borja, A. Caravaca, P. Vernoux and J. L. Valverde,<br />
Catal. Today, 2009, 146, 293-298.<br />
49 Y. Yoshinobu , Y. Tsuda , H. Ueda , Y. Nakanishi and J. Gong , SAE Int. J. Fuels Lubr., 2010, 3, 50-<br />
60.<br />
196
50 S. P. Jiang, J. Mater. Sci., 2008, 43, 6799-6833.<br />
References<br />
51 H. Kamata, Y. Yonemura, J. Mizusaki, H. Tagawa, K. Naraya and T. Sasamoto, J. Phys. Chem.<br />
Solids, 1995, 56, 943-950.<br />
52 M. Kertesz, I. Riess, D. S. Tannhauser, R. Langpape and F. J. Rohr, J. Solid State Chem., 1982, 42,<br />
125-129.<br />
53 J. H. Kuo, H. U. Anderson and D. M. Sparlin, J. Solid State Chem., 1990, 87, 55-63.<br />
54 M. J. Jørgensen and M. Mogensen, J. Electrochem. Soc., 2001, 148, A433-A442.<br />
55 A. Hammouche, E. Siebert, A. Hammou, M. Kleitz and A. Caneiro, J. Electrochem. Soc., 1991,<br />
138, 1212-1216.<br />
56 J. H. Kuo, H. U. Anderson and D. M. Sparlin, J. Solid State Chem., 1989, 83, 52-60.<br />
57 Poulsen, F. W., Solid State Ionics, 2000, 129, 145-162.<br />
58 S. P. Jiang and J. G. Love, Solid State Ionics, 2003, 158, 45-53.<br />
59 M. Backhaus-Ricoult, K. Adib, T. St.Clair, B. Luerssen, L. Gregoratti and A. Barinov, Solid State<br />
Ionics, 2008, 179, 891-895.<br />
60 W. Wang and S. P. Jiang, J. Solid State Electrochem., 2004, 8, 914-922.<br />
61 C. Clausen, C. Bagger, J. B. Bilde-Sørensen and A. Horsewell, Solid State Ionics, 1994, 70-71, 59-<br />
64.<br />
197
References<br />
62 C. W. Sun, R. Hui and J. Roller, J. Solid State Electrochem., 2010, 14, 1125-1144.<br />
63 O. A. Marina, L. R. Pederson, M. C. Williams, G. W. C<strong>of</strong>fey, K. D. Meinhardt, C. D. Nguyen and E.<br />
C. Thomsen, J. Electrochem. Soc., 2007, 154, B452-B459.<br />
64 J. M. Ralph, C. Rossignol and R. Kumar, J. Electrochem. Soc., 2003, 150, A1518-A1522.<br />
65 S. P. Simner, J. R. Bonnett, N. L. Canfield, K. D. Meinhardt, J. P. Shelton, V. L. Sprenkle and J. W.<br />
Stevenson, J. Power Sources, 2003, 113, 1-10.<br />
66 M. V. Patrakeev, J. A. Bahteeva, E. B. Mitberg, I. A. Leonidov, V. L. Kozhevnikov and K. R.<br />
Poeppelmeier, J. Solids State Chem., 2003, 172, 219-231.<br />
67 K. Kammer Hansen, Mater. Res. Bull., 2010, 45, 1334-1337.<br />
68 B. Dalslet, P. Blennow, P. V. Hendriksen, N. Bonanos, D. Lybye and M. Mogensen, J. <strong>of</strong> Solid<br />
State Electrochem., 2006, 10, 547-561.<br />
69 F. Prinetto, G. Ghiotti, I. Nova, L. Lietti, E. Tronconi and P. Forzatti, J. Phys. Chem. B, 2001, 105,<br />
12732-12745.<br />
70 B. Westerberg and E. Fridell, J. Mol. Catal A: Chem., 2001, 165, 249-263.<br />
71 Y. Ji, T. J. Toops, J. A. Pihl and M. Crocker, Appl. Catal. , B, 2009, 91, 329-338.<br />
72 T. Lesage, J. Saussey, S. Malo, M. Hervieu, C. Hedouin, G. Blanchard and M. Daturi, Appl. Catal.<br />
B, 2007, 72, 166-177.<br />
198
References<br />
73 T. J. Toops, D. B. Smith, W. S. Epling, J. E. Parks and W. P. Partridge, Appl. Catal. , B, 2005, 58,<br />
255-264.<br />
74 I. Chorkendorff and J. M. Niemantsverdriet , Concepts <strong>of</strong> Modern Catalysis and Kinetics, Wiley-<br />
VCH GmbH & Co. KGaA, Weinheim, 2003.<br />
75 Y. Teraoka, K. Kanada and S. Kagawa, Appl. Catal. B, 2001, 34, 73-78.<br />
76 W. F. Shangguan, Y. Teraoka and S. Kagawa, Appl. Catal. B, 1998, 16, 149-154.<br />
77 R. Fricke, E. Schreier, R. Eckelt, M. Richter and A. Trunschke, Top. Catal., 2004, 30-1, 193-198.<br />
78 J. M. Thomas and W. J. Thomas, Principles and Practice <strong>of</strong> Heterogenous Catalysis, VCH<br />
Verlagsgesellschaft mbH, Weinheim, 1997.<br />
79 A. J. McEvoy, Solid State Ionics, 2000, 135, 331-336.<br />
80 M. Baldi, V. Escribano, J. Amores, F. Milella and G. Busca, Appl. Catal. , B, 1998, 17, L175-L182.<br />
81 M. Baldi, E. Finocchio, F. Milella and G. Busca, Appl. Catal. , B, 1998, 16, 43-51.<br />
82 C. Lahousse, A. Bernier, P. Grange, B. Delmon, P. Papaefthimiou, T. Ioannides and X. Verykios, J.<br />
Catal., 1998, 178, 214-225.<br />
83 F. Pinna, Catal. Today, 1998, 41, 129-137.<br />
84 A. Lindholm, N. W. Currier, J. Dawody, A. Hidayat, J. Li, A. Yezerets and L. Olsson, Appl. Catal. ,<br />
B, 2009, 88, 240-248.<br />
199
References<br />
85 M. A. Peralta, B. S. Sánchez, M. A. Ulla and C. A. Querini, Appl. Catal. , A, 2011, 393, 184-188.<br />
86 M. Watanabe, H. Uchida, M. Shibata, N. Mochizuki and K. Amikura, J. Electrochem. Soc., 1994,<br />
141, 342-346.<br />
87 A. V. Virkar, K. Z. Fung and C. W. Tanner, U. S. Patent 5543239, 1996, .<br />
88 S. P. Jiang, Mater. Sci. Eng. A, 2006, 418, 199-210.<br />
89 J. M. Vohs and R. J. Gorte, Adv. Mater., 2009, 21, 943-956.<br />
90 N. Ai, S. P. Jiang, Z. Lue, K. Chen and W. Su, J. Electrochem. Soc., 2010, 157, B1033-B1039.<br />
91 C. Jin, J. Liu and J. Sui, J. Electroceram., 2011, 26, 74-77.<br />
92 M. Yang, M. Zhang, A. Yan, M. Yue, Z. Hou, Y. Dong and M. Cheng, J. Power Sources, 2008, 185,<br />
784-789.<br />
93 H. Zhao, D. Teng, X. Zhang, C. Zhang and X. Li, J. Power Sources, 2009, 186, 305-310.<br />
94 J. H. Kim, M. Cassidy, J. T. S. Irvine and J. Bae, J. Electrochem. Soc., 2009, 156, B682-B689.<br />
95 A. Rolle, N. Preux, G. Ehora, O. Mentre and S. Daviero-Minaud, Solid State Ionics, 2011, 184, 31-<br />
34.<br />
96 S. C. Kim and W. G. Shim, Appl. Catal. , B, 2010, 98, 180-185.<br />
97 W. M. Haynes and D. R. Lide, CRC Handbook <strong>of</strong> Chemistry and Physics, 91st Edition, Tayler and<br />
Francis Group, LCL, 2010-2011.<br />
200
References<br />
98 G. W. C<strong>of</strong>fey, J. Hardy, L. R. Pedersen, P. C. Rieke, E. C. Thomsen and M. Walpole, Solid State<br />
Ionics, 2003, 158, 1-9.<br />
99 S. R. Wang, T. Kobayashi, M. Dokiya and T. Hashimoto, J. Electrochem. Soc., 2000, 147, 3606-<br />
3609.<br />
100 G. J. Janz, U. Krebs, H. H. Siegenthaler and R. P. T. Tomkins, J. Phys. Chem. Ref. Data., 1972, 1, .<br />
101 O. Bjorseth, J. H. Fermor and A. Kjekshus, Acta Chem. Scand., 1971, 25, 3791-&.<br />
102 O. Ghodbane, J. Pascal and F. Favier, ACS Appl. Mater. Interfaces, 2009, 1, 1130-1139.<br />
103 M. Maneva and N. Petr<strong>of</strong>f, J. Therm. Anal., 1990, 36, 2511-2520.<br />
104 J. Winkler, P. V. Hendriksen, N. Bonanos and M. Mogensen, J. Electrochem. Soc., 1998, 145,<br />
1184-1192.<br />
105 T. Z. Sholklapper, C. Lu, C. P. Jacobson, S. J. Visco and L. C. De Jonghe, Electrochem. Solid-State<br />
Lett., 2006, 9, A376-A378.<br />
106 M. Lundberg, B. Skarman, F. Cesar and L. R. Wallenberg, Microporous Mesoporous Mater.,<br />
2002, 54, 97-103.<br />
107 D. Johnson, Scribner Associates 1990-2007, ZView2, 3.1 c, .<br />
108 K. Skalska, J. S. Miller and S. Ledakowicz, Sci. Total Environ., 2010, 408, 3976-3989.<br />
109 M. Stoukides, Catal. Rev. - Sci. Eng., 2000, 42, 1-70.<br />
201
References<br />
110 S. Bredikhin, K. Hamamoto, Y. Fujishiro and M. Awano, Ionics, 2009, 15, 285-299.<br />
111 K. K. Hansen, Appl. Catal. B, 2005, 58, 33-39.<br />
112 F. Braestrup and K. K. Hansen, J. Solid State Electrochem., 2009, 13, 1241-1250.<br />
113 M. L. Traulsen and K. K. Hansen, Accepted for Publication in J. <strong>of</strong> Solid State Electrochem. DOI<br />
10. 1007/s10008-012-1684-9, 2011, .<br />
114 A. Martinezarias, J. Soria, J. C. Conesa, X. L. Seoane, A. Arcoya and R. Cataluna, J. Chem. Soc. ,<br />
Faraday Trans., 1995, 91, 1679-1687.<br />
115 M. Niwa, Y. Furukawa and Y. Murakami, J. Colloid Interface Sci., 1982, 86, 260-265.<br />
116 S. Philipp, A. Drochner, J. Kunert, H. Vogel, J. Theis and E. Lox, Top. Catal., 2004, 30-31, 235-<br />
238.<br />
117 M. O. Symalla, A. Drochner, H. Vogel, S. Philipp, U. Gobel and W. Muller, Top. Catal., 2007, 42-<br />
43, 199-202.<br />
118 S. Hodjati, C. Petit, V. Pitchon and A. Kiennemann, Appl. Catal. , B, 2000, 27, 117-126.<br />
119 Y. Chi and S. Chuang, J. Phys. Chem. B, 2000, 104, 4673-4683.<br />
120 V. G. Milt, C. A. Querini, E. E. Miró and M. A. Ulla, J. Catal., 2003, 220, 424-432.<br />
121 V. G. Milt, M. A. Ulla and E. E. Miró, Appl. Catal. , B, 2005, 57, 13-21.<br />
122 Y. Zhu, D. Wang, F. Yuan, G. Zhang and H. Fu, Appl. Catal. , B, 2008, 82, 255-263.<br />
202
References<br />
123 A. Laachir, V. Perrichon, A. Badri, J. Lamotte, E. Catherine, J. Lavalley, J. Elfallah, L. Hilaire, F.<br />
Lenormand, E. Quemere, G. Sauvion and O. Touret, J. Chem. Soc. Faraday Trans., 1991, 87,<br />
1601-1609.<br />
124 R. Roque-Malherbe, O. N. C. Uwakweh, C. Lozano, R. Polanco, A. Hernandez-Maldonado, P.<br />
Fierro, F. Lugo and J. N. Primera-Pedrozo, J. Phys. Chem. C, 2011, 115, 15555-15569.<br />
125 C. Li, Y. Sakata, T. Arai, K. Domen, K. Maruya and T. Onishi, J. Chem. Soc. , Faraday Trans.,<br />
1989, 85, 929-943.<br />
126 G. Busca and V. Lorenzelli, J. Catal., 1981, 72, 303-313.<br />
127 M. Adamowska, A. Krzton, M. Najbar, P. Da Costa and G. Djega-Mariadassou, Catal. Today,<br />
2008, 137, 288-291.<br />
128 L. Cerruti, E. Modone, E. Guglielminotti and E. Borello, J. Chem. Soc. , Faraday Trans. 1, 1974,<br />
70, 729-739.<br />
129 E. Kugler, A. Kadet and J. Gryder, J. Catal., 1976, 41, 72-81.<br />
130 C. Morterra, F. Boccuzzi, S. Coluccia and G. Ghiotti, J. Catal., 1980, 65, 231-234.<br />
131 D. A. Outka, R. J. Madix, G. B. Fisher and C. Dimaggio, Surf. Sci., 1987, 179, 1-24.<br />
132 B. J. Adelman, T. Beutel, G. -. Lei and W. M. H. Sachtler, J. Catal., 1996, 158, 327-335.<br />
133 G. Delahay, B. Coq, E. Ensuque, F. Figueras, J. Saussey and F. Poignant, Langmuir, 1997, 13,<br />
5588-5592.<br />
203
References<br />
134 M. Niwa, T. Minami, H. Kodama, T. Hattori and Y. Murakami, J. Catal., 1978, 53, 198-207.<br />
135 M. Haneda, T. Morita, Y. Nagao, Y. Kintaichi and H. Hamada, Phys. Chem. Chem. Phys., 2001, 3,<br />
4696-4700.<br />
136 J. Bates and G. Boyd, Appl. Spectrosc., 1973, 27, 204-208.<br />
137 A. Zecchina, C. Arean, G. Palomino, F. Geobaldo, C. Lamberti, G. Spoto and S. Bordiga, Phys.<br />
Chem. Chem. Phys., 1999, 1, 1649-1657.<br />
138 F. Vratny, Appl. Spectrosc., 1959, 13, 59-70.<br />
139 K. Williams, P. Li and J. Devlin, J. Chem. Phys., 1968, 48, 3891-&.<br />
140 W. Fateley, H. Bent and B. Crawford, J. Chem. Phys., 1959, 31, 204-217.<br />
141 M. Nagao, T. Yoshii, T. Hibino, M. Sano and A. Tomita, Electrochem. Solid-State Lett., 2006, 9,<br />
J1-J4.<br />
142 J. Liu, Z. Zhao, C. Xu, A. Duan and G. Jiang, J. Phys. Chem. C, 2008, 112, 5930-5941.<br />
143 B. Klingenberg and M. A. Vannice, Appl. Catal. B, 1999, 21, 19-33.<br />
144 S. Bredikhin, K. Matsuda, K. Maeda and M. Awano, Solid State Ionics, 2002, 149, 327-333.<br />
145 N. Takahashi, K. Yamazaki, H. Sobukawa and H. Shinjoh, Appl. Catal. B, 2007, 70, 198-204.<br />
146 V. G. Milt, M. L. Pissarello, E. E. Miró and C. A. Querini, Appl. Catal. B, 2003, 41, 397-414.<br />
204
References<br />
147 C. Lu, T. Z. Sholklapper, C. P. Jacobson, S. J. Visco and L. C. De Jonghe, J. Electrochem. Soc.,<br />
2006, 153, A1115-A1119.<br />
148 S. P. Jiang, Y. Y. Duan and J. G. Love, J. Electrochem. Soc., 2002, 149, A1175-A1183.<br />
149 K. K. Hansen, M. Wandel, Y. Liu and M. Mogensen, Electrochim. Acta, 2010, 55, 4606-4609.<br />
150 L. A. Chick, L. R. Pederson, G. D. Maupin, J. L. Bates, L. E. Thomas and G. J. Exarhos, Mater Lett,<br />
1990, 10, 6-12.<br />
151 B. A. A. L. van Setten, M. Makkee and J. A. Moulijn, Catal. Rev. - Sci. Eng., 2001, 43, 489.<br />
152 E. Barsoukov and J. R. Macdonald, Impedance Spectroscopy Theory, Experiment and<br />
Applications, Second Edition, John Wiley and Sons, Inc., Hoboken, New Jersey, 2005.<br />
153 T. Jacobsen, B. Zachau-Christiansen, L. Bay and S. Skaarup, High Temperature<br />
Electrochemistry: Ceramics and Metals, 1996, 29-40.<br />
154 S. Omar, E. D. Wachsman, J. L. Jones and J. C. Nino, J. Am. Ceram. Soc., 2009, 92, 2674-2681.<br />
155 S. B. Adler, J. A. Lane and B. C. H. Steele, J. Electrochem. Soc., 1996, 143, 3554-3564.<br />
156 H. Y. Lee, W. S. Cho, S. M. Oh, H. D. Wiemh<strong>of</strong>er and W. Gopel, J. Electrochem. Soc., 1995, 142,<br />
2659-2664.<br />
157 Y. Teraoka, H. M. Zhang, K. Okamoto and N. Yamazoe, Mater. Res. Bull., 1988, 23, 51-58.<br />
205
References<br />
158 Z. Zhang, Y. Zhang, Q. Su, Z. Wang, Q. Li and X. Gao, Environ. Sci. Technol., 2010, 44, 8254-<br />
8258.<br />
159 Z. He, K. Bohm, A. L. Keel, F. B. Nygaard, M. Menon and K. K. Hansen, Ionics, 2009, 15, 427-<br />
431.<br />
160 T. J. Toops, D. B. Smith and W. P. Partridge, Catal. Today, 2006, 114, 112-124.<br />
161 W. S. Epling, A. Yezerets and N. W. Currier, Appl. Catal. B, 2007, 74, 117-129.<br />
162 J. Bruno, A. Cavalheiro, M. Zaghete and J. Varela, Ceram. Int., 2006, 32, 189-194.<br />
163 A. Nzihou, B. Adhikari and R. Pfeffer, Ind. Eng. Chem. Res., 2005, 44, 1787-1794.<br />
164 G. J. Janz, Molten Salts Handbook, Academic Press Inc., New York, 1967.<br />
165 J. I. Gazzarri and O. Kesler, J. Power Sources, 2007, 167, 430-441.<br />
166 E. Murray, T. Tsai and S. Barnett, Solid State Ionics, 1998, 110, 235-243.<br />
167 S. Bredikhin, K. Maeda and M. Awano, Solid State Ionics, 2001, 144, 1-9.<br />
168 S. Gordon and C. Campbell, Anal. Chem., 1955, 27, 1102-1109.<br />
169 F. Lazarini and B. S. Brcic, Monatshefte Für Chemie Und Verwandte Teile Anderer<br />
Wissenschaften, 1966, 97, 1318-&.<br />
170 A. L. Kustov and M. Makkee, Appl. Catal. B, 2009, 88, 263-271.<br />
206
References<br />
171 K. Adams, J. Cavataio and R. Hammerle, Appl. Catal. B, 1996, 10, 157-181.<br />
172 J. Bentzen and J. V. T. Høgh, Report on the Influence <strong>of</strong> Current Density and Temperature on<br />
the Cr evaporation/poisoning and the Cr Poisoning Sensitivity <strong>of</strong> Two Cathode Types, 2007,<br />
Deliverable No. 2.2.1 in the SOFC600 project.<br />
173 J. Bentzen, Personal Communication with J. Bentzen, Senior Development Engineer in<br />
Department <strong>of</strong> Energy Conversion and Storage, Technical University <strong>of</strong> Denmark, April 2012.<br />
174 S. P. Jiang and J. G. Love, Solid State Ionics, 2001, 138, 183-190.<br />
175 S. Koch, M. Mogensen, P. V. Hendriksen, N. Dekker and B. Rietveld, Fuel Cells, 2006, 6, 117-<br />
122.<br />
176 V. Kharton, A. Kovalevsky, A. Viskup, F. Figueiredo, A. Yaremchenko, E. Naumovich and F.<br />
Marques, J. Electrochem. Soc., 2000, 147, 2814-2821.<br />
177 Y. Orikasa, T. Ina, T. Fukutsuka, Y. Uchimoto, K. Amezawa and T. Kawada, Meet. Abstr. -<br />
Electrochem. Soc., 2008, 802, 1304.<br />
178 Y. Orikasa, T. Ina, T. Nakao, T. Fukutsuka, A. Mineshige, K. Amezawa, T. Kawada and Y.<br />
Uchimoto, Meet. Abstr. - Electrochem. Soc., 2010, 1001, 531-531.<br />
179 A. R. West, Basic Solid State Chemistry, John Wiley and Sons, LTD, Chichester, England, 1999.<br />
180 K. Amezawa, T. Ina, Y. Orikasa, A. Unemoto, H. Watanabe, F. Iguchi, Y. Terada, T. Fukutsuka, T.<br />
Kawada, H. Yugami and Y. Uchimoto, ECS Trans., 2009, 25, 345-348.<br />
207
References<br />
181 A. Braun, S. Shrout, A. C. Fowlks, B. A. Osaisai, E. J. Cairns, S. Shrout, B. A. Osaisai, A. C. Fowlks,<br />
S. Seifert, E. Granlund and E. J. Cairns, J. Synchrotron Radiat., 2003, 10, 320-325.<br />
182 M. Balasubramanian, X. Sun, X. Q. Yang and J. McBreen, J. Power Sources, 2001, 92, 1-8.<br />
183 M. Sikora, C. Kapusta, K. Knizek, Z. Jirak, C. Autret, M. Borowiec, C. Oates, V. Prochazka, D.<br />
Rybicki and D. Zajac, Phys. Rev. B, 2006, 73, 094426.<br />
184 H. Bloom, The Chemistry <strong>of</strong> Molten Salts, W. A. Benjamin, Inc., New York, 1967.<br />
185 S. P. Jiang and W. Wang, J. Electrochem. Soc., 2005, 152, A1398-A1408.<br />
186 M. B. Mogensen, M. Søgaard, P. Blennow Tullmar and K. Kammer Hansen, In: Proceedings (on<br />
CD-ROM) 8. European Solid Oxide Forum, Lucerne, 2008.<br />
187 C. Engel and S. Käfer, Personal Communication, Advanced Functional and Sintered Materials -<br />
Ceramics Department, Bosch, 2010.<br />
208
Appendix A<br />
Appendix A<br />
The article “Spectroelectrochemical Cell for in situ studies <strong>of</strong> solid oxide fuel cells” published in<br />
Journal <strong>of</strong> Synchroton Radiation.<br />
209
esearch papers<br />
Journal <strong>of</strong><br />
Synchrotron<br />
Radiation<br />
ISSN 0909-0495<br />
Received 13 December 2011<br />
Accepted 15 February 2012<br />
# 2012 International Union <strong>of</strong> Crystallography<br />
Printed in Singapore – all rights reserved<br />
1. Introduction<br />
Solid oxide fuel cells (SOFCs) produce electricity and heat<br />
from hydrogen- or carbon-containing fuels with high efficiencies<br />
and low pollution degrees; no <strong>NOx</strong> or particles are<br />
emitted. CO2, formed when using carbon-containing fuels,<br />
emerges concentrated and is thus cheaper to collect and to<br />
process further. SOFCs consist <strong>of</strong> two electrodes on the<br />
opposite sides <strong>of</strong> a solid electrolyte layer. The catalytic<br />
processes in a SOFC involve <strong>reduction</strong> <strong>of</strong> oxygen at the<br />
cathode, transport <strong>of</strong> oxygen ions through the cathode and<br />
electrolyte into the anode, where oxidation <strong>of</strong> the fuel<br />
(hydrogen, methane, carbon monoxide) occurs. Materials for<br />
state-<strong>of</strong>-the-art SOFCs comprise Ni/YSZ (yttria stabilized<br />
zirconia) anodes, YSZ electrolytes and LSM/YSZ (lanthanum<br />
strontium manganite) or LSCF (lanthanum strontium cobaltite<br />
ferrite) cathodes. Typical operating temperatures are in the<br />
range between 923 K and 1123 K (see, for example, Huang &<br />
Goodenough, 2009). One <strong>of</strong> the main challenges to be solved<br />
for SOFC technology is maintaining high performance over a<br />
long lifetime.<br />
Large efforts have been focused on studying degradation<br />
processes, identifying origins <strong>of</strong> degradation and developing<br />
improved, more durable SOFCs [see recent status in the<br />
review by Knibbe et al. (2011)]. Usually, SOFCs are tested for<br />
electrochemical performance and afterwards (post mortem)<br />
structural and spectroscopic analysis is carried out. One <strong>of</strong> the<br />
Spectroelectrochemical cell for in situ studies <strong>of</strong><br />
solid oxide fuel cells<br />
Anke Hagen,* Marie Lund Traulsen, Wolff-Ragnar Kiebach and<br />
Bjoern Sejr Johansen<br />
Department <strong>of</strong> Energy Conversion and Storage, <strong>DTU</strong>, Risoe Campus, Frederiksborgvej 399,<br />
Roskilde 4000, Denmark. E-mail: anke@dtu.dk<br />
Solid oxide fuel cells (SOFCs) are able to produce electricity and heat from<br />
hydrogen- or carbon-containing fuels with high efficiencies and are considered<br />
important cornerstones for future sustainable energy systems. Performance,<br />
activation and degradation processes are crucial parameters to control before<br />
the technology can achieve breakthrough. They have been widely studied,<br />
predominately by electrochemical testing with subsequent micro-structural<br />
analysis. In order to be able to develop better SOFCs, it is important to<br />
understand how the measured electrochemical performance depends on<br />
materials and structural properties, preferably at the atomic level. A<br />
characterization <strong>of</strong> these properties under operation is desired. As SOFCs<br />
operate at temperatures around 1073 K, this is a challenge. A spectroelectrochemical<br />
cell was designed that is able to study SOFCs at operating<br />
temperatures and in the presence <strong>of</strong> relevant gases. Simultaneous spectroscopic<br />
and electrochemical evaluation by using X-ray absorption spectroscopy and<br />
electrochemical impedance spectroscopy is possible.<br />
Keywords: XANES; in situ; SOFC; LSCF; impedance spectroscopy.<br />
problems with this approach is the lack <strong>of</strong> information under<br />
operating conditions, and the obtained results from post<br />
mortem evaluation are not always related to the actual<br />
performance/changes <strong>of</strong> performance. For detailed mechanistic<br />
studies on the microscopic/atomic level, materials, single<br />
crystals or specifically designed model systems are used<br />
instead <strong>of</strong> the full electrochemical cell, mostly owing to<br />
restrictions <strong>of</strong> the applied characterization method. In situ<br />
techniques have been developed to overcome this barrier.<br />
The in situ studies investigated, for example, spectroscopic<br />
and structural properties separately from the electrochemical<br />
characteristics, <strong>of</strong>ten using model systems, i.e. material<br />
powders, instead <strong>of</strong> real electrochemical cells. The effect <strong>of</strong><br />
oxygen partial pressure on barium strontium cobaltite ferrite<br />
perovskite-type SOFC cathode materials was, for example,<br />
investigated by Mueller et al. (2009) using XANES (X-ray<br />
absorption near-edge spectroscopy) and EXAFS (extended<br />
X-ray absorption fine structure) at relevant operating<br />
temperatures <strong>of</strong> 773–923 K, revealing the detailed <strong>reduction</strong><br />
processes <strong>of</strong> the transition metals.<br />
The recent progress <strong>of</strong> in situ investigations <strong>of</strong> SOFCs<br />
achieved by optical methods has been summarized by Pomfret<br />
et al. (2010).<br />
Also, for other electrochemical devices, in situ methods<br />
have been further developed. The redox behaviour <strong>of</strong> cuprateand<br />
nickelate-based electrodes for the direct electrochemical<br />
<strong>NOx</strong> <strong>reduction</strong> was studied using in situ XANES at high<br />
400 doi:10.1107/S0909049512006760 J. Synchrotron Rad. (2012). 19, 400–407<br />
electronic reprint
temperature and in the presence <strong>of</strong> relevant gases (NO or air)<br />
(Mueller et al., 2009; Simonsen et al., 2009). The results were<br />
related to separately determined electro-catalytic properties<br />
and the necessity <strong>of</strong> a combination <strong>of</strong> the two method<br />
approaches was concluded in order to be able to identify the<br />
relevant mechanisms.<br />
The combination <strong>of</strong> an electrochemical cell with X-ray<br />
characterization was, for example, reported by Rodriguez et al.<br />
(2000), who successfully investigated Li-ion batteries. These<br />
in situ studies were carried out at room temperature. Also, for<br />
the study <strong>of</strong> Li-ion battery electrodes, an electrochemical<br />
in situ reaction cell was designed and successfully realised by<br />
Braun et al. (2003), allowing for the combination <strong>of</strong> XRD,<br />
ASAXS, XANES and EXAFS characterization.<br />
Ultimately, it is desired to carry out studies under hightemperature<br />
conditions, where electrochemical cells like the<br />
SOFCs are operating, in order to understand phenomena<br />
which only occur under real operating conditions, i.e. under<br />
polarization (current/voltage). It is, for example, well known<br />
that some processes such as the activation <strong>of</strong> LSM-based<br />
cathodes in SOFCs are only occurring under polarization,<br />
which is therefore needed to elucidate the underlying<br />
mechanisms. Yildiz et al. (2006) investigated this effect on<br />
LSM and LSCM (lanthanum strontium calcium manganite)<br />
based electrodes deposited on single-crystal YSZ electrolytes<br />
and related the activation under polarization at higher<br />
temperatures to the change <strong>of</strong> the chemical state <strong>of</strong><br />
lanthanum. Backhaus-Ricoult et al. (2008), on the other hand,<br />
studied the same subject on patterned LSM cathodes on YSZ<br />
electrolytes with an in situ photoelectron microscopy cell and<br />
suggested an extension <strong>of</strong> the active area for oxygen incorporation<br />
over the electrolyte surface by partially reduced<br />
manganese oxide species to be responsible for the activation.<br />
The mechanism <strong>of</strong> electrochemical oxygen <strong>reduction</strong> on<br />
samarium strontium cobaltite cathodes was studied in detail<br />
using in situ potential-dependent FTIR emission spectroscopy<br />
(Lu et al., 2002).<br />
These examples demonstrate that different spectroscopic<br />
methods can be applied during electrochemical operation <strong>of</strong><br />
SOFCs. It is important though to consider the used SOFC<br />
configurations and sets <strong>of</strong> operating conditions before general<br />
conclusions can be drawn. For example, can the different<br />
studies reveal phenomena related to the surface, the bulk or<br />
interface and thus possibly give different feedback for the<br />
same system.<br />
In this paper, an in situ cell is presented that enables the<br />
study <strong>of</strong> real electrochemical cells such as SOFCs at relevant<br />
temperatures and in the presence <strong>of</strong> relevant gases with<br />
respect to electrochemical and spectroscopic properties, using<br />
electrochemical impedance spectroscopy (EIS) and XANES,<br />
respectively.<br />
A combination <strong>of</strong> these two methods was chosen as EIS is a<br />
powerful method for evaluating the resistances <strong>of</strong> the SOFC in<br />
detail; in particular, it is possible to deconvolute the total<br />
resistance <strong>of</strong> the SOFC into contributions from the single<br />
layers and processes in the cell (e.g. Højgaard Jensen et al.,<br />
2009). The chemical and, to a lesser extent, electronic prop-<br />
research papers<br />
erties <strong>of</strong> the constituents <strong>of</strong> the SOFC can be characterized by<br />
using XANES, and the method can be carried out under<br />
conditions relevant for the electrochemical cells. In this paper<br />
the spectroelectrochemical cell was used for SOFCs. They<br />
were characterized by EIS and XANES under conditions<br />
typical for operation <strong>of</strong> a SOFC.<br />
2. Experimental section<br />
2.1. Samples<br />
In order to verify the potential <strong>of</strong> the spectroelectrochemical<br />
cell, the following solid oxide cell configuration<br />
was chosen: on one side <strong>of</strong> the fuel cell a thin-film LSCF<br />
electrode (La0.58Sr0.4Co0.2Fe0.8O3– ) was deposited by pulsed<br />
laser deposition onto a 500 mm-thick YSZ single crystal at<br />
973 K and an oxygen partial pressure (pO2) <strong>of</strong> 300 mtorr. The<br />
thickness <strong>of</strong> the electrode was 270 nm; on the other side <strong>of</strong><br />
the electrolyte, the electrode was a 20 mm-thick conventional<br />
LSCF–CGO10 (cerium gadolinium oxide) composite<br />
electrode deposited by screen-printing on the YSZ single<br />
crystal. The cell was subsequently sintered at 1073 K for 72 h.<br />
The cells were cut into 5 mm 5 mm pieces. Pt-paste<br />
current collection layers were painted on the electrodes while<br />
leaving a small 1 mm 1 mm area in the middle <strong>of</strong> the electrode<br />
free on the thin-film electrode that was used as the<br />
working electrode (see Fig. 1a). This area was used for<br />
detection <strong>of</strong> the fluorescence signal when recording the<br />
XANES spectrum. The cell was placed on the sample holder<br />
(see Fig. 1b) and heated to a temperature <strong>of</strong> 973 K in order to<br />
firmly attach the Pt onto the electrodes.<br />
Figure 1<br />
(a) Illustration <strong>of</strong> the fuel cell configuration: one thin film and one porous<br />
electrode on either side <strong>of</strong> a single-crystal electrolyte, Pt-paste current<br />
collection layer on top <strong>of</strong> the thin-film electrode. (b) Image <strong>of</strong> a 5 mm<br />
5 mm SOFC piece (grey) in the ceramic sample holder. Au wires are<br />
attached using the Pt current-collector layer (white); the spot in the<br />
centre marks the synchrotron beam inlet and fluorescence detection<br />
signal outlet.<br />
J. Synchrotron Rad. (2012). 19, 400–407 Anke Hagen et al. Spectroelectrochemical cell 401<br />
electronic reprint
esearch papers<br />
To verify the results from the spectroelectrochemical cell,<br />
LSCF powders with compositions La0.3Sr0.7Co0.5Fe0.5O3–<br />
(powder 1) and (La0.6Sr0.4)0.99Fe0.8Co0.2O3 (powder 2) were<br />
investigated in another XANES cell set-up. About 3 mg <strong>of</strong> the<br />
powdered samples were mixed with 20 mg alumina in a<br />
mortar, subsequently pressed to pellets <strong>of</strong> diameter 13 mm,<br />
and placed vertically in a glass in situ XANES cell heated by<br />
a tube furnace (for details, see Hagen, 2011). Here, spectra <strong>of</strong><br />
the sample and the respective metal foil as reference were<br />
measured simultaneously in transmission.<br />
2.2. Spectroelectrochemical cell<br />
The cell (see Fig. 2) was made <strong>of</strong> aluminium with Kapton<br />
windows ( 15 mm diameter) for the beam inlets and outlets<br />
straight through the cell and one larger 50 mm window<br />
perpendicular to the beamline for fluorescence detection. It is<br />
equipped with gas inlet and outlet fittings and an insert for the<br />
sample holder, including wires. Radiative heating was realised<br />
Figure 2<br />
Drawing <strong>of</strong> the spectroelectrochemical cell and a photograph <strong>of</strong> it in<br />
operation. The sample holder is inserted vertically from the top. The<br />
heating lamp is on the back and a Kapton window, to measure the<br />
fluorescence, is in front <strong>of</strong> the cell.<br />
by an Osram lamp, and the sample was mounted 6 mm from<br />
the focal point <strong>of</strong> the Osram lamp, to avoid a too violent<br />
heating <strong>of</strong> the sample. The surroundings <strong>of</strong> the sample and the<br />
cell itself remained cold. Using this approach, active cooling to<br />
avoid high temperatures in the close vicinity <strong>of</strong> the spectroelectrochemical<br />
cell and at beamline components was not<br />
needed. If a voltage <strong>of</strong> 15 V is applied on the lamp, a black<br />
body in the focal point <strong>of</strong> the Osram lamp will be at 1573 K.<br />
The temperature was determined directly on the sample<br />
spot by combining EIS with knowledge <strong>of</strong> the conductivity <strong>of</strong><br />
the YSZ electrolyte. Specifically, EIS was recorded and the<br />
serial resistance was determined from the high-frequency<br />
interception <strong>of</strong> the impedance spectrum with the real part <strong>of</strong><br />
the complex impedance. The serial resistance is related to the<br />
conductivity <strong>of</strong> the YSZ according to equation (1), in which<br />
YSZ is the conductivity <strong>of</strong> the YSZ electrolyte, A is the area<br />
<strong>of</strong> the cell and l is the thickness <strong>of</strong> the electrolyte. The<br />
temperature dependency <strong>of</strong> YSZ is given in equation (2), and<br />
by combining (1) and (2) it was possible to precisely determine<br />
the temperature <strong>of</strong> the sample from the recorded EIS,<br />
R Serial ¼ 1<br />
YSZ<br />
l<br />
; ð1Þ<br />
A<br />
YSZ S ½cmŠ ¼3:34 10 4 expð 10300=TÞ:<br />
ð2Þ<br />
The heating rate for the sample was 10 K min 1 . The sample<br />
was tilted approximately 45 compared with the light beam<br />
from the lamp. The gases (21% O2 in He and pure He) were<br />
supplied through mass flow controllers, usually with a flow rate<br />
<strong>of</strong> 20–50 ml min 1 . Different oxygen partial pressures were<br />
obtained by mixing the gas flows appropriately.<br />
2.3. EIS and XANES measurements<br />
The tests were carried out at beamline A1, HASYLAB<br />
(Hamburger Synchrotronstrahlungslabor) at DESY (Deutsches<br />
Elektronen-Synchrotron) in Hamburg. A 1/2 demagnified<br />
focused beam provided a working range <strong>of</strong> 2.4–<br />
8.3 keV. Two Si 111 crystal pairs are installed as monochromators.<br />
In order to focus the beam and effectively<br />
suppress higher harmonics, two mirrors can be used, one Ni<br />
coated and one partly Ni coated and uncoated SiO2.<br />
The cell was positioned between the first ionization<br />
chamber (after the incoming synchrotron beam) and the<br />
second one (before the chamber for reference foils).<br />
A passivated implanted planar silicon (PIPS) detector was<br />
used for the detection <strong>of</strong> fluorescence X-rays from the sample.<br />
The current through the PIPS detector was measured using a<br />
Keithley 428 current meter. Two Mylar foils were used to<br />
shield the light from the spectroelectrochemical cell.<br />
The used XANES energy ranges and step sizes for the<br />
relevant metals are summarized in Table 1. XANES spectra<br />
were recorded periodically during heating and at constant<br />
temperature without and under polarization. The raw data<br />
were treated using the program WinXAS. Typically, the<br />
spectra were smoothed using the Fourier function. The first<br />
inflection point (zero <strong>of</strong> the second derivative) was assigned<br />
402 Anke Hagen et al. Spectroelectrochemical cell J. Synchrotron Rad. (2012). 19, 400–407<br />
electronic reprint
Table 1<br />
Energy intervals and step sizes for XANES measurements.<br />
Fe edge: 7112 eV<br />
Energy (eV) 7063 7107 7140 7210<br />
Step size (eV) 0.5 0.1 0.5 Stop<br />
Co edge: 7709 eV<br />
Energy (eV) 7660 7704 7737 7807<br />
Step size (eV) 0.5 0.1 0.5 Stop<br />
the edge. The background was corrected using two linear<br />
functions and the edge jump was normalized to unity.<br />
The energy calibration was established before and after the<br />
in situ experiments with absorption measurements on a 5 mmthick<br />
Cr metal foil, which was placed between the second and<br />
third ionization chamber.<br />
For impedance spectra and polarization <strong>of</strong> the cells, a<br />
Gamry Reference 600 Potentiostat was used. The impedance<br />
spectra were recorded in the frequency range 1 MHz–0.1 Hz<br />
with the voltage amplitude 36 mV r.m.s. and six points<br />
recorded per decade. The thin-film electrode/working electrode<br />
assembly <strong>of</strong> the fuel cell was polarized cathodically at<br />
100 mV, 300 mV and 500 mV for 1–2 h.<br />
3. Results and discussion<br />
3.1. Selection <strong>of</strong> samples<br />
The probing depth for the K-edges <strong>of</strong> the investigated<br />
transition metals using a fluorescence detector is several<br />
micrometres, depending on the intensity <strong>of</strong> the incoming<br />
beam. The recorded spectra therefore truly represent the bulk<br />
material, since the measurements in the used mode are not<br />
surface sensitive (like, for example, in total-electron-yield<br />
measurements). Thin-film electrodes were chosen for this<br />
study because a change in oxidation state owing to the<br />
polarization should be easier to detect on thin-film electrodes<br />
compared with conventional porous electrodes for the<br />
following reason: when a conventional screen-printed electrode<br />
<strong>of</strong> 20–30 mm thickness is polarized, the current flow<br />
owing to the migration <strong>of</strong> O 2<br />
ions, and thereby the change in<br />
oxidation states in the electrode material, will be largest in the<br />
electrode part closest to the electrolyte (Nielsen et al., 2011).<br />
As the XANES spectrum is probing the bulk, a XANES<br />
spectrum recorded on conventional electrodes under polarization<br />
will probably not be able to detect the changes in the<br />
oxidation states occurring only in the deeper electrode layers<br />
closer to the electrolyte. By choosing a thin-film sample <strong>of</strong><br />
300 nm thickness, the O 2 migration and change in oxidation<br />
state is expanded through the entire thin film, and will<br />
therefore be better detectable in the XANES spectrum.<br />
3.2. XANES verification<br />
The fuel cells contained LSCF layers that are used for<br />
SOFC cathodes on a YSZ electrolyte. In order to assign<br />
the comparability <strong>of</strong> XANES spectra <strong>of</strong> LSCF for different<br />
sample compositions, preparations, measuring conditions and<br />
XANES configurations, room-temperature XANES spectra<br />
research papers<br />
Table 2<br />
Edge energy values for LSCF in fuel cells (La 0.58Sr 0.4Co 0.2Fe 0.8O 3- ),<br />
measured in the spectroelectrochemical cell, LSCF powder 1 (La0.3Sr0.7-<br />
Co0.5Fe0.5O3- ) and LSCF powder 2 [(La0.6Sr0.4)0.99Fe0.8Co0.2O3], both<br />
measured in the XANES cell presented by Hagen (2011), obtained from<br />
XANES spectra at room temperature and 773 K or 873 K.<br />
Room<br />
temperature 773 K 873 K E<br />
Fe XANES edge<br />
Fuel cell (eV) 7128.2 7127.8 0.4<br />
Powder 1 (eV) 7128.1 7128.0 0.1<br />
Powder 2 (eV) 7127.3<br />
Co XANES edge<br />
Fuel cell (eV) 7726.0 7724.9 1.1<br />
Powder 1 (eV) 7724.6 7723.7 0.9<br />
Powder 2 (eV) 7724.1<br />
were recorded. In Fig. 3 (for values see Table 2), roomtemperature<br />
Fe XANES spectra for two fuel cells from<br />
different batches are shown together with a LSCF powder<br />
pressed to a pellet with alumina and measured previously at<br />
room temperature in the XANES cell described by Hagen<br />
(2011). The spectra show pre-edge features originating from 1s<br />
to 3d transitions, while the white line (maximum at the edge) is<br />
due to dipole-allowed 1s to 4p transitions [for a detailed<br />
discussion see also Haas et al. (2009)]. The edge energies for<br />
the main Fe edge were around 7.128 keV in all cases (7.1282<br />
and 7.1283 keV for the two fuel cells). Consequently,<br />
comparing the two different types <strong>of</strong> LSCF samples, a good<br />
agreement can be concluded. The LSCF electrodes in the two<br />
fuel cells from different batches yield almost identical XANES<br />
spectra; small differences are only visible after the pre-edge<br />
feature, which indicate a robust and reproducible way <strong>of</strong><br />
sample preparation and measurement.<br />
The Co valence (and thus edge) is very sensitive to the<br />
stoichiometry/oxygen vacancies <strong>of</strong> the perovskite sample.<br />
Therefore, the edge energies are to some extent different for<br />
Figure 3<br />
Room-temperature Fe XANES spectra <strong>of</strong> two fuel cells with LSCF layers<br />
deposited on YSZ from two batches (measured in 21% O 2 in He using<br />
fluorescence detector in the spectroelectrochemical cell) and one LSCF<br />
powder, pressed into a pellet using alumina [measured in air in<br />
transmission, in the in situ cell presented by Hagen (2011)].<br />
J. Synchrotron Rad. (2012). 19, 400–407 Anke Hagen et al. Spectroelectrochemical cell 403<br />
electronic reprint
esearch papers<br />
the different LSCF samples (see Table 2), where the formal<br />
valence <strong>of</strong> Co at room temperature is in the order<br />
La0.58Sr0.4Co0.2Fe0.8O3– (fuel cell) > (La0.6Sr0.4)0.99Fe0.8-<br />
Co0.2O3 (powder 2) ’ La0.3Sr0.7Co0.5Fe0.5O3– ) (powder 1).<br />
Thus, the differences can be related to the chemical composition<br />
<strong>of</strong> the LSCF samples and not to the configuration <strong>of</strong> the<br />
XANES set-up.<br />
The fuel cells were heated to 873 K in 21% O2 in He. In<br />
Fig. 4 the Fe and Co XANES spectra are shown for room<br />
temperature and 873 K. For the case <strong>of</strong> iron, only small<br />
changes were observed comparing room temperature and<br />
873 K spectra. Quantitative analysis revealed a change <strong>of</strong> the<br />
edge energy by 0.4 eV towards lower energies (see Table 2).<br />
Such a small change is close to the error <strong>of</strong> the measurement<br />
<strong>of</strong> 0.1–0.2 eV. Evaluating the cobalt in the LSCF, on the other<br />
hand, a significant shift <strong>of</strong> the XANES spectrum towards<br />
lower energies was observed. The energy value for the main<br />
absorption edge decreased by 1.1 eV, indicating a <strong>reduction</strong> <strong>of</strong><br />
cobalt ions in the perovskite structure from four to lower<br />
valance. The same effect was observed when a LSCF powder<br />
was studied, although the highest temperature in this case was<br />
only 773 K and the gas atmosphere was synthetic air (see<br />
Table 2).<br />
Figure 4<br />
Fe-XANES (a) and Co-XANES (b) spectra <strong>of</strong> the fuel cell with LSCF<br />
electrodes recorded at room temperature and at 873 K in 21% O 2 in He.<br />
The positions <strong>of</strong> the energy features (threshold, pre-edge<br />
peak, main edge and 1s to 4p transition) in XANES spectra <strong>of</strong><br />
metal oxides are strongly dependent on the oxidation state <strong>of</strong><br />
the absorbing transition metal. It was found that they shifted<br />
linearly to higher-energy values (so-called chemical shift) with<br />
increasing oxidation state <strong>of</strong> the metal (Wong et al., 1984). In<br />
addition to the valence, the chemical shift is due to electronegativity<br />
<strong>of</strong> ligands, coordination number and other structural<br />
features. Typically, the edge energy shifts by 2–4 eV when<br />
the oxidation state shifts by one unit [see, for example, Wong<br />
et al. (1984) and Rasmussen et al. (2003) for vanadium,<br />
Figueroa et al. (2005) for manganese, and Le Toquin et al.<br />
(2006) for copper in different oxidic structures]. In the present<br />
studies the energy shift <strong>of</strong> 1.1 eV would correspond to a mean<br />
oxidation state <strong>of</strong> cobalt in the reduced state <strong>of</strong> 3.7 or a<br />
<strong>reduction</strong> <strong>of</strong> up to 1/3 Co(IV) to Co(III) ions [see also<br />
discussion in Hagen & Mikkelsen (2005)].<br />
The partial <strong>reduction</strong> <strong>of</strong> Co ions in the LSCF perovskite<br />
structure can be related to the change <strong>of</strong> the oxygen<br />
stoichiometry in samples <strong>of</strong> the general formula<br />
La1–xSrxCo1–yFeyO3– , where expresses the degree <strong>of</strong> oxygen<br />
non-stoichiometry. It was found by, for example, temperatureprogrammed<br />
<strong>reduction</strong> and solid electrolyte coulometry that<br />
increased with increasing temperature, decreasing oxygen<br />
partial pressure and increasing Sr or Co content (Mantzavinos<br />
et al., 2000; Scott et al., 2002).<br />
Using the edge energy shift obtained by XANES between<br />
room and elevated temperature in this work and the related<br />
estimated portion <strong>of</strong> reduced Co in the perovskite, a <strong>of</strong><br />
0.05 can be estimated. This value fits well into the general<br />
trend found by Scott et al. (2002) or by Plonczak et al. (2012).<br />
The strength <strong>of</strong> the XANES method as applied here is that the<br />
<strong>reduction</strong> as a consequence <strong>of</strong> a change <strong>of</strong> the oxygen stoichiometry<br />
can be mainly related to the Co ions in the<br />
perovskite. With these first measurements at room and<br />
elevated temperature, the spectroelectrochemical cell was<br />
verified with regard to choice <strong>of</strong> sample (powder versus fuel<br />
cell), temperature (different heating methods and temperature<br />
probes) and reproducible XANES spectra (transmission<br />
versus fluorescence in different set-ups).<br />
3.3. EIS verification<br />
The electrochemical properties were studied by EIS at<br />
temperatures around 873 K. In order to verify the spectroelectrochemical<br />
cell regarding EIS, the results are compared<br />
with impedance spectra recorded in a typical set-up for EIS<br />
on symmetric cells with thin-film LSCF electrodes on both<br />
sides <strong>of</strong> a YSZ electrolyte crystal (‘thin-film cells’). In Fig. 5<br />
the impedance spectra are presented by Nyquist and Bode<br />
plots.<br />
The primary resistance values obtained from the Nyquist<br />
plot <strong>of</strong> impedance spectra <strong>of</strong> an electrochemical cell are the<br />
serial and the polarization resistance (see Fig. 5a). The serial<br />
resistance (Rs) in the impedance plot is the value <strong>of</strong> the highfrequency<br />
interception <strong>of</strong> the curve with the real part <strong>of</strong> the<br />
complex impedance and originates mainly from the ohmic<br />
404 Anke Hagen et al. Spectroelectrochemical cell J. Synchrotron Rad. (2012). 19, 400–407<br />
electronic reprint
Figure 5<br />
Impedance spectra, Nyquist plots (a, b) and Bode plots (c, d) measured<br />
on the fuel cell in the spectroelectrochemical cell at 863 K and 873 K in<br />
21% O 2 in He (a, c), and on the thin-film cell, measured in the EIS set-up<br />
at 873 K and 898 K in 100% O 2 (b, d). R s and R p are illustrated on the<br />
impedance spectrum at 883 K (a).<br />
resistance <strong>of</strong> the electrolyte. This value is for a given electrolyte<br />
(and known thickness) correlated with the temperature<br />
[see equations (1) and (2)]. The polarization resistance (Rp) is<br />
the difference between the low- and high-frequency interceptions<br />
(see Fig. 5a) and is a measure <strong>of</strong> the losses (activity)<br />
<strong>of</strong> the electrode. The smaller the resistance, the more active is<br />
the electrode. Further, time-resolved elementary processes on<br />
the electrode appear as single arcs that partly overlap in the<br />
polarization part <strong>of</strong> the plot. They become more visible in a<br />
first approximation by the Bode plot <strong>of</strong> the impedance spectrum<br />
[see Figs. 5(c) and 5(d)]. The impedance spectra are<br />
sensitive to the structural and compositional characteristics <strong>of</strong><br />
a specific electrode, and the operating conditions.<br />
The impedance spectrum <strong>of</strong> the fuel cell (Fig. 5a) yields the<br />
combined resistances from both electrodes, one being a thinfilm<br />
LSCF electrode and the other a porous LSCF/CGO<br />
composite. By far the largest impedance contribution [factor<br />
100, compare with typical values for porous LSCF-based<br />
cathodes in Nielsen et al. (2011)] arises from the thin-film<br />
electrode, owing to the small surface area and thus very low<br />
activity. When evaluating the impedance spectra, the focus can<br />
therefore be placed on the thin-film electrode.<br />
The two impedance spectra in Fig. 5(a) were obtained at 863<br />
and 883 K. The increase <strong>of</strong> the temperature by only 20 K leads<br />
to a decrease <strong>of</strong> the polarization (electrode) resistance by a<br />
research papers<br />
factor <strong>of</strong> 3, which corresponds to an increase <strong>of</strong> the electrochemical<br />
activity. In Fig. 5(b) the impedance spectra <strong>of</strong> the<br />
thin-film cells measured in the EIS set-up are shown for two<br />
temperatures. A significantly larger polarization resistance<br />
was obtained at 873 K (the same temperatures as in the<br />
spectroelectrochemical cell). This could be due to a thicker<br />
electrode and/or lower surface area. By increasing the<br />
temperature to 898 K, the polarization resistance decreased<br />
significantly and thus the trend measured in the spectroelectrochemical<br />
cell was confirmed.<br />
The Bode plots for both cells [Fig. 5(c) and 5(d)] indicate<br />
a pronounced process around frequencies <strong>of</strong> 1 Hz, which is<br />
assigned to oxygen stoichiometry changes in the LSCF thinfilm<br />
electrodes.<br />
Despite the different absolute values for the polarization<br />
resistances, the spectra obtained in the spectroelectrochemical<br />
cell and the EIS set-up show, in general, similar characteristics<br />
and trends with temperature and the results from the first can<br />
be used to evaluate electrochemical properties simultaneously<br />
with XANES.<br />
3.4. Polarization <strong>of</strong> the fuel cell<br />
As outlined in the Introduction, the ultimate objective is to<br />
characterize electrochemical cells under operating conditions<br />
that include the effect <strong>of</strong> polarization. The fuel cell was heated<br />
to 873 K and subjected to different potentials. Impedance<br />
spectra were recorded and XANES spectra as well. Polarization<br />
changes the local pO2 and is thus expected to affect the<br />
oxidation state <strong>of</strong> cobalt in particular (Orikasa et al., 2011).<br />
During the heating, the periods <strong>of</strong> polarization and the<br />
periods at open circuit voltage, Co and Fe XANES spectra<br />
were recorded. In Fig. 6 the edge energy values for Co and Fe,<br />
the polarization and temperatures are shown over the whole<br />
Figure 6<br />
Co (circles) and Fe (diamonds) edge energies deduced from XANES<br />
spectra, expressed as E (E edge E edge-Me), are shown for the whole test<br />
sequence together with the polarization (full line) and temperature<br />
(dotted line); the stars on the time axis mark the times <strong>of</strong> recording<br />
impedance spectra (shown in Fig. 7).<br />
J. Synchrotron Rad. (2012). 19, 400–407 Anke Hagen et al. Spectroelectrochemical cell 405<br />
electronic reprint
esearch papers<br />
Figure 7<br />
Impedance spectra <strong>of</strong> the fuel cell with LSCF electrodes recorded in 21%<br />
O 2 in He in the spectroelectrochemical cell before polarization (open<br />
symbols, 873 K), after polarization at initially 100 mV, later 100 mV,<br />
followed by 300 mV (grey symbols, 823 K), and after additional 3h<br />
polarization at 500 mV (black symbols, 823 K).<br />
test sequence. When heating from room temperature to 873 K<br />
without polarization, the edge energies for Co and Fe<br />
decreased, more significantly for cobalt (see Table 2), indicating<br />
a <strong>reduction</strong> <strong>of</strong> mainly cobalt ions in the perovskite<br />
structure, as presented and discussed in x3.2. In the period<br />
following the start <strong>of</strong> polarization at different degrees, both<br />
edge energies remained almost constant. The XANES spectra<br />
demonstrated that temperature has a larger effect on the<br />
oxidation states <strong>of</strong> cobalt (and iron) than polarization.<br />
In Fig. 7 impedance spectra recorded before and after<br />
polarization at 300 and 500 mVare shown. Only small changes<br />
have occurred. The slight change <strong>of</strong> the serial resistance is<br />
most likely due to small temperature changes and not a result<br />
<strong>of</strong> the polarization. The spectrum recorded after exposure to<br />
the highest polarization <strong>of</strong> 500 mV indicates a slight decrease<br />
<strong>of</strong> the polarization resistance, i.e. the electrode seems to have<br />
activated. In general, the EIS results from before and after<br />
polarization are thus in line with the obtained XANES<br />
spectra, where no significant changes were observed as an<br />
effect <strong>of</strong> the polarization (see Fig. 6). It can be argued whether<br />
there should have occurred more significant changes <strong>of</strong> the<br />
oxidations states <strong>of</strong> cobalt and iron owing to polarization. The<br />
following issues have to be considered. The magnitude <strong>of</strong><br />
polarization could be an important factor, i.e. that it was too<br />
low in this study to induce changes. Electrode thickness could<br />
be another parameter, even though the measurements were<br />
made on thin-film electrodes in this study. Further, the oxygen<br />
non-stoichiometry <strong>of</strong> the thin-film electrode used in this study<br />
could be a reason why no significant effects were observed<br />
owing to polarization. It has been shown to be lower when<br />
compared with bulk samples, maybe owing to ‘imperfect’ thin<br />
films (Plonczak et al., 2012). The lower oxygen-nonstoichiometry<br />
means a lower number <strong>of</strong> positive ions with a change in<br />
polarization state during polarization and thus a smaller effect<br />
observable by XANES.<br />
Future work should comprise thin layers <strong>of</strong> porous LSCF<br />
electrodes with a larger oxygen non-stoichiometry and cathodes<br />
with varying Co/Fe ratios to explore the mechanism <strong>of</strong><br />
oxygen <strong>reduction</strong> under polarization in the SOFC in more<br />
detail.<br />
4. Conclusion<br />
The spectroelectrochemical cell used in this study for the first<br />
time proved to be able to provide reliable data for electrical<br />
impedance and for XANES under relevant conditions <strong>of</strong> a<br />
fuel cell, i.e. at elevated temperature, in the presence <strong>of</strong><br />
relevant gases and under polarization. It has the potential<br />
to measure on a real solid oxide fuel cell and thus provide<br />
simultaneously information about the electrochemical<br />
performance and state <strong>of</strong> the transition metal components in<br />
the electrodes under operation.<br />
Fuel cells with thin-film LSCF electrodes were studied at<br />
873 K in synthetic air. When heating from room temperature,<br />
cobalt ions in the perovskite structure were reduced. The<br />
application <strong>of</strong> a polarization on the electrodes did not affect<br />
the oxidation states <strong>of</strong> iron or cobalt. Neither were the electrochemical<br />
properties, i.e. electrode processes, affected to a<br />
large extent as revealed by electrical impedance spectroscopy.<br />
Further investigations are needed to reveal the effects <strong>of</strong><br />
polarization, electrode composition and structure, pO2, etc. on<br />
the electrode activity and the related characteristic oxidation<br />
states <strong>of</strong> the electrode components. Furthermore, a refined<br />
study might be able to distinguish processes occurring at the<br />
electrode/electrolyte interface from bulk processes in the<br />
electrode.<br />
HASYLAB is gratefully acknowledged for providing<br />
beamline facilities and technical support. The authors thank<br />
Pawel Plonczak for providing EIS <strong>of</strong> thin film samples for<br />
comparison and for manufacturing the thin-film electrodes<br />
studied in this work, and Martin Soegaard for fruitful scientific<br />
discussions. This work was supported by The Programme<br />
Commission on Sustainable Energy and Environment, The<br />
Danish Council for Strategic Research, via the Strategic<br />
Electrochemistry Research Center (SERC) (http://www.<br />
serc.dk/), contract No. 2104-06-0011.<br />
References<br />
Backhaus-Ricoult, M., Adib, K., St Clair, T., Luerssen, B., Gregoratti,<br />
L. & Barinov, A. (2008). Solid State Ion. 179, 891–895.<br />
Braun, A., Shrout, S., Fowlks, A. C., Osaisai, B. A., Seifert, S.,<br />
Granlund, E. & Cairns, E. J. (2003). J. Synchrotron Rad. 10, 320–<br />
325.<br />
Figueroa, S. J. A., Requejo, F. G., Lede, E. J., Lamaita, L., Andres<br />
Peluso, M. & Sambeth, J. E. (2005). Catal. Today, 107–108, 849–855.<br />
Haas, O., Vogt, U. F., Soltmann, C., Braun, A., Yoon, W.-S., Yang,<br />
X. Q. & Graule, T. (2009). Mater. Res. Bull. 44, 1397–1404.<br />
Hagen, A. (2011). Chem. Phys. Lett. 502, 235–240.<br />
Hagen, A. & Mikkelsen, L. (2005). Proceedings <strong>of</strong> the 26th Risø<br />
International Symposium on Materials Science: Solid State Electrochemistry,<br />
edited by S. Linderoth, A. Smith, N. Bonanos, A. Hagen,<br />
L. Mikkelsen, K. Kammer, D. Lybye, P. V. Hendriksen, F. W.<br />
Poulsen, M. Mogensen and W. G. Wang, pp. 197–202, Risø National<br />
Laboratory, Roskilde, Denmark.<br />
Højgaard Jensen, S., Hjelm, J., Hagen, A. & Mogensen, M. B. (2009).<br />
Handbook <strong>of</strong> Fuel Cells, p. 1090. New York: Wiley.<br />
Huang, K. & Goodenough, J. B. (2009). Editors. Solid Oxide Fuel Cell<br />
Technology: Principles, Performance and Operations. Oxford:<br />
Woodhead.<br />
406 Anke Hagen et al. Spectroelectrochemical cell J. Synchrotron Rad. (2012). 19, 400–407<br />
electronic reprint
Knibbe, R., Hauch, A., Hjelm, J., Ebbesen, S. D. & Mogensen, M.<br />
(2011). Green, 1, 141–169.<br />
Le Toquin, R., Paulus, W., Cousson, A., Prestipino, C. & Lamberti, C.<br />
(2006). J. Am. Chem. Soc. 128, 13161–13174.<br />
Lu, X., Faguy, P. W. & Liu, M. (2002). J. Electrochem. Soc. 149,<br />
A1293–A1298.<br />
Mantzavinos, D., Hartley, A., Metcalfe, I. S. & Sahibzada, M. (2000).<br />
Solid State Ion. 134, 103–109.<br />
Mueller, N., De Souza, R. A., Brendt, J., Samuelis, D. & Martin, M.<br />
(2009). J. Mater. Chem. 19, 1960–1963.<br />
Nielsen, J., Jacobsen, T. & Wandel, M. (2011). Electrochem. Acta, 56,<br />
7963–7974.<br />
Orikasa, Y., Ina, T., Nakao, T., Mineshige, A., Amezawa, K., Oishi,<br />
M., Arai, H., Ogumi, Z. & Uchimoto, Y. (2011). Phys. Chem. Chem.<br />
Phys. 13, 16637–16643.<br />
Plonczak, P., Bierberle-Hütter, A., Søga˚rd, M., Hendriksen, P. V. &<br />
Gauckler, L. J. (2012). J. Electrochem. Soc. 159, B1–B12.<br />
research papers<br />
Pomfret, M. B., Owrutsky, J. C. & Walker, R. (2010). Annu. Rev. Anal.<br />
Chem. 3, 151–174.<br />
Rasmussen, S. B., Hagen, S., Masters, S., Hagen, A., Sta˚hl, K., Eriksen,<br />
K. M., Simonsen, P., Jensen, J. N., Berg, M., Chorkendorff, I. &<br />
Fehrmann, R. (2003). PowerPlant Chem. 5, 360–369.<br />
Rodriguez, M. A., Ingersoll, D. & Doughty, D. H. (2000). Adv. X-ray<br />
Anal. 42, 267–275.<br />
Scott, S. P., Mantzavinos, D., Hartley, A., Sahibzada, M. & Metcalfe,<br />
I. S. (2002). Solid State Ion. 152–153, 777–781.<br />
Simonsen, V. L. E., Nørskov, L., Hagen, A. & Kammer Hansen, K.<br />
(2009). J. Solid State Electrochem. 13, 1529–1534.<br />
Wong, J., Lytle, F. W., Messmer, R. P. & Maylotte, D. H. (1984). Phys.<br />
Rev. B, 30, 5596–5610.<br />
Yildiz, B., Chang, K.-C., Myers, D., Carter, J. D. & You, H. (2006).<br />
Proceedings <strong>of</strong> the 7th European Solid Oxide Fuel Cell Forum, 3–7<br />
July 2006.<br />
J. Synchrotron Rad. (2012). 19, 400–407 Anke Hagen et al. Spectroelectrochemical cell 407<br />
electronic reprint


