- Page 1 and 2: United States Office of Air and Rad
- Page 3 and 4: NOTICE The following two-volume rep
- Page 5 and 6: This publication is the result of a
- Page 7 and 8: TO COMMENT ON THIS GUIDE OR PROVIDE
- Page 9 and 10: CONTENTS NOTICE ...................
- Page 11 and 12: 5.6 Plutonium Geochemistry and K d
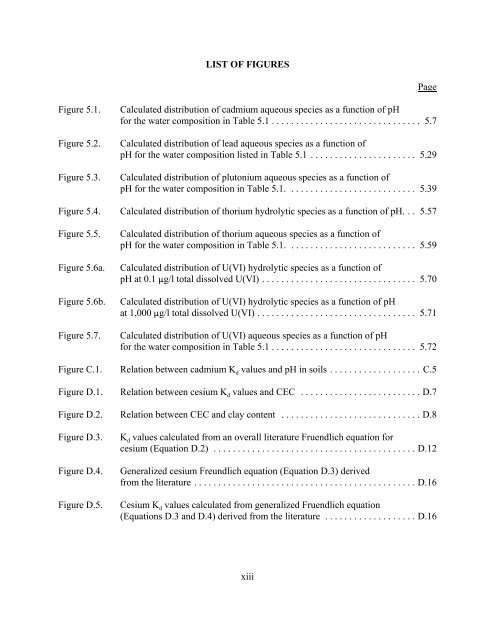
- Page 13: Appendix C - Partition Coefficients
- Page 17 and 18: Table 5.16. Uranium(VI) aqueous spe
- Page 19 and 20: Table H.4. Look-up table for estima
- Page 21 and 22: 1.0 Introduction The objective of t
- Page 23 and 24: eviewed. The main focus of Volume I
- Page 25 and 26: 2.0 The Kd Model The simplest and m
- Page 27 and 28: no longer be used to perform the in
- Page 29 and 30: of the velocity of the contaminant
- Page 31 and 32: An increasing body of evidence indi
- Page 33 and 34: contaminants of interest and the as
- Page 35 and 36: dissolved gases and complexing liga
- Page 37 and 38: Element Table 5.2. Concentrations o
- Page 39 and 40: 5.6
- Page 41 and 42: 5.8
- Page 43 and 44: 5.2.4 Dissolution/Precipitation/Cop
- Page 45 and 46: 1980). In contrast, zinc almost com
- Page 47 and 48: 5.2.6.2.2 Limits of K d Values with
- Page 49 and 50: 5.3 Cesium Geochemistry and K d Val
- Page 51 and 52: Cesium may also adsorb to iron oxid
- Page 53 and 54: Table 5.5. Estimated range of K d v
- Page 55 and 56: ore processing, plating operations,
- Page 57 and 58: elow the isoelectric point, the min
- Page 59 and 60: Among all available data for Cr(VI)
- Page 61 and 62: 5.5 Lead Geochemistry and K d Value
- Page 63 and 64: on dissolution/precipitation of lea
- Page 65 and 66:
Percent Distribution 100 80 60 40 2
- Page 67 and 68:
A number of studies have confirmed
- Page 69 and 70:
Solid organic matter such as humic
- Page 71 and 72:
Plutonium is produced by fissioning
- Page 73 and 74:
The pe is related to Eh by the equa
- Page 75 and 76:
Table 5.10. Plutonium aqueous speci
- Page 77 and 78:
5.6.5 Sorption/Desorption Plutonium
- Page 79 and 80:
conditions depended on the colloida
- Page 81 and 82:
5.6.6.2.2 Limits of K d Values with
- Page 83 and 84:
present in vadose zone pore water w
- Page 85 and 86:
There is little tendency for stront
- Page 87 and 88:
strontium partitions from the disso
- Page 89 and 90:
greater than about 10 -4 M, humic s
- Page 91 and 92:
Table 5.13. Look-up table for estim
- Page 93 and 94:
1976; Cotton and Wilkinson, 1980).
- Page 95 and 96:
Table 5.14. Thorium aqueous species
- Page 97 and 98:
Figure 5.5 changes slightly in the
- Page 99 and 100:
to less than 10 -9 mol/l (0.0002 mg
- Page 101 and 102:
Based on the assumptions and limita
- Page 103 and 104:
5.10 Tritium Geochemistry And K d V
- Page 105 and 106:
Uranium(VI) species dominate in oxi
- Page 107 and 108:
most natural waters. For waters ass
- Page 109 and 110:
U(IV) mineral, is a primary mineral
- Page 111 and 112:
Percent Distribution 100 80 60 40 2
- Page 113 and 114:
5.11.6 Partition Coefficient, K d ,
- Page 115 and 116:
strong anionic carbonato complexes.
- Page 117 and 118:
Elemen t Table 5.18. Selected chemi
- Page 119 and 120:
Another objective of this report is
- Page 121 and 122:
6.0 REFERENCES Adriano, D. C. 1992.
- Page 123 and 124:
Billon, A. 1982. “Fixation D’el
- Page 125 and 126:
Chisholm-Brause, C., S. D. Conradso
- Page 127 and 128:
EPA/DOE/NRC (Cooperative Effort by
- Page 129 and 130:
Griffin, R. A., and N. F. Shimp. 19
- Page 131 and 132:
+ Keeney-Kennicutt, W. L., and J. W
- Page 133 and 134:
McBride, M. B. 1980. “Chemisorpti
- Page 135 and 136:
Östhols, E. 1995. “Thorium Sorpt
- Page 137 and 138:
Rhoads, K., B. N. Bjornstad, R. E.
- Page 139 and 140:
Schwertmann, U., and R. M. Taylor.
- Page 141 and 142:
Tanner, A. B., 1980. “Radon Migra
- Page 143 and 144:
Zimdahl, R. L., and J. J. Hassett.
- Page 145 and 146:
APPENDIX A Acronyms, Abbreviations,
- Page 147 and 148:
PC Personal computers operating und
- Page 149 and 150:
A.3.0 List of Symbols and Notation
- Page 151 and 152:
APPENDIX B Definitions
- Page 153 and 154:
Cation Exchange - reversible adsorp
- Page 155 and 156:
subbituminous coal. Marl - an earth
- Page 157 and 158:
APPENDIX C Partition Coefficients F
- Page 159 and 160:
Mean Standard Error Table C.1. Desc
- Page 161 and 162:
Figure C.1. Relation between cadmiu
- Page 163 and 164:
Cd K d (ml/g) Clay Cont. (wt%) pH C
- Page 165 and 166:
Cd K d (ml/g) Clay Cont. (wt%) pH C
- Page 167 and 168:
Cd K d (ml/g) Clay Cont. (wt%) pH C
- Page 169 and 170:
Cd K d (ml/g) Clay Cont. (wt%) pH C
- Page 171 and 172:
Cd K d (ml/g) Clay Cont. (wt%) pH C
- Page 173 and 174:
APPENDIX D Partition Coefficients F
- Page 175 and 176:
Two separate data sets were compile
- Page 177 and 178:
The soil-only data set was frequent
- Page 179 and 180:
The high correlations between mica
- Page 181 and 182:
D.2.4 Cesium Adsorption onto Mica-L
- Page 183 and 184:
Table D.7. Approximate upper limits
- Page 185 and 186:
Table D.8. Freundlich equations ide
- Page 187 and 188:
Table D.9. Descriptive statistics o
- Page 189 and 190:
D.2.6 Approach to Selecting K d Val
- Page 191 and 192:
Mica Concentration in Clay Fraction
- Page 193 and 194:
Cesium Kd (ml/g) 15200 8440 143 73
- Page 195 and 196:
Cesium Kd (ml/g) Clay (wt.%) Mica (
- Page 197 and 198:
Cesium Kd (ml/g) Clay (wt.%) Mica (
- Page 199 and 200:
D.4.0 Data Set for Soils Table D.14
- Page 201 and 202:
Cesium K d (ml/g) Clay (wt%) Mica (
- Page 203 and 204:
Li, Y., L. Burkhardt, M. Buchholtz,
- Page 205 and 206:
APPENDIX E Partition Coefficients F
- Page 207 and 208:
Windsor, and Olivier soils with pH
- Page 209 and 210:
Table E.1. Summary of K d values fo
- Page 211 and 212:
E.2.0 Approach The approach used to
- Page 213 and 214:
Table E.3. Estimated range of K d v
- Page 215 and 216:
Table E.4. Data from Rai et al. (19
- Page 217 and 218:
E.4.0 References Davis, J. A. and J
- Page 219 and 220:
APPENDIX F Partition Coefficients F
- Page 221 and 222:
(CEC) of the soils. Such an anomaly
- Page 223 and 224:
Table F.1. Summary of K d values fo
- Page 225 and 226:
Figure F.2. Variation of K d as a f
- Page 227 and 228:
F.4.0 References Abd-Elfattah, A.,
- Page 229 and 230:
APPENDIX G Partition Coefficients F
- Page 231 and 232:
influenced significantly by the typ
- Page 233 and 234:
The Pu(IV) and Pu(V) adsorption dat
- Page 235 and 236:
that Pu(IV) adsorption on soils wou
- Page 237 and 238:
Table G.1. Plutonium adsorption dat
- Page 239 and 240:
KD PH CEC EC DCARB Figure G.1. Scat
- Page 241 and 242:
Figure G.2. Variation of K d for pl
- Page 243 and 244:
Delegard, C. H. , G. S. Barney, and
- Page 245 and 246:
Seattle, Washington, pp. 291-497. B
- Page 247 and 248:
H.1.0 Background Appendix H Partiti
- Page 249 and 250:
H.2.0 Approach and Regression Model
- Page 251 and 252:
strontium K d values, which are cle
- Page 253 and 254:
Table H.3. Simple and multiple regr
- Page 255 and 256:
Table H.4. Look-up table for estima
- Page 257 and 258:
H.3.0 K d Data Set for Soils Table
- Page 259 and 260:
Sr K d (ml/g) Clay Content (%) pH C
- Page 261 and 262:
H.4.0 K d Data Set for Pure Mineral
- Page 263 and 264:
Sr K d (ml/g) Clay Content (%) pH C
- Page 265 and 266:
Sr K d (ml/g) Clay Content (%) pH C
- Page 267 and 268:
Sr K d (ml/g) Clay Content (%) pH C
- Page 269 and 270:
H.5.0 References Adeleye, S. A., P.
- Page 271 and 272:
Satmark, B., and Y. Albinsson. 1991
- Page 273 and 274:
I.1.0 BACKGROUND Appendix I Partiti
- Page 275 and 276:
Table I.2. Correlation coefficients
- Page 277 and 278:
The regression equation between the
- Page 279 and 280:
I.3.0 K d Data Set for Soils Figure
- Page 281 and 282:
I.5.0 References Ames, L. L., and D
- Page 283 and 284:
APPENDIX J Partition Coefficients F
- Page 285 and 286:
J.2.1 Sources of Error and Variabil
- Page 287 and 288:
Erikson et al. (1993) determined th
- Page 289 and 290:
26.1 wt.% plagioclase feldspar, and
- Page 291 and 292:
Kd (ml/g) 100,000 10,000 1,000 100
- Page 293 and 294:
Sheppard and Thibault (1988) invest
- Page 295 and 296:
Warnecke et al. (1986) present an o
- Page 297 and 298:
Borovec (1981) investigated the ads
- Page 299 and 300:
Table J.2. Uranium K d values liste
- Page 301 and 302:
J.3.0 Approach in Developing K d Lo
- Page 303 and 304:
at any pH. These estimated K d valu
- Page 305 and 306:
The minimum and maximum K d values
- Page 307 and 308:
ehavior associated with disposal of
- Page 309 and 310:
accompanied by unreacted zeolite. T
- Page 311 and 312:
pH Table J.5. Uranium K d values se
- Page 313 and 314:
pH U Kd (ml/g) Clay Cont. (wt.%) CE
- Page 315 and 316:
pH U Kd (ml/g) Clay Cont. (wt.%) CE
- Page 317 and 318:
pH U Kd (ml/g) 6.90 1,739,87 7 6.90
- Page 319 and 320:
pH U Kd (ml/g) Clay Cont. (wt.%) CE
- Page 321 and 322:
pH U Kd (ml/g) Clay Cont. (wt.%) CE
- Page 323 and 324:
pH U Kd (ml/g) Clay Cont. (wt.%) CE
- Page 325 and 326:
pH U Kd (ml/g) Clay Cont. (wt.%) CE
- Page 327 and 328:
pH U Kd (ml/g) Clay Cont. (wt.%) CE
- Page 329 and 330:
pH U Kd (ml/g) Clay Cont. (wt.%) CE
- Page 331 and 332:
pH U Kd (ml/g) Clay Cont. (wt.%) CE
- Page 333 and 334:
J.6.0 References Ames, L. L., J. E.
- Page 335 and 336:
Erikson, R. L., C. J. Hostetler, R.
- Page 337 and 338:
Lindenmeier, C. W., R. J. Serne, J.
- Page 339 and 340:
Sheppard, M. I., and D. H. Thibault
- Page 341:
Zachara, J. M., C. C. Ainsworth, J.


