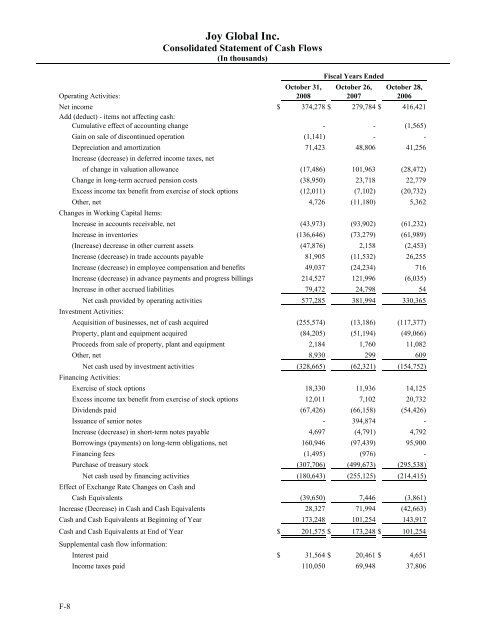
d October 28, 2006 $ 416,421 (1,565) - 41,256 (28,472) 22,779 (20,732) 5,362 (61,232) (61,989) (2,453) 26,255 716 (6,035) 54 330,365 (117,377) (49,066) 11,082 609 (154,752) 14,125 20,732 (54,426) - 4,792 95,900 - (295,538) (214,415) (3,861) (42,663) 143,917 101,254 $ 4,651 37,806 Joy Global Inc. Consolidated Statement of Cash Flows (In thousands) Fiscal Years Ended October 31, October 26, October 28, Operating Activities: 2008 2007 2006 Net in<strong>com</strong>e $ 374,278 $ 279,784 $ 416,421 Add (deduct) - items not affecting cash: Cumulative effect of accounting change - - (1,565) Gain on sale of discontinued operation (1,141) - - Depreciation and amortization 71,423 48,806 41,256 Increase (decrease) in deferred in<strong>com</strong>e taxes, net of change in valuation allowance (17,486) 101,963 (28,472) Change in long-term accrued pension costs (38,950) 23,718 22,779 Excess in<strong>com</strong>e tax benefit from exercise of stock options (12,011) (7,102) (20,732) Other, net 4,726 (11,180) 5,362 Changes in Working Capital Items: Increase in accounts receivable, net (43,973) (93,902) (61,232) Increase in inventories (136,646) (73,279) (61,989) (Increase) decrease in other current assets (47,876) 2,158 (2,453) Increase (decrease) in trade accounts payable 81,905 (11,532) 26,255 Increase (decrease) in employee <strong>com</strong>pensation and benefits 49,037 (24,234) 716 Increase (decrease) in advance payments and progress billings 214,527 121,996 (6,035) Increase in other accrued liabilities 79,472 24,798 54 Net cash provided by operating activities 577,285 381,994 330,365 Investment Activities: Acquisition of businesses, net of cash acquired (255,574) (13,186) (117,377) Property, plant and equipment acquired (84,205) (51,194) (49,066) Proceeds from sale of property, plant and equipment 2,184 1,760 11,082 Other, net 8,930 299 609 Net cash used by investment activities (328,665) (62,321) (154,752) Financing Activities: Exercise of stock options 18,330 11,936 14,125 Excess in<strong>com</strong>e tax benefit from exercise of stock options 12,011 7,102 20,732 Dividends paid (67,426) (66,158) (54,426) Issuance of senior notes - 394,874 - Increase (decrease) in short-term notes payable 4,697 (4,791) 4,792 Borrowings (payments) on long-term obligations, net 160,946 (97,439) 95,900 Financing fees (1,495) (976) - Purchase of treasury stock (307,706) (499,673) (295,538) Net cash used by financing activities (180,643) (255,125) (214,415) Effect of Exchange Rate Changes on Cash and Cash Equivalents (39,650) 7,446 (3,861) Increase (Decrease) in Cash and Cash Equivalents 28,327 71,994 (42,663) Cash and Cash Equivalents at Beginning of Year 173,248 101,254 143,917 Cash and Cash Equivalents at End of Year $ 201,575 $ 173,248 $ 101,254 Supplemental cash flow information: F-8 Interest paid $ 31,564 $ 20,461 $ 4,651 In<strong>com</strong>e taxes paid 110,050 69,948 37,806 F-8
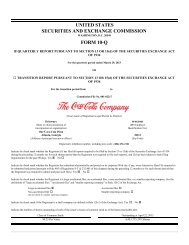
Joy Joy Global Global Inc. Inc. Consolidated Statement Statement of Shareholders’ of Shareholders’ Equity Equity (In thousands, (In thousands, except except per share per share data) data) Common Common Stock Stock Excess Excess of of Accumulated Accumulated Other Other Treasury Treasury Comprehensive Comprehensive Shares Shares Amount Amount Par Value Par Value Earnings Earnings Stock Stock In<strong>com</strong>e In<strong>com</strong>e (Loss) (Loss) Total Total Balance Balance at October at October 29, 2005 29, 2005 Comprehensive Comprehensive in<strong>com</strong>e in<strong>com</strong>e (loss): (loss): 121,769 121,769 $ 121,769 $ 121,769 $ 704,932 $ 704,932 $ 69,766 $ $ 69,766 $ - $ - $ (228,841) (228,841) $ 667,626 $ 667,626 Net in<strong>com</strong>e Net in<strong>com</strong>e - - - - - 416,421 - 416,421 - - - 416,421 - 416,421 Change Change in additional in additional minimum minimum pension pension liability, liability, net of taxes net of taxes - - - - - - - - - - 42,500 42,500 42,500 42,500 Derivative Derivative instrument instrument fair market fair value market adjustment, value adjustment, net of taxes net of taxes - - - - - - - - - - 2,095 2,095 2,095 2,095 Currency Currency translation translation adjustment adjustment - - - - - - - - - - (3,061) (3,061) (3,061) (3,061) Total <strong>com</strong>prehensive Total <strong>com</strong>prehensive in<strong>com</strong>e in<strong>com</strong>e 457,955 457,955 Treasury Treasury stock purchased stock purchased - - - - - - - (295,538) - (295,538) - (295,538) - (295,538) Stock based Stock <strong>com</strong>pensation based <strong>com</strong>pensation expense expense and other and other (2) (2) (2) (2) 9,387 9,387 - - - - - - 9,385 9,385 Cumulative Cumulative effect of effect accounting of accounting change change - - - - 2,255 2,255 - - - - - - 2,255 2,255 Deferred Deferred tax adjustment tax adjustment - - - -82,806 82,806 - - - - - -82,806 82,806 Dividends Dividends ($ 0.45 ($ per 0.45 share) per share) - - - - 451 451 (54,877) (54,877) - - - (54,426) - (54,426) Issuance Issuance of performance of performance units units 191 191 191 191 14,882 14,882 - - - - - -15,073 15,073 Exercise Exercise of stock of options stock options 1,731 1,731 1,731 1,731 12,394 12,394 - - - - - -14,125 14,125 Tax benefit Tax from benefit exercise from exercise of stock of options stock options - - - -20,368 20,368 - - - - - -20,368 20,368 Balance Balance at October at October 28, 2006 28, 2006 Comprehensive Comprehensive in<strong>com</strong>e: in<strong>com</strong>e: 123,689 123,689 $ 123,689 $ 123,689 $ 847,475 $ 847,475 $ 431,310 $ 431,310 $ (295,538) $ (295,538) $ $ (187,307) (187,307) $ 919,629 $ 919,629 Net in<strong>com</strong>e Net in<strong>com</strong>e - - - - - 279,784 - 279,784 - - - 279,784 - 279,784 Change Change in additional in additional minimum minimum pension pension liability, liability, net of taxes net of taxes - - - - - - - - - - 163,975 163,975 163,975 163,975 Derivative Derivative instrument instrument fair market fair value market adjustment, value adjustment, net of taxes net of taxes - - - - - - - - - - 2,285 2,285 2,285 2,285 Currency Currency translation translation adjustment adjustment - - - - - - - - - - 43,781 43,781 43,781 43,781 Total <strong>com</strong>prehensive Total <strong>com</strong>prehensive in<strong>com</strong>e in<strong>com</strong>e 489,825 489,825 Impact of Impact FAS of No. FAS 158 No. adoption, 158 adoption, net of taxes net of taxes - - - - - - - - - - (136,381) (136,381) (136,381) (136,381) Treasury Treasury stock purchased stock purchased - - - - - - - (499,673) - (499,673) - (499,673) - (499,673) Stock based Stock <strong>com</strong>pensation based <strong>com</strong>pensation expense expense - - - -10,647 10,647 - - - - - -10,647 10,647 Deferred Deferred tax adjustment tax adjustment - - - - 513 513 - - - - - - 513 513 Dividends Dividends ($ 0.60 ($ per 0.60 share) per share) - - - - 522 522 (66,680) (66,680) - - - (66,158) - (66,158) Issuance Issuance of performance of performance units, deferred units, deferred performance performance units and units and restricted restricted stock stock 441 441 441 441 (13,977) (13,977) - - - - - (13,536) - (13,536) Exercise Exercise of stock of options stock options 776 776 776 77611,160 11,160 - - - - - -11,936 11,936 Tax benefit Tax from benefit exercise from exercise of stock of options stock options - - - - 7,192 7,192 - - - - - - 7,192 7,192 Balance Balance at October at October 26, 2007 26, 2007 124,906 124,906 $ 124,906 $ 124,906 $ 863,532 $ 863,532 $ 644,414 $ 644,414 $ (795,211) $ (795,211) $ $ (113,647) (113,647) $ 723,994 $ 723,994 Comprehensive Comprehensive in<strong>com</strong>e in<strong>com</strong>e (loss): (loss): Net in<strong>com</strong>e Net in<strong>com</strong>e - - - - - 374,278 - 374,278 - - 374,278 374,278 Change Change in pension in pension liability, liability, net of taxes net of taxes - - - - - - - - - - (87,859) (87,859) (87,859) (87,859) Derivative Derivative instrument instrument fair market fair value market adjustment, value adjustment, net of taxes net of taxes - - - - - - - - - - (23,454) (23,454) (23,454) (23,454) Currency Currency translation translation adjustment adjustment - - - - - - - - - - (120,960) (120,960) (120,960) (120,960) Total <strong>com</strong>prehensive Total <strong>com</strong>prehensive in<strong>com</strong>e in<strong>com</strong>e 142,005 142,005 Treasury Treasury stock purchased stock purchased - - - - - - - (307,706) - (307,706) (307,706) (307,706) Stock based Stock <strong>com</strong>pensation based <strong>com</strong>pensation expense expense - - - -13,738 13,738 - - - - - -13,738 13,738 Dividends Dividends ($ 0.625 ($ per 0.625 share) per share) - - - - 356 356 (67,782) (67,782) - - - (67,426) - (67,426) Issuance Issuance of performance of performance units, deferred units, deferred performance performance units and units and restricted restricted stock stock 202 202 202 202 (2,463) (2,463) - - - - - - (2,261) (2,261) Exercise Exercise of stock of options stock options 864 864 864 86417,468 17,468 - - - - - -18,332 18,332 Tax benefit Tax from benefit exercise from exercise of stock of options stock options - - - -12,011 12,011 - - - - - -12,011 12,011 Impact of Impact FIN 48 of FIN adoption 48 adoption - - - - - - (213) (213) - - - - (213) (213) Balance Balance at October at October 31, 2008 31, 2008 125,972 125,972 $ 125,972 $ 125,972 $ 904,642 $ 904,642 $ 950,697 $ 950,697 $ (1,102,917) $ (1,102,917) $ $ (345,920) (345,920) $ 532,474 $ 532,474 F-9 F-9