Operational Evaluation for Evolutionary Sonars - Johns Hopkins ...
Operational Evaluation for Evolutionary Sonars - Johns Hopkins ...
Operational Evaluation for Evolutionary Sonars - Johns Hopkins ...

You also want an ePaper? Increase the reach of your titles
YUMPU automatically turns print PDFs into web optimized ePapers that Google loves.
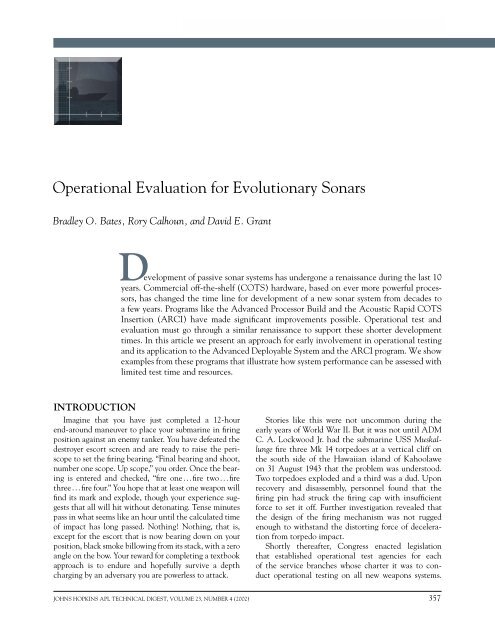
OPERATIONAL EVALUATION FOR EVOLUTIONARY SONARS<br />
<strong>Operational</strong> <strong>Evaluation</strong> <strong>for</strong> <strong>Evolutionary</strong> <strong>Sonars</strong><br />
Bradley O. Bates, Rory Calhoun, and David E. Grant<br />
Development of passive sonar systems has undergone a renaissance during the last 10<br />
years. Commercial off-the-shelf (COTS) hardware, based on ever more powerful processors,<br />
has changed the time line <strong>for</strong> development of a new sonar system from decades to<br />
a few years. Programs like the Advanced Processor Build and the Acoustic Rapid COTS<br />
Insertion (ARCI) have made signifi cant improvements possible. <strong>Operational</strong> test and<br />
evaluation must go through a similar renaissance to support these shorter development<br />
times. In this article we present an approach <strong>for</strong> early involvement in operational testing<br />
and its application to the Advanced Deployable System and the ARCI program. We show<br />
examples from these programs that illustrate how system per<strong>for</strong>mance can be assessed with<br />
limited test time and resources.<br />
INTRODUCTION<br />
Imagine that you have just completed a 12-hour<br />
end-around maneuver to place your submarine in fi ring<br />
position against an enemy tanker. You have defeated the<br />
destroyer escort screen and are ready to raise the periscope<br />
to set the fi ring bearing. “Final bearing and shoot,<br />
number one scope. Up scope,” you order. Once the bearing<br />
is entered and checked, “fi re one . . . fi re two . . . fi re<br />
three . . . fi re four.” You hope that at least one weapon will<br />
fi nd it s m a rk and explode, though your experience suggests<br />
that all will hit without detonating. Tense minutes<br />
pass in what seems like an hour until the calculated time<br />
of impact has long passed. Nothing! Nothing, that is,<br />
except <strong>for</strong> the escort that is now bearing down on your<br />
position, black smoke billowing from its stack, with a zero<br />
angle on the bow. Your reward <strong>for</strong> completing a textbook<br />
approach is to endure and hopefully survive a depth<br />
charging by an adversary you are powerless to attack.<br />
Stories like this were not uncommon during the<br />
early years of World War II. But it was not until ADM<br />
C. A. Lockwood Jr. had the submarine USS Muskallunge<br />
fi re t h ree Mk 14 torpedoes at a vertical cliff on<br />
the south side of the Hawaiian island of Kahoolawe<br />
on 31 August 1943 that the problem was understood.<br />
Two torpedoes exploded and a third was a dud. Upon<br />
recovery and disassembly, personnel found that the<br />
fi r i ng pi n h ad struck the fi ring cap with insuffi cient<br />
<strong>for</strong>ce to set it off. Further investigation revealed that<br />
the design of the fi ring mechanism was not rugged<br />
enough to withstand the distorting <strong>for</strong>ce of deceleration<br />
from torpedo impact.<br />
Shortly thereafter, Congress enacted legislation<br />
that established operational test agencies <strong>for</strong> each<br />
of the service branches whose charter it was to conduct<br />
operational testing on all new weapons systems.<br />
JOHNS HOPKINS APL TECHNICAL DIGEST, VOLUME 23, NUMBER 4 (2002) 357
B. O. BATES, R. CALHOUN, AND D. E. GRANT<br />
These agencies were tasked to evaluate the operational<br />
effectiveness and suitability of the systems being developed<br />
<strong>for</strong> use by operational <strong>for</strong>ces in harm’s way.<br />
For many years, operational testing followed the lead<br />
of those early testing pioneers and focused on evaluating<br />
the per<strong>for</strong>mance of an end product once it was<br />
turned over by the developer. As one would imagine,<br />
this arrangement led to animosity between the developer<br />
and tester, created schedule and fi nancial problems<br />
when tests went poorly, provided operational feedback<br />
to the developer only after it was much too late to<br />
economically implement lessons learned, and heavily<br />
tasked operational <strong>for</strong>ces to provide manpower and test<br />
assets to support the “graduation exercise.”<br />
By 1996, a new challenge to sonar system operational<br />
testing had emerged. Ef<strong>for</strong>ts to regain and then maintain<br />
submarine acoustic superiority resulted in the development<br />
of an acquisition program known as Acoustic Rapid<br />
Commercial Off-the-Shelf (COTS) Insertion (ARCI).<br />
Under this initiative, technology insertions would be<br />
made to submarine sonar systems on a rapid, periodic<br />
basis (every 1 to 2 years) to ensure hardware currency,<br />
software capability would be updated rapidly (through an<br />
initiative known as the Advanced Processor Build [APB]<br />
program), logistics costs would be effectively contained,<br />
and almost immediate per<strong>for</strong>mance improvements would<br />
be realized. The goal was to complete a four-step process<br />
to fi nal confi guration in about 3 years (as opposed to the<br />
conventional acquisition time lines that exceeded 10<br />
years from inception to completion).<br />
The ARCI program was one of the fi rst large-scale<br />
ef<strong>for</strong>ts designed to take advantage of new acquisition<br />
directives that encouraged execution of evolutionary<br />
acquisition strategies. It was up to the sponsor, developer,<br />
Navy type commanders, and operational test<br />
agency to devise a relationship and strategy that would<br />
meet the needs of all the stakeholders.<br />
<strong>Operational</strong> evaluation assesses the effectiveness and<br />
suitability of a system to support a decision <strong>for</strong> readiness<br />
<strong>for</strong> Fleet introduction. The traditional approach to operational<br />
testing involves a test team that is introduced to<br />
the program shortly be<strong>for</strong>e the test and then observes<br />
the system in operation. Generally, the test team’s<br />
assessment is interpreted as a go/no-go decision and<br />
there is little insight into why a certain per<strong>for</strong>mance is<br />
observed. Limited test time and test assets exacerbate<br />
this shortcoming to operational testing. The observed<br />
per<strong>for</strong>mance <strong>for</strong> the limited test may not represent the<br />
true capability. Currently, the Navy is exploring ways to<br />
improve the test strategy by early involvement in program<br />
development and by including Navy and University<br />
Affi liated Research Center laboratories and systems<br />
developers, in a limited way, in the evaluation team.<br />
This approach helps the evaluation team to develop a<br />
better understanding of program goals, helps the development<br />
team stay current with program needs, ensures<br />
that the test team will retain objectivity, and fosters<br />
trust between the evaluation and development teams.<br />
In this article we address the evolving roles in system<br />
analysis, the advantages of acoustic post-analysis, and<br />
the way beam noise collected during operational test is<br />
used to determine the detection footprint of the sensor<br />
under test.<br />
TESTING PHILOSOPHY<br />
Historically, government test agencies were seen<br />
as organizations that conducted pass/fail testing of a<br />
system’s ability to function effectively and suitably in<br />
an operational environment; the command did not<br />
participate in a program until the engineering development<br />
model was completed and ready <strong>for</strong> technical<br />
evaluation by the government sponsor. However, other<br />
responsibilities were subsequently added that tasked<br />
the testers to become involved in a program early<br />
enough to assess (1) potential operational effectiveness<br />
and suitability of a system and make recommendations<br />
regarding programmatic decisions other than<br />
Fleet introduction, and (2) operational effectiveness<br />
and suitability regarding Fleet introduction decisions.<br />
Given the nature of the evolutionary development<br />
of the build-test-build model used today by both the<br />
submarine and surface combatant communities, government<br />
test team involvement must not only begin<br />
earlier, but must also be continuous in order <strong>for</strong> the<br />
command to contribute meaningful and timely analytical<br />
feedback regarding operational suitability.<br />
A sponsor’s development team comprises personnel<br />
from multiple government agencies and supporting laboratories<br />
who have the required level of technical understanding.<br />
The active duty members of the test team are<br />
drawn from <strong>Operational</strong> Test Directors (OTDs) and<br />
their support staff, who serve on a 2- to 3-year rotation<br />
basis. These active duty participants may lack the <strong>for</strong>mal<br />
education required to understand the complexity of the<br />
complete sonar system undergoing evaluation. However,<br />
they bring military experience that is valuable in providing<br />
a clear picture of current Fleet operations and future<br />
operation needs. Through early involvement in the<br />
process, the government test agency takes advantage of<br />
the other participants’ understanding of the system and<br />
develops relationships with team members. This enables<br />
the command to select timely and credible input sources<br />
<strong>for</strong> reports on operational suitability.<br />
Because an OTD works with multiple programs, he<br />
or she can provide invaluable insight from experiences<br />
with those other programs. The OTD can also give the<br />
program offi ce a unique perspective on how the particular<br />
system could benefi t from achievements or problems<br />
in other systems. This broader perspective helps prevent<br />
connectivity and interoperability issues at an early stage<br />
so that cost-effective corrective action can be taken.<br />
358 JOHNS HOPKINS APL TECHNICAL DIGEST, VOLUME 23, NUMBER 4 (2002)
Government test agency participation in test and<br />
evaluation integrated product teams and associated<br />
working groups helps facilitate the evolution of the<br />
program testing strategy. Together, the government test<br />
agency and the program offi ce can identify particular<br />
data so that plans can be designed to collect them and<br />
software can be adjusted to ensure that the in<strong>for</strong>mation<br />
is readily obtainable. Close involvement of the government<br />
test agency with the program offi ce also ensures<br />
that the test philosophy evolves effi ciently as the program<br />
evolves. The synergy that develops from this working<br />
relationship leads directly to economies from shared<br />
data, shared test assets, and shared analysis ef<strong>for</strong>ts.<br />
Involvement of the government test agency must add<br />
value to the program offi ce endeavor to develop the<br />
system. This “value added” is most readily observed in<br />
terms of direct technical feedback; assistance with <strong>Operational</strong><br />
Requirements Document (ORD) and Test and<br />
<strong>Evaluation</strong> Master Plan development and revision; interfacing<br />
with the end user; and participating on one or more<br />
technical teams. As a result of this participation, the OTD<br />
learns what the program needs in terms of products from<br />
the government test agency, keeps the program abreast of<br />
tester concerns with respect to operational effectiveness<br />
and suitability issues, and resolves testing concerns be<strong>for</strong>e<br />
they become real problems. The OTD can also provide<br />
the program offi ce with independent thought to help<br />
solve technical and programmatic problems.<br />
Decisions concerning operational effectiveness and<br />
operational suitability in earlier testing relied largely on<br />
comparing tabulated test data to system per<strong>for</strong>mance<br />
requirements. However, it was not always apparent that<br />
a suffi cient sample size was obtained to make statistically<br />
supported pass/fail decisions. Limitations to operational<br />
test times highlighted a previously obscured issue, i.e.,<br />
statistical signifi cance in test data.<br />
A new initiative grew from this realization. It was<br />
obvious that suffi cient test time to obtain statistically<br />
signifi cant data <strong>for</strong> evaluation of per<strong>for</strong>mance parameters<br />
(e.g., search rate, detection range, etc.) directly<br />
related to the goal of reaching and maintaining acoustic<br />
superiority would never be achieved. Two alternatives<br />
were investigated to supplement direct test results:<br />
(1) use a statistical sampling methodology known as<br />
“bootstrapping,” or (2) test <strong>for</strong> understanding by recording<br />
defi ning environmental, target, and test plat<strong>for</strong>m<br />
parameters, then analyze those data in an acoustic<br />
laboratory once the test was completed to look <strong>for</strong> reasons<br />
that would explain observed system behavior. The<br />
second alternative was chosen since it was deemed to<br />
require fewer at-sea hours than the bootstrap method<br />
and because the test-<strong>for</strong>-understanding methodology<br />
could directly support system improvements since direct<br />
causes <strong>for</strong> successes and failures could be identifi ed.<br />
To minimize the cost of the test-<strong>for</strong>-understanding<br />
approach, analysis ef<strong>for</strong>ts were teamed with the acoustic<br />
OPERATIONAL EVALUATION FOR EVOLUTIONARY SONARS<br />
analysis programs at APL. The Environmental Sciences<br />
Division at the University of Texas Applied Research<br />
Laboratory provided acoustic per<strong>for</strong>mance modeling<br />
and acoustic environment analysis support in this ef<strong>for</strong>t.<br />
NAVSEA Keyport Division and its Lua Lua Lei Detachment<br />
in Pearl Harbor, Hawaii, provided operational<br />
test support. To date this team has provided invaluable<br />
feedback to the ARCI and APB development ef<strong>for</strong>ts,<br />
effectively supported <strong>for</strong>mal ARCI operational testing,<br />
and given COMSUBLANT and COMSUBPAC crucial<br />
operational insight into expected system per<strong>for</strong>mance<br />
aboard their submarines.<br />
ANALYSIS OF ACOUSTIC<br />
PERFORMANCE<br />
As previously noted, the purpose of operational<br />
testing is to ensure that the system under test meets or<br />
exceeds the per<strong>for</strong>mance parameters stated in the ORD.<br />
In evaluating an evolutionary system it is also necessary<br />
to identify the possible points of failure such as system<br />
response, system operability, operator training, operator<br />
per<strong>for</strong>mance, and environmental conditions during the<br />
conduct of the test. Correct feedback of the point of failure<br />
to the Navy Program Manager and Pentagon acquisition<br />
sponsor allows timely decision making regarding<br />
the future program direction. Should money be invested<br />
to improve the hardware, software, or logistical support?<br />
Which investment will result in the greatest increase in<br />
system per<strong>for</strong>mance?<br />
The best method to verify sonar system per<strong>for</strong>mance<br />
is by establishing ground truth through acoustic postanalysis.<br />
Experienced acoustic analysts with system test<br />
experience should conduct acoustic reconstruction. This<br />
analysis must be per<strong>for</strong>med on the system under test or<br />
an exact equivalent. Beam noise from the sonar system<br />
being tested must be collected to support “footprint”<br />
analysis. (The footprint is the irregularly shaped area<br />
around a sensor where detection is possible.) An investment<br />
by the government program manager is required to<br />
establish a system testbed and to allow the test agency to<br />
contract with the necessary acoustic analysis and signal<br />
processor experts to complete the analysis. The system<br />
testbed must be able to host the system under evaluation<br />
and must undergo technical refresh to keep pace<br />
with system development. It must also be identifi ed as a<br />
priority <strong>for</strong> the prime system integrator to ensure timely<br />
completion of acoustic analysis.<br />
Ground Truth Through Post-Exercise<br />
Acoustic Analysis<br />
Establishment of ground truth using post-exercise<br />
acoustic analysis does not replace the use of physical<br />
reconstruction, but rather uses the physical reconstruction<br />
as a starting point. Attempting to do post-exercise<br />
acoustic analysis without reconstruction would leave<br />
the analyst with many of the same problems inherent<br />
JOHNS HOPKINS APL TECHNICAL DIGEST, VOLUME 23, NUMBER 4 (2002) 359
B. O. BATES, R. CALHOUN, AND D. E. GRANT<br />
with relying on real-time contact detections as absolute<br />
truth. Post-analysis allows the analyst to take advantage<br />
of knowing where in azimuth and range the exercise<br />
contact is and identifi es contact behaviors such as<br />
speed, depth, and propulsion mode changes, which help<br />
to verify that the sources detected are, in fact, from the<br />
exercise contact and not from interfering contacts.<br />
First pass analysis is conducted using the sonar system<br />
under evaluation in the most sensitive lineup. This<br />
lineup may not be feasible <strong>for</strong> real-time search because<br />
of display overload, but it takes advantage of high-resolution<br />
verniers and optimum update rates. This pass will<br />
be used to establish what sources from the contact of<br />
interest are detectable on any of the system displays at<br />
an operationally signifi cant range and will answer the<br />
most basic question: Can we detect the contact with<br />
our current array and processing technology? Because<br />
the lineup used <strong>for</strong> fi r st pa s s a n a lysi s is not necessarily<br />
feasible <strong>for</strong> real-time search, only a cursory comparison<br />
is made between the post-analysis results and real-time<br />
operator detections.<br />
Second pass analysis is per<strong>for</strong>med with the system<br />
confi gured in accordance with current operational<br />
guidance. If such guidance has not been <strong>for</strong>malized,<br />
the second pass is made with the system confi gured in<br />
accordance with the evaluation plat<strong>for</strong>m’s search plan.<br />
The primary objective of second pass analysis is to<br />
determine if the contact of interest is detectable on the<br />
system search displays when the system is operated in<br />
accordance with current operational guidance. System<br />
per<strong>for</strong>mance during second pass analysis and real-time<br />
operator detections are compared to determine if current<br />
operational guidance helps the operator detect the<br />
contact of interest. <strong>Operational</strong> test personnel observations<br />
address issues such as whether the search plan was<br />
generated using the current guidance, and whether the<br />
search plan was adhered to during the evaluation.<br />
When post-analysis shows that contact sources—<br />
available to the operator when the system under evaluation<br />
was operated in accordance with available operational<br />
guidance—were not detected in real time, it is<br />
necessary to look at operator training. These questions<br />
must be asked: Did the operators receive training in<br />
the proper operation of the system? Were the operators<br />
familiar with the test contact acoustic vulnerabilities?<br />
Did the search plan support contact detection? Observations<br />
by the embarked test team can provide valuable<br />
feedback to Navy training commands and commands<br />
tasked with developing operational guidance. The<br />
embarked test team also makes observations regarding<br />
watch stander discipline, operator alertness, and watch<br />
station communications.<br />
<strong>Operational</strong> <strong>Evaluation</strong> Data Sets<br />
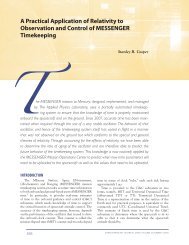
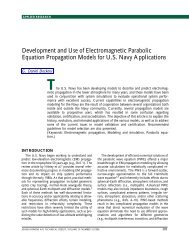
Sonar per<strong>for</strong>mance is evaluated using many measures<br />
of effectiveness including probability of detection<br />
(P d ), probability of false alarm (P fa ), and total holding<br />
time (H t ). H t is calculated by measuring the difference<br />
between the time of initial contact detection and the<br />
time of contact fade or loss using any source radiating<br />
from the exercise contact. Figure 1 illustrates the difference<br />
in H t , <strong>for</strong> four recent sonar evaluations, between<br />
maximum system per<strong>for</strong>mance as measured during<br />
post-analysis and system per<strong>for</strong>mance during real-time<br />
operations. H t is shown as a percentage of contact availability<br />
as defi ned by the exercise contact physically contained<br />
in the exercise area.<br />
If H t was used to evaluate the system under test in<br />
Fig. 1, only Test 2/Contact 2 and Test 4/Contact 1 would<br />
provide a relatively accurate measure of system per<strong>for</strong>mance.<br />
For the other test and contact combinations,<br />
the error is suffi cient to push system per<strong>for</strong>mance outside<br />
the key per<strong>for</strong>mance parameter (KPP) specifi ed in<br />
the ORD. Failure of a system to meet a KPP could result<br />
in that system being determined as not operationally<br />
suitable and there<strong>for</strong>e unlikely to be introduced into the<br />
Fleet; the funding and time invested in system development<br />
would be wasted. Post-analysis may show that the<br />
system under evaluation does, in fact, meet the KPP as<br />
specifi ed in the ORD and that further evaluation of the<br />
system is warranted.<br />
For all four of the systems evaluated through<br />
post-analysis, the primary reason <strong>for</strong> poor real-time<br />
per<strong>for</strong>mance was determined to be operator training<br />
and contact familiarization. In Test 1, Contact 1 had<br />
a malfunctioning noise augmentation unit; there<strong>for</strong>e,<br />
the radiated sources were off in frequency by a difference<br />
large enough to cause the operator to dismiss the<br />
contact as an interferer. In Tests 2 and 3, Contact 1 was<br />
undetected by the watch team and, though post-analysis<br />
was unable to determine a defi nite cause, contact recognition<br />
and an incomplete search plan were believed to<br />
be the likely points of failure. In Test 4, the watch team<br />
was unfamiliar with the exercise contact and dismissed<br />
or downgraded hours of valid contact holding.<br />
360 JOHNS HOPKINS APL TECHNICAL DIGEST, VOLUME 23, NUMBER 4 (2002)<br />
Percentage of predicted contact availability<br />
100<br />
90<br />
80<br />
70<br />
60<br />
50<br />
40<br />
30<br />
20<br />
10<br />
0<br />
T1/C1 T1/C2 T2/C1 T2/C2 T3/C1 T4/C1 T4/C2<br />
Figure 1. Total holding in real time (green) versus post-analysis<br />
(orange) (T = test, C = contact).
UNDERSTANDING SYSTEM<br />
PERFORMANCE THROUGH<br />
FOOTPRINT ANALYSIS<br />
The ultimate test of a new or improved sonar system<br />
is the measurement of acoustic per<strong>for</strong>mance. Examples<br />
include sensor detection range, towed array sweep rate,<br />
and, <strong>for</strong> a distributed surveillance fi eld, the probability<br />
of detecting a target within a certain time window. A<br />
direct measurement of detection range might involve<br />
closing and opening the range between a target and<br />
receiver and noting the ranges at which the operator<br />
gains and loses the target. In a distributed fi eld, one may<br />
count the number of times or how often an operator<br />
detects a target within a given time period.<br />
Time allotted <strong>for</strong> testing is often limited so that<br />
observations from such tests yield a small sample set.<br />
Various statistical gymnastic operations can be applied,<br />
including the so-called bootstrap methods; however, a<br />
small sample set cannot provide in<strong>for</strong>mation that does<br />
not exist, and the uncertainty in estimation due to statistical<br />
sampling cannot be reduced. Further, by basing<br />
per<strong>for</strong>mance on observations of operator detections<br />
and losses, the evaluation team loses any insight into<br />
whether the per<strong>for</strong>mance is infl uenced by environmental<br />
conditions.<br />
Defi ning the Sensor Detection Footprint<br />
The sensor detection footprint is the locus of points<br />
within the fi gure-of-merit (FOM) detection range of the<br />
sensor. It is similar to the FOM detection range but differs<br />
in that the variability in bearing of the noise and<br />
transmission loss is considered so that the footprint is<br />
a function of bearing. Because the footprint also takes<br />
temporal variations in the environment into account,<br />
it is also a function of time. One can think of the footprint<br />
as a graph, in polar coordinates, of detection range<br />
(radial coordinate) versus bearing (angle coordinate).<br />
Estimating Footprints<br />
A combination of models and real data is used in<br />
estimating the footprint. The footprint boundary solves<br />
the sonar equation<br />
0 = SL TL() SG BN(, t) RD ,<br />
where<br />
SL = target source level,<br />
TL() = acoustic transmission loss from the target<br />
to the sensor,<br />
SG = sonar signal gain,<br />
BN(, t) = sonar beam noise, and<br />
RD = sonar recognition differential.<br />
Each term above is estimated by data or modeling.<br />
Measured data are used whenever possible; when not<br />
OPERATIONAL EVALUATION FOR EVOLUTIONARY SONARS<br />
available, Navy standard models are used. When possible,<br />
measurements of the target source level are obtained<br />
during the test and those values are used, especially <strong>for</strong><br />
footprint validation (see the next section.) Once the<br />
footprint has been validated, other source levels can be<br />
used to assess how well the sonar will work against targets<br />
that are quieter or louder than the test target.<br />
Transmission loss (TL) measurements can be made<br />
but are generally not part of an operational test. In some<br />
cases, a technical evaluation of the sonar in the same<br />
area that includes TL measurements may have already<br />
been done. If available, measured TL data are used; otherwise<br />
Navy standard models and databases are used to<br />
estimate TL.<br />
Another key part of the footprint calculation is the<br />
measured beam noise at the output of the sonar beam<strong>for</strong>mer.<br />
This is a unique part of the footprint estimate<br />
and differs from the standard approach of measuring<br />
the ambient noise and applying the theoretical array<br />
gain. The beam noise is the noise through which the<br />
target must be detected. It has all of the azimuthal and<br />
temporal variations of the ambient noise and clutter.<br />
It does not require any guesswork about the ambient<br />
noise directionality or how the beam<strong>for</strong>mer (in the<br />
case of adaptive beam<strong>for</strong>ming) interacts with the<br />
environment.<br />
Several values can be used <strong>for</strong> the sonar recognition<br />
differential (RD). These values are generally accepted<br />
within the submarine towed array and surveillance communities<br />
<strong>for</strong> various kinds of signals and signal processing<br />
and represent the RD of an alerted sonar operator.<br />
During footprint validation, adjustments to the value<br />
of the RD are made to more accurately represent what<br />
the operators did during the test. RD can also be set to<br />
represent the best possible RD with the sonar system,<br />
regardless of how good the operator is at recognizing the<br />
signal on the sonar display.<br />
Validating Footprints<br />
Special care is taken to ensure that the calculated<br />
footprints are accurate representations of the areas in<br />
which detection occurs. This is accomplished using controlled<br />
test runs to reduce uncertainty in the terms in<br />
the sonar equation. Verifi cation is made that the sonar<br />
gains the target at the same time it enters the footprint<br />
and that the sonar loses the target at the same time it<br />
exits the footprint. Keep in mind that the footprint is<br />
not used to make detections; it is simply a representation<br />
of sonar per<strong>for</strong>mance.<br />
Once the accuracy of the footprints is verifi ed, they<br />
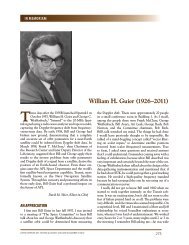
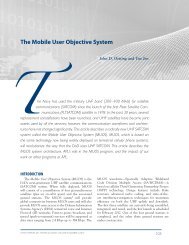
can be used <strong>for</strong> further analysis. Figure 2 shows a qualitative<br />
comparison of the acoustic FOM footprints with<br />
sonar per<strong>for</strong>mance. The bearing versus time display on<br />
the left is similar to those commonly used on many sonar<br />
systems. The test target becomes visible at about minute<br />
40 and is the trace that moves from left to right during<br />
JOHNS HOPKINS APL TECHNICAL DIGEST, VOLUME 23, NUMBER 4 (2002) 361
B. O. BATES, R. CALHOUN, AND D. E. GRANT<br />
Bearing<br />
the last 20 minutes of the test time. The right side of the<br />
fi gure shows the footprint computed at different times<br />
during the test run. The red outline is the footprint, i.e.,<br />
a plot of FOM range versus bearing. It varies with time<br />
because the ambient noise directionality, and hence the<br />
beam noise, varies. The blue dot indicates the position<br />
of the target (from navigation reconstruction) relative<br />
to the sonar receiver. Note that when the target is visible<br />
on the sonar display, it is inside the footprint. This<br />
comparison is a good qualitative verifi cation that the<br />
footprints accurately represent sonar per<strong>for</strong>mance.<br />
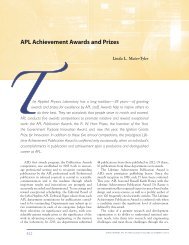
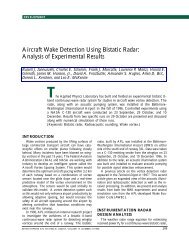
A quantitative verifi cation can be done by computing<br />
the signal excess (SE) as follows:<br />
SE = SL TL() SG BN(, t) RD .<br />
Figure 3 shows a comparison of the signal excess with<br />
a bearing versus time display that is similar to what a<br />
sonar operator uses. The signal excess was computed<br />
post-analysis using the source level <strong>for</strong> the target test<br />
ship and, at each time slice, using noise from the beam<br />
that points along the sensor to the target bearing as well<br />
as the TL (from a model) that was computed along the<br />
sensor-to-target bearing. This bearing was determined<br />
0<br />
10<br />
20<br />
30<br />
40<br />
50<br />
60<br />
Figure 2. Example comparison of footprints (right) with a sonar display (left).<br />
Time<br />
Minute 25<br />
Minute 40<br />
Minute 45<br />
Minute 54<br />
from navigation reconstruction and<br />
changes as a function of time.<br />
At the beginning of the test run<br />
in Fig. 3 (bottom of the plots), the<br />
test ship is not observable on the<br />
sonar display (left), and the computed<br />
signal excess is a negative<br />
number. Just prior to minute 30, the<br />
test ship is barely observable on the<br />
sonar display, and the signal excess<br />
crosses over from negative to positive.<br />
In the latter part of the test run,<br />
the target is clearly visible and the<br />
signal excess is high. This quantitative<br />
comparison provides verifi cation<br />
that terms in the sonar equation are<br />
correctly accounted <strong>for</strong>. Reliable<br />
footprints can be computed with the<br />
sonar equation by setting SE = 0.<br />
In the examples shown in Figs.<br />
2 and 3, agreement between target<br />
holding predicted by the footprint<br />
calculation and holding on the<br />
display is verifi ed. The RD may be<br />
adjusted to cause this agreement<br />
(assuming there are no biases in<br />
other parts of the equation), and<br />
then that RD can be used to assess<br />
how well the sonar system works at<br />
making targets visible to the opera-<br />
tor. This is called the system RD.<br />
During testing, the operator logs when he gained and<br />
lost the test ship and adjustments can be made to the<br />
RD accordingly. This is the operator RD.<br />
The operator RD and system RD differ in that various<br />
factors can cause the operator RD to be higher (worse)<br />
than the system RD. These factors include operator<br />
training, alertness, fatigue, and whether the operator<br />
was actually looking at the display when the target fi rst<br />
appeared. Having the two RD values allows us to use<br />
footprint calculations to assess the per<strong>for</strong>mance of the<br />
machine (sensor, signal processing, and displays) only,<br />
versus the machine and operator combination.<br />
APPLICATION TO FIELDS<br />
AND TOWED ARRAYS<br />
Sonar testing usually involves several days at sea,<br />
but a test target plat<strong>for</strong>m (with known source levels)<br />
is involved on only a few of those days. The footprints<br />
are validated with the test target plat<strong>for</strong>m. Footprints<br />
from the entire sea test, using beam noise data from the<br />
test, can then be used to assess the variation in the per<strong>for</strong>mance<br />
of the system over several days. This cannot<br />
be done within the limited time that a test target<br />
is available.<br />
362 JOHNS HOPKINS APL TECHNICAL DIGEST, VOLUME 23, NUMBER 4 (2002)
Time relative to start (min)<br />
60<br />
50<br />
40<br />
30<br />
20<br />
10<br />
0<br />
Bearing<br />
0 <br />
The Advanced Deployable System (ADS) is a<br />
distributed fi eld of arrays currently being developed<br />
by SPAWAR PMW-183 to assess per<strong>for</strong>mance using<br />
a build-test-build methodology. During a recent test<br />
of an ADS fi eld, beam noise data were collected from<br />
all arrays over a period of several weeks. In addition,<br />
towed sources were used to measure transmission loss<br />
around several of the arrays. The measured TL was<br />
compared with modeled TL (using a Navy standard<br />
model and databases) to validate the model. The<br />
model was used to make a complete map of the TL<br />
around each array.<br />
Several target plat<strong>for</strong>ms were available, and special<br />
runs were designed to measure their source levels. The<br />
targets then operated under normal conditions in freeplay<br />
mode, and target gains and losses were recorded.<br />
The footprints were computed <strong>for</strong> the free-play times,<br />
and the RD used in the calculations was adjusted so<br />
that the footprint gain and loss times matched the<br />
operator gain and loss times. This gave us the operator<br />
RD. In post-test analysis, the RD was adjusted so that<br />
the footprint gain and loss times matched the gain and<br />
loss times on the sonar displays. This gave us the system<br />
RD. Then the source level in the footprint calculations<br />
was changed to the source level specifi ed in the<br />
ADS ORD. This enabled generation of the expected<br />
detection capability against the ADS ORD target in<br />
the region without an actual ORD target. Beam noise<br />
from several weeks of test time was utilized to assess<br />
Signal excess<br />
Figure 3. Example comparison of the signal excess (right) with a sonar display (left).<br />
OPERATIONAL EVALUATION FOR EVOLUTIONARY SONARS<br />
how the ADS would per<strong>for</strong>m over<br />
a long period.<br />
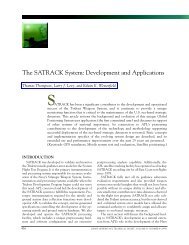
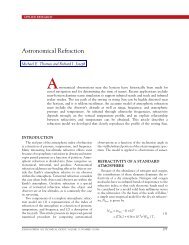
A sample time slice of the<br />
footprints is shown in Fig. 4. Also<br />
shown are two of the test plat<strong>for</strong>ms<br />
and their tracks from the previous<br />
few minutes. This was done in posttest<br />
analysis with the reconstructed<br />
navigation. When this sample was<br />
taken, 14 arrays were operating.<br />
Only 12 footprints can be observed.<br />
Two of the arrays had very high<br />
ambient noise levels (due to nearby<br />
ships) and were not making detections.<br />
Other arrays had quiet<br />
ambient noise levels and very large<br />
footprints, sometimes overlapping<br />
footprints from other arrays. This<br />
picture changes rapidly in littoral<br />
environments and can often be<br />
completely different within an hour,<br />
with loud areas becoming quiet and<br />
vice versa.<br />
The beam noise data were used<br />
to compute footprints at 5-min<br />
intervals <strong>for</strong> several weeks. This<br />
allowed observation of the variability<br />
in fi eld coverage and assessment of how parameters<br />
like weather and shipping variations affect fi eld per<strong>for</strong>mance.<br />
The footprints were further used to determine<br />
such metrics as fi eld probability of detection (probability<br />
of detecting a patrolling target in the fi eld in a given<br />
period of time) and mean time between target redetection.<br />
These metrics and variations could be explained<br />
in terms of observable environmental factors such as<br />
changes in shipping densities and weather.<br />
Longitude<br />
JOHNS HOPKINS APL TECHNICAL DIGEST, VOLUME 23, NUMBER 4 (2002) 363<br />
Latitude<br />
Contact 2<br />
Contact 1<br />
Figure 4. Footprints <strong>for</strong> a single time in a test of a fi eld of ADS<br />
arrays.
B. O. BATES, R. CALHOUN, AND D. E. GRANT<br />
Similar techniques have been<br />
applied to towed array data. Footprints<br />
were computed in the same<br />
manner described above: beam<br />
noise was collected at 5-min intervals<br />
to assess footprint variability,<br />
and test data were used to derive<br />
RD values <strong>for</strong> the operator and<br />
system. This technique was used to<br />
analyze a test of ARCI processing of<br />
a towed array.<br />
The measure of per<strong>for</strong>mance<br />
that was of interest in testing this<br />
array was the sweep rate, that is,<br />
the amount of area (of the ocean)<br />
that can be searched in a given<br />
time period, usually specifi ed in<br />
units of area/time. A direct measurement<br />
of the sweep rate can be<br />
made with the footprints. Figure 5<br />
gives an example. It displays the<br />
tow ship, its track, and the latest<br />
footprint as well as the envelope<br />
of footprints from the previous<br />
hour. The example is shown <strong>for</strong> a<br />
period when there was a test target<br />
plat<strong>for</strong>m in the test, and this track<br />
THE AUTHORS<br />
Target track<br />
not in footprint<br />
Array tow<br />
ship track<br />
is also indicated. The test target was used <strong>for</strong> footprint<br />
validation. The envelopes of the footprints from the<br />
previous hour defi ne the area that was swept in the<br />
previous hour to produce an estimate of the sweep rate<br />
<strong>for</strong> that hour. Footprints were computed from several<br />
hours of data to assess the sweep rate and how it varied<br />
with time.<br />
CONCLUSION<br />
<strong>Operational</strong> evaluation has evolved in response to<br />
changes in sonar system development and procurement.<br />
Although the new testing approach presented here<br />
requires commitment by the government sponsor in<br />
terms of labor and equipment, future funding decisions<br />
Latitude<br />
Target track<br />
in footprint<br />
Longitude<br />
Figure 5. Footprint data showing 1 h of history.<br />
should be aided by an accurate view of current capabilities.<br />
Ground truth acoustic analysis per<strong>for</strong>med postexercise<br />
allows a true measurement of what sources from<br />
the test target are available to the operator and provides<br />
insight into possible areas <strong>for</strong> improved detection per<strong>for</strong>mance.<br />
The use of acoustic footprints allows the tester<br />
and system developer to understand why a sensor is not<br />
providing signal excess to the operator. Early teaming<br />
of the government testers, R&D laboratories, and the<br />
acquisition community brings an earlier understanding<br />
of possible problems, fosters trust between tester and<br />
developer, and ensures that the warfi ghter is receiving<br />
a system that not only meets current operational needs<br />
but can continue to evolve with the threat.<br />
BRADLEY O. BATES is a member of the Senior Professional Staff in APL’s<br />
National Security Technology Department. He earned his M.S. degree in technical<br />
management from the JHU Whiting School of Engineering in 1998. He is currently<br />
the Program Manager responsible <strong>for</strong> tasks supporting Commander <strong>Operational</strong> Test<br />
and <strong>Evaluation</strong> Force (COTF) in evaluating passive sensors such as AN/BSY-2, AN/<br />
BQQ-10, SURTASS, and the Advanced Deployable System (ADS). Mr. Bates is<br />
also the Program Manager <strong>for</strong> both the SURTASS Improvement Program and the<br />
ADS Program. He has over 32 years of experience in submarine sonar operations,<br />
test, and evaluation. His e-mail address is bradley.bates@jhuapl.edu.<br />
Envelope of<br />
last hour<br />
of footprints<br />
Current<br />
footprint<br />
364 JOHNS HOPKINS APL TECHNICAL DIGEST, VOLUME 23, NUMBER 4 (2002)
OPERATIONAL EVALUATION FOR EVOLUTIONARY SONARS<br />
RORY CALHOUN (USN, Ret.) is currently the Independent Verifi cation and<br />
Validation Laboratory Manager <strong>for</strong> the In<strong>for</strong>mation Technology Section of the<br />
Optical Sciences Branch at the Naval Research Laboratory. Prior to assuming<br />
duties at NRL he served as the sonar team leader on the staff of Commander,<br />
<strong>Operational</strong> Test and <strong>Evaluation</strong> Force from November 1996 through February<br />
2002, where he was responsible <strong>for</strong> overseeing the operational testing of the Navy’s<br />
new-start and upgrade programs <strong>for</strong> ASW sensors. His e-mail address is Calhoun@<br />
osdsun1.nrl.navy.mil.<br />
DAVID E. GRANT has been a research associate at the Applied Research Laboratories:<br />
The University of Texas at Austin (ARL:UT) since 1983. He earned a<br />
B.S. degree in physics from Abilene Christian University (1980), and an M.A.<br />
(1983) and Ph.D. (1987), both in physics, from the University of Texas. Dr. Grant<br />
is the ARL:UT Project Leader <strong>for</strong> the COMOPTEVFOR Sonar Test and <strong>Evaluation</strong><br />
project and the Advanced Deployable System project. He is responsible <strong>for</strong><br />
developing test methodologies, test planning, data reduction and analysis, algorithm<br />
development and testing, and system engineering. His research areas include ocean<br />
acoustics, distributed surveillance system acoustics, low-frequency active acoustics,<br />
advanced sensors <strong>for</strong> distributed surveillance systems, ocean ambient noise, beam<strong>for</strong>ming,<br />
signal processing, and sonar test and evaluation. His e-mail address is<br />
grant@arlut.utexas.edu.<br />
JOHNS HOPKINS APL TECHNICAL DIGEST, VOLUME 23, NUMBER 4 (2002) 365