ifrender - Nanyang Technological University
ifrender - Nanyang Technological University
ifrender - Nanyang Technological University

Create successful ePaper yourself
Turn your PDF publications into a flip-book with our unique Google optimized e-Paper software.
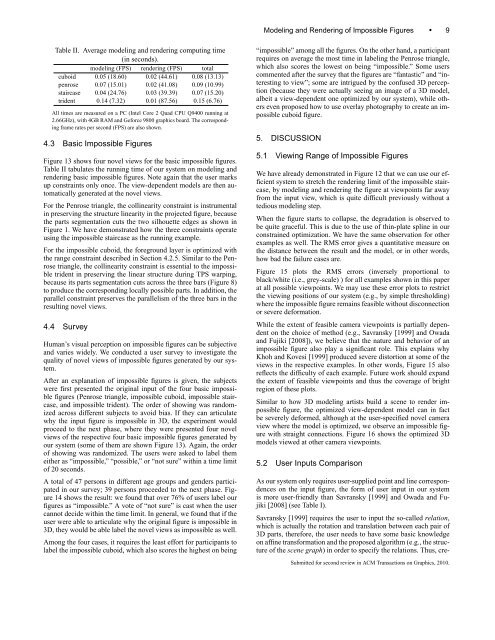
Table II. Average modeling and rendering computing time<br />
(in seconds).<br />
modeling (FPS) rendering (FPS) total<br />
cuboid 0.05 (18.60) 0.02 (44.61) 0.08 (13.13)<br />
penrose 0.07 (15.01) 0.02 (41.08) 0.09 (10.99)<br />
staircase 0.04 (24.76) 0.03 (39.39) 0.07 (15.20)<br />
trident 0.14 (7.32) 0.01 (87.56) 0.15 (6.76)<br />
All times are measured on a PC (Intel Core 2 Quad CPU Q9400 running at<br />
2.66GHz), with 4GB RAM and Geforce 9800 graphics board. The corresponding<br />
frame rates per second (FPS) are also shown.<br />
4.3 Basic Impossible Figures<br />
Figure 13 shows four novel views for the basic impossible figures.<br />
Table II tabulates the running time of our system on modeling and<br />
rendering basic impossible figures. Note again that the user marks<br />
up constraints only once. The view-dependent models are then automatically<br />
generated at the novel views.<br />
For the Penrose triangle, the collinearity constraint is instrumental<br />
in preserving the structure linearity in the projected figure, because<br />
the parts segmentation cuts the two silhouette edges as shown in<br />
Figure 1. We have demonstrated how the three constraints operate<br />
using the impossible staircase as the running example.<br />
For the impossible cuboid, the foreground layer is optimized with<br />
the range constraint described in Section 4.2.5. Similar to the Penrose<br />
triangle, the collinearity constraint is essential to the impossible<br />
trident in preserving the linear structure during TPS warping,<br />
because its parts segmentation cuts across the three bars (Figure 8)<br />
to produce the corresponding locally possible parts. In addition, the<br />
parallel constraint preserves the parallelism of the three bars in the<br />
resulting novel views.<br />
4.4 Survey<br />
Human’s visual perception on impossible figures can be subjective<br />
and varies widely. We conducted a user survey to investigate the<br />
quality of novel views of impossible figures generated by our system.<br />
After an explanation of impossible figures is given, the subjects<br />
were first presented the original input of the four basic impossible<br />
figures (Penrose triangle, impossible cuboid, impossible staircase,<br />
and impossible trident). The order of showing was randomized<br />
across different subjects to avoid bias. If they can articulate<br />
why the input figure is impossible in 3D, the experiment would<br />
proceed to the next phase, where they were presented four novel<br />
views of the respective four basic impossible figures generated by<br />
our system (some of them are shown Figure 13). Again, the order<br />
of showing was randomized. The users were asked to label them<br />
either as “impossible,” “possible,” or “not sure” within a time limit<br />
of 20 seconds.<br />
A total of 47 persons in different age groups and genders participated<br />
in our survey; 39 persons proceeded to the next phase. Figure<br />
14 shows the result: we found that over 76% of users label our<br />
figures as “impossible.” A vote of “not sure” is cast when the user<br />
cannot decide within the time limit. In general, we found that if the<br />
user were able to articulate why the original figure is impossible in<br />
3D, they would be able label the novel views as impossible as well.<br />
Among the four cases, it requires the least effort for participants to<br />
label the impossible cuboid, which also scores the highest on being<br />
Modeling and Rendering of Impossible Figures • 9<br />
“impossible” among all the figures. On the other hand, a participant<br />
requires on average the most time in labeling the Penrose triangle,<br />
which also scores the lowest on being “impossible.” Some users<br />
commented after the survey that the figures are “fantastic” and “interesting<br />
to view”; some are intrigued by the confused 3D perception<br />
(because they were actually seeing an image of a 3D model,<br />
albeit a view-dependent one optimized by our system), while others<br />
even proposed how to use overlay photography to create an impossible<br />
cuboid figure.<br />
5. DISCUSSION<br />
5.1 Viewing Range of Impossible Figures<br />
We have already demonstrated in Figure 12 that we can use our efficient<br />
system to stretch the rendering limit of the impossible staircase,<br />
by modeling and rendering the figure at viewpoints far away<br />
from the input view, which is quite difficult previously without a<br />
tedious modeling step.<br />
When the figure starts to collapse, the degradation is observed to<br />
be quite graceful. This is due to the use of thin-plate spline in our<br />
constrained optimization. We have the same observation for other<br />
examples as well. The RMS error gives a quantitative measure on<br />
the distance between the result and the model, or in other words,<br />
how bad the failure cases are.<br />
Figure 15 plots the RMS errors (inversely proportional to<br />
black/white (i.e., grey-scale) ) for all examples shown in this paper<br />
at all possible viewpoints. We may use these error plots to restrict<br />
the viewing positions of our system (e.g., by simple thresholding)<br />
where the impossible figure remains feasible without disconnection<br />
or severe deformation.<br />
While the extent of feasible camera viewpoints is partially dependent<br />
on the choice of method (e.g., Savransky [1999] and Owada<br />
and Fujiki [2008]), we believe that the nature and behavior of an<br />
impossible figure also play a significant role. This explains why<br />
Khoh and Kovesi [1999] produced severe distortion at some of the<br />
views in the respective examples. In other words, Figure 15 also<br />
reflects the difficulty of each example. Future work should expand<br />
the extent of feasible viewpoints and thus the coverage of bright<br />
region of these plots.<br />
Similar to how 3D modeling artists build a scene to render impossible<br />
figure, the optimized view-dependent model can in fact<br />
be severely deformed, although at the user-specified novel camera<br />
view where the model is optimized, we observe an impossible figure<br />
with straight connections. Figure 16 shows the optimized 3D<br />
models viewed at other camera viewpoints.<br />
5.2 User Inputs Comparison<br />
As our system only requires user-supplied point and line correspondences<br />
on the input figure, the form of user input in our system<br />
is more user-friendly than Savransky [1999] and Owada and Fujiki<br />
[2008] (see Table I).<br />
Savransky [1999] requires the user to input the so-called relation,<br />
which is actually the rotation and translation between each pair of<br />
3D parts, therefore, the user needs to have some basic knowledge<br />
on affine transformation and the proposed algorithm (e.g., the structure<br />
of the scene graph) in order to specify the relations. Thus, cre-<br />
Submitted for second review in ACM Transactions on Graphics, 2010.