Tina van de Flierdt, Katharina Pahnke, and GEOTRACES ... - ASLO
Tina van de Flierdt, Katharina Pahnke, and GEOTRACES ... - ASLO
Tina van de Flierdt, Katharina Pahnke, and GEOTRACES ... - ASLO

Create successful ePaper yourself
Turn your PDF publications into a flip-book with our unique Google optimized e-Paper software.
<strong>van</strong> <strong>de</strong> <strong>Flierdt</strong> et al. Intercalibration of Seawater Nd Isotopes<br />
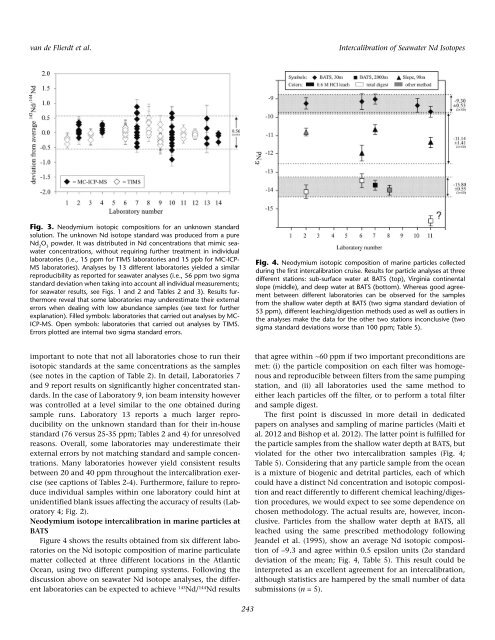
Fig. 3. Neodymium isotopic compositions for an unknown st<strong>and</strong>ard<br />
solution. The unknown Nd isotope st<strong>and</strong>ard was produced from a pure<br />
Nd 2 O 3 pow<strong>de</strong>r. It was distributed in Nd concentrations that mimic seawater<br />
concentrations, without requiring further treatment in individual<br />
laboratories (i.e., 15 ppm for TIMS laboratories <strong>and</strong> 15 ppb for MC-ICP-<br />
MS laboratories). Analyses by 13 different laboratories yiel<strong>de</strong>d a similar<br />
reproducibility as reported for seawater analyses (i.e., 56 ppm two sigma<br />
st<strong>and</strong>ard <strong>de</strong>viation when taking into account all individual measurements;<br />
for seawater results, see Figs. 1 <strong>and</strong> 2 <strong>and</strong> Tables 2 <strong>and</strong> 3). Results furthermore<br />
reveal that some laboratories may un<strong>de</strong>restimate their external<br />
errors when <strong>de</strong>aling with low abundance samples (see text for further<br />
explanation). Filled symbols: laboratories that carried out analyses by MC-<br />
ICP-MS. Open symbols: laboratories that carried out analyses by TIMS.<br />
Errors plotted are internal two sigma st<strong>and</strong>ard errors.<br />
important to note that not all laboratories chose to run their<br />
isotopic st<strong>and</strong>ards at the same concentrations as the samples<br />
(see notes in the caption of Table 2). In <strong>de</strong>tail, Laboratories 7<br />
<strong>and</strong> 9 report results on significantly higher concentrated st<strong>and</strong>ards.<br />
In the case of Laboratory 9, ion beam intensity however<br />
was controlled at a level similar to the one obtained during<br />
sample runs. Laboratory 13 reports a much larger reproducibility<br />
on the unknown st<strong>and</strong>ard than for their in-house<br />
st<strong>and</strong>ard (76 versus 25-35 ppm; Tables 2 <strong>and</strong> 4) for unresolved<br />
reasons. Overall, some laboratories may un<strong>de</strong>restimate their<br />
external errors by not matching st<strong>and</strong>ard <strong>and</strong> sample concentrations.<br />
Many laboratories however yield consistent results<br />
between 20 <strong>and</strong> 40 ppm throughout the intercalibration exercise<br />
(see captions of Tables 2-4). Furthermore, failure to reproduce<br />
individual samples within one laboratory could hint at<br />
uni<strong>de</strong>ntified blank issues affecting the accuracy of results (Laboratory<br />
4; Fig. 2).<br />
Neodymium isotope intercalibration in marine particles at<br />
BATS<br />
Figure 4 shows the results obtained from six different laboratories<br />
on the Nd isotopic composition of marine particulate<br />
matter collected at three different locations in the Atlantic<br />
Ocean, using two different pumping systems. Following the<br />
discussion above on seawater Nd isotope analyses, the different<br />
laboratories can be expected to achieve 143 Nd/ 144 Nd results<br />
243<br />
Fig. 4. Neodymium isotopic composition of marine particles collected<br />
during the first intercalibration cruise. Results for particle analyses at three<br />
different stations: sub-surface water at BATS (top), Virginia continental<br />
slope (middle), <strong>and</strong> <strong>de</strong>ep water at BATS (bottom). Whereas good agreement<br />
between different laboratories can be observed for the samples<br />
from the shallow water <strong>de</strong>pth at BATS (two sigma st<strong>and</strong>ard <strong>de</strong>viation of<br />
53 ppm), different leaching/digestion methods used as well as outliers in<br />
the analyses make the data for the other two stations inconclusive (two<br />
sigma st<strong>and</strong>ard <strong>de</strong>viations worse than 100 ppm; Table 5).<br />
that agree within ~60 ppm if two important preconditions are<br />
met: (i) the particle composition on each filter was homogenous<br />
<strong>and</strong> reproducible between filters from the same pumping<br />
station, <strong>and</strong> (ii) all laboratories used the same method to<br />
either leach particles off the filter, or to perform a total filter<br />
<strong>and</strong> sample digest.<br />
The first point is discussed in more <strong>de</strong>tail in <strong>de</strong>dicated<br />
papers on analyses <strong>and</strong> sampling of marine particles (Maiti et<br />
al. 2012 <strong>and</strong> Bishop et al. 2012). The latter point is fulfilled for<br />
the particle samples from the shallow water <strong>de</strong>pth at BATS, but<br />
violated for the other two intercalibration samples (Fig. 4;<br />
Table 5). Consi<strong>de</strong>ring that any particle sample from the ocean<br />
is a mixture of biogenic <strong>and</strong> <strong>de</strong>trital particles, each of which<br />
could have a distinct Nd concentration <strong>and</strong> isotopic composition<br />
<strong>and</strong> react differently to different chemical leaching/digestion<br />
procedures, we would expect to see some <strong>de</strong>pen<strong>de</strong>nce on<br />
chosen methodology. The actual results are, however, inconclusive.<br />
Particles from the shallow water <strong>de</strong>pth at BATS, all<br />
leached using the same prescribed methodology following<br />
Jean<strong>de</strong>l et al. (1995), show an average Nd isotopic composition<br />
of –9.3 <strong>and</strong> agree within 0.5 epsilon units (2s st<strong>and</strong>ard<br />
<strong>de</strong>viation of the mean; Fig. 4, Table 5). This result could be<br />
interpreted as an excellent agreement for an intercalibration,<br />
although statistics are hampered by the small number of data<br />
submissions (n = 5).