Tina van de Flierdt, Katharina Pahnke, and GEOTRACES ... - ASLO
Tina van de Flierdt, Katharina Pahnke, and GEOTRACES ... - ASLO
Tina van de Flierdt, Katharina Pahnke, and GEOTRACES ... - ASLO

Create successful ePaper yourself
Turn your PDF publications into a flip-book with our unique Google optimized e-Paper software.
<strong>van</strong> <strong>de</strong> <strong>Flierdt</strong> et al. Seawater Nd Isotopes: Intercalibration<br />
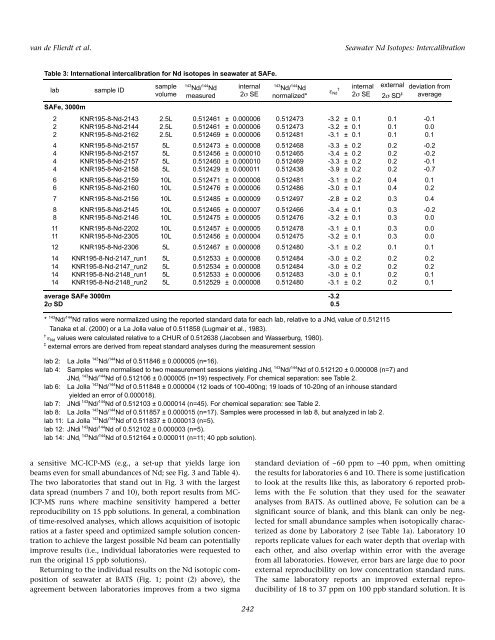
Table 3: International intercalibration for Nd isotopes in seawater at SAFe.<br />
lab sample ID<br />
sample<br />
volume<br />
143 Nd/ 144 Nd<br />
measured<br />
a sensitive MC-ICP-MS (e.g., a set-up that yields large ion<br />
beams even for small abundances of Nd; see Fig. 3 <strong>and</strong> Table 4).<br />
The two laboratories that st<strong>and</strong> out in Fig. 3 with the largest<br />
data spread (numbers 7 <strong>and</strong> 10), both report results from MC-<br />
ICP-MS runs where machine sensitivity hampered a better<br />
reproducibility on 15 ppb solutions. In general, a combination<br />
of time-resolved analyses, which allows acquisition of isotopic<br />
ratios at a faster speed <strong>and</strong> optimized sample solution concentration<br />
to achieve the largest possible Nd beam can potentially<br />
improve results (i.e., individual laboratories were requested to<br />
run the original 15 ppb solutions).<br />
Returning to the individual results on the Nd isotopic composition<br />
of seawater at BATS (Fig. 1; point (2) above), the<br />
agreement between laboratories improves from a two sigma<br />
internal<br />
2 SE<br />
242<br />
143 Nd/ 144 Nd<br />
normalized*<br />
†<br />
Nd internal<br />
2 SE<br />
external<br />
2 SD ‡<br />
<strong>de</strong>viation from<br />
average<br />
SAFe, 3000m<br />
2 KNR195-8-Nd-2143 2.5L 0.512461 ± 0.000006 0.512473 -3.2 ± 0.1 0.1 -0.1<br />
2 KNR195-8-Nd-2144 2.5L 0.512461 ± 0.000006 0.512473 -3.2 ± 0.1 0.1 0.0<br />
2 KNR195-8-Nd-2162 2.5L 0.512469 ± 0.000006 0.512481 -3.1 ± 0.1 0.1 0.1<br />
4 KNR195-8-Nd-2157 5L 0.512473 ± 0.000008 0.512468 -3.3 ± 0.2 0.2 -0.2<br />
4 KNR195-8-Nd-2157 5L 0.512456 ± 0.000010 0.512465 -3.4 ± 0.2 0.2 -0.2<br />
4 KNR195-8-Nd-2157 5L 0.512460 ± 0.000010 0.512469 -3.3 ± 0.2 0.2 -0.1<br />
4 KNR195-8-Nd-2158 5L 0.512429 ± 0.000011 0.512438 -3.9 ± 0.2 0.2 -0.7<br />
6 KNR195-8-Nd-2159 10L 0.512471 ± 0.000008 0.512481 -3.1 ± 0.2 0.4 0.1<br />
6 KNR195-8-Nd-2160 10L 0.512476 ± 0.000006 0.512486 -3.0 ± 0.1 0.4 0.2<br />
7 KNR195-8-Nd-2156 10L 0.512485 ± 0.000009 0.512497 -2.8 ± 0.2 0.3 0.4<br />
8 KNR195-8-Nd-2145 10L 0.512465 ± 0.000007 0.512466 -3.4 ± 0.1 0.3 -0.2<br />
8 KNR195-8-Nd-2146 10L 0.512475 ± 0.000005 0.512476 -3.2 ± 0.1 0.3 0.0<br />
11 KNR195-8-Nd-2202 10L 0.512457 ± 0.000005 0.512478 -3.1 ± 0.1 0.3 0.0<br />
11 KNR195-8-Nd-2305 10L 0.512456 ± 0.000004 0.512475 -3.2 ± 0.1 0.3 0.0<br />
12 KNR195-8-Nd-2306 5L 0.512467 ± 0.000008 0.512480 -3.1 ± 0.2 0.1 0.1<br />
14 KNR195-8-Nd-2147_run1 5L 0.512533 ± 0.000008 0.512484 -3.0 ± 0.2 0.2 0.2<br />
14 KNR195-8-Nd-2147_run2 5L 0.512534 ± 0.000008 0.512484 -3.0 ± 0.2 0.2 0.2<br />
14 KNR195-8-Nd-2148_run1 5L 0.512533 ± 0.000006 0.512483 -3.0 ± 0.1 0.2 0.1<br />
14 KNR195-8-Nd-2148_run2 5L 0.512529 ± 0.000008 0.512480 -3.1 ± 0.2 0.2 0.1<br />
average SAFe 3000m -3.2<br />
2 SD 0.5<br />
* 143 Nd/ 144 Nd ratios were normalized using the reported st<strong>and</strong>ard data for each lab, relative to a JNd i value of 0.512115<br />
Tanaka et al. (2000) or a La Jolla value of 0.511858 (Lugmair et al., 1983).<br />
† Nd values were calculated relative to a CHUR of 0.512638 (Jacobsen <strong>and</strong> Wasserburg, 1980).<br />
‡ external errors are <strong>de</strong>rived from repeat st<strong>and</strong>ard analyses during the measurement session<br />
lab 2: La Jolla 143 Nd/ 144 Nd of 0.511846 ± 0.000005 (n=16).<br />
lab 4: Samples were normalised to two measurement sessions yielding JNd i 143 Nd/ 144 Nd of 0.512120 ± 0.000008 (n=7) <strong>and</strong><br />
JNd i 143 Nd/ 144 Nd of 0.512106 ± 0.000005 (n=19) respectively. For chemical separation: see Table 2.<br />
lab 6: La Jolla 143 Nd/ 144 Nd of 0.511848 ± 0.000004 (12 loads of 100-400ng; 19 loads of 10-20ng of an inhouse st<strong>and</strong>ard<br />
yiel<strong>de</strong>d an error of 0.000018).<br />
lab 7: JNdi 143 Nd/ 144 Nd of 0.512103 ± 0.000014 (n=45). For chemical separation: see Table 2.<br />
lab 8: La Jolla 143 Nd/ 144 Nd of 0.511857 ± 0.000015 (n=17). Samples were processed in lab 8, but analyzed in lab 2.<br />
lab 11: La Jolla 143 Nd/ 144 Nd of 0.511837 ± 0.000013 (n=5).<br />
lab 12: JNdi 143 Nd/ 144 Nd of 0.512102 ± 0.000003 (n=5).<br />
lab 14: JNd i 143 Nd/ 144 Nd of 0.512164 ± 0.000011 (n=11; 40 ppb solution).<br />
Table 3.<br />
st<strong>and</strong>ard <strong>de</strong>viation of ~60 ppm to ~40 ppm, when omitting<br />
the results for laboratories 6 <strong>and</strong> 10. There is some justification<br />
to look at the results like this, as laboratory 6 reported problems<br />
with the Fe solution that they used for the seawater<br />
analyses from BATS. As outlined above, Fe solution can be a<br />
significant source of blank, <strong>and</strong> this blank can only be neglected<br />
for small abundance samples when isotopically characterized<br />
as done by Laboratory 2 (see Table 1a). Laboratory 10<br />
reports replicate values for each water <strong>de</strong>pth that overlap with<br />
each other, <strong>and</strong> also overlap within error with the average<br />
from all laboratories. However, error bars are large due to poor<br />
external reproducibility on low concentration st<strong>and</strong>ard runs.<br />
The same laboratory reports an improved external reproducibility<br />
of 18 to 37 ppm on 100 ppb st<strong>and</strong>ard solution. It is