Tina van de Flierdt, Katharina Pahnke, and GEOTRACES ... - ASLO
Tina van de Flierdt, Katharina Pahnke, and GEOTRACES ... - ASLO
Tina van de Flierdt, Katharina Pahnke, and GEOTRACES ... - ASLO

You also want an ePaper? Increase the reach of your titles
YUMPU automatically turns print PDFs into web optimized ePapers that Google loves.
<strong>van</strong> <strong>de</strong> <strong>Flierdt</strong> et al. Seawater Nd Isotopes: Intercalibration<br />
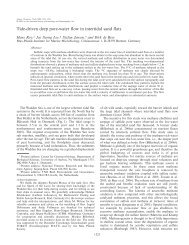
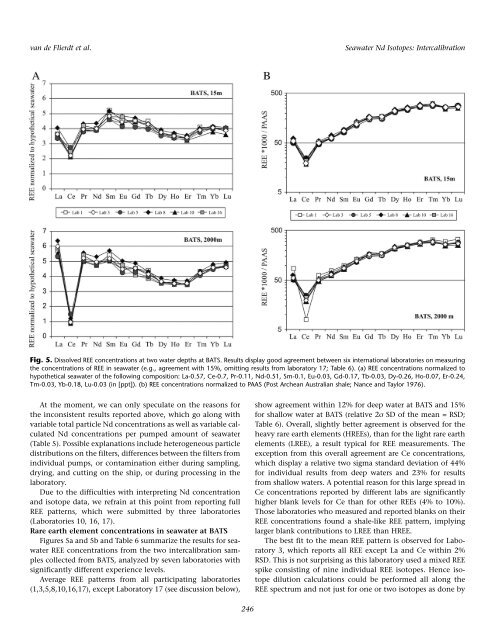
Fig. 5. Dissolved REE concentrations at two water <strong>de</strong>pths at BATS. Results display good agreement between six international laboratories on measuring<br />
the concentrations of REE in seawater (e.g., agreement with 15%, omitting results from laboratory 17; Table 6). (a) REE concentrations normalized to<br />
hypothetical seawater of the following composition: La-0.57, Ce-0.7, Pr-0.11, Nd-0.51, Sm-0.1, Eu-0.03, Gd-0.17, Tb-0.03, Dy-0.26, Ho-0.07, Er-0.24,<br />
Tm-0.03, Yb-0.18, Lu-0.03 (in [ppt]). (b) REE concentrations normalized to PAAS (Post Archean Australian shale; Nance <strong>and</strong> Taylor 1976).<br />
At the moment, we can only speculate on the reasons for<br />
the inconsistent results reported above, which go along with<br />
variable total particle Nd concentrations as well as variable calculated<br />
Nd concentrations per pumped amount of seawater<br />
(Table 5). Possible explanations inclu<strong>de</strong> heterogeneous particle<br />
distributions on the filters, differences between the filters from<br />
individual pumps, or contamination either during sampling,<br />
drying, <strong>and</strong> cutting on the ship, or during processing in the<br />
laboratory.<br />
Due to the difficulties with interpreting Nd concentration<br />
<strong>and</strong> isotope data, we refrain at this point from reporting full<br />
REE patterns, which were submitted by three laboratories<br />
(Laboratories 10, 16, 17).<br />
Rare earth element concentrations in seawater at BATS<br />
Figures 5a <strong>and</strong> 5b <strong>and</strong> Table 6 summarize the results for seawater<br />
REE concentrations from the two intercalibration samples<br />
collected from BATS, analyzed by seven laboratories with<br />
significantly different experience levels.<br />
Average REE patterns from all participating laboratories<br />
(1,3,5,8,10,16,17), except Laboratory 17 (see discussion below),<br />
246<br />
show agreement within 12% for <strong>de</strong>ep water at BATS <strong>and</strong> 15%<br />
for shallow water at BATS (relative 2s SD of the mean = RSD;<br />
Table 6). Overall, slightly better agreement is observed for the<br />
heavy rare earth elements (HREEs), than for the light rare earth<br />
elements (LREE), a result typical for REE measurements. The<br />
exception from this overall agreement are Ce concentrations,<br />
which display a relative two sigma st<strong>and</strong>ard <strong>de</strong>viation of 44%<br />
for individual results from <strong>de</strong>ep waters <strong>and</strong> 23% for results<br />
from shallow waters. A potential reason for this large spread in<br />
Ce concentrations reported by different labs are significantly<br />
higher blank levels for Ce than for other REEs (4% to 10%).<br />
Those laboratories who measured <strong>and</strong> reported blanks on their<br />
REE concentrations found a shale-like REE pattern, implying<br />
larger blank contributions to LREE than HREE.<br />
The best fit to the mean REE pattern is observed for Laboratory<br />
3, which reports all REE except La <strong>and</strong> Ce within 2%<br />
RSD. This is not surprising as this laboratory used a mixed REE<br />
spike consisting of nine individual REE isotopes. Hence isotope<br />
dilution calculations could be performed all along the<br />
REE spectrum <strong>and</strong> not just for one or two isotopes as done by