

Hawkesbury-Nepean River Environmental Monitoring Program
Hawkesbury-Nepean River Environmental Monitoring Program
Hawkesbury-Nepean River Environmental Monitoring Program

You also want an ePaper? Increase the reach of your titles
YUMPU automatically turns print PDFs into web optimized ePapers that Google loves.
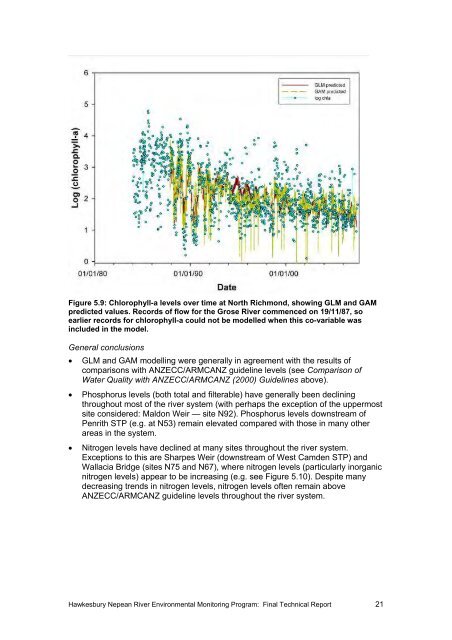
Figure 5.9: Chlorophyll-a levels over time at North Richmond, showing GLM and GAM<br />
predicted values. Records of flow for the Grose <strong>River</strong> commenced on 19/11/87, so<br />
earlier records for chlorophyll-a could not be modelled when this co-variable was<br />
included in the model.<br />
General conclusions<br />
• GLM and GAM modelling were generally in agreement with the results of<br />
comparisons with ANZECC/ARMCANZ guideline levels (see Comparison of<br />
Water Quality with ANZECC/ARMCANZ (2000) Guidelines above).<br />
• Phosphorus levels (both total and filterable) have generally been declining<br />
throughout most of the river system (with perhaps the exception of the uppermost<br />
site considered: Maldon Weir — site N92). Phosphorus levels downstream of<br />
Penrith STP (e.g. at N53) remain elevated compared with those in many other<br />
areas in the system.<br />
• Nitrogen levels have declined at many sites throughout the river system.<br />
Exceptions to this are Sharpes Weir (downstream of West Camden STP) and<br />
Wallacia Bridge (sites N75 and N67), where nitrogen levels (particularly inorganic<br />
nitrogen levels) appear to be increasing (e.g. see Figure 5.10). Despite many<br />
decreasing trends in nitrogen levels, nitrogen levels often remain above<br />
ANZECC/ARMCANZ guideline levels throughout the river system.<br />
<strong>Hawkesbury</strong> <strong>Nepean</strong> <strong>River</strong> <strong>Environmental</strong> <strong>Monitoring</strong> <strong>Program</strong>: Final Technical Report 21


