Financial Ratios as Predictors of Failure: Evidence from ... - ERIM
Financial Ratios as Predictors of Failure: Evidence from ... - ERIM
Financial Ratios as Predictors of Failure: Evidence from ... - ERIM

Create successful ePaper yourself
Turn your PDF publications into a flip-book with our unique Google optimized e-Paper software.
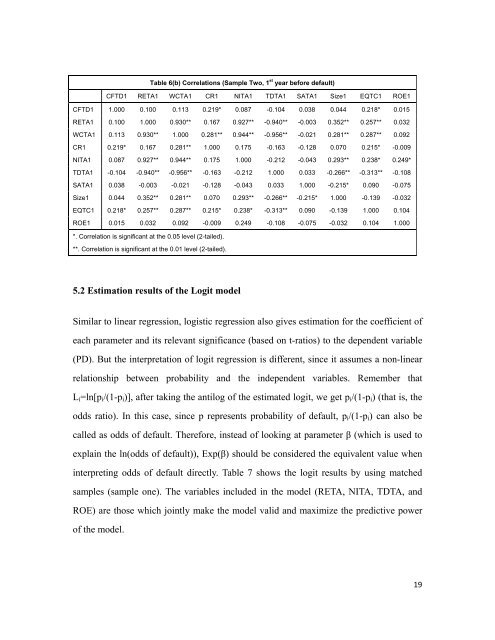
Table 6(b) Correlations (Sample Two, 1 st year before default)<br />
CFTD1 RETA1 WCTA1 CR1 NITA1 TDTA1 SATA1 Size1 EQTC1 ROE1<br />
CFTD1 1.000 0.100 0.113 0.219* 0.087 -0.104 0.038 0.044 0.218* 0.015<br />
RETA1 0.100 1.000 0.930** 0.167 0.927** -0.940** -0.003 0.352** 0.257** 0.032<br />
WCTA1 0.113 0.930** 1.000 0.281** 0.944** -0.956** -0.021 0.281** 0.287** 0.092<br />
CR1 0.219* 0.167 0.281** 1.000 0.175 -0.163 -0.128 0.070 0.215* -0.009<br />
NITA1 0.087 0.927** 0.944** 0.175 1.000 -0.212 -0.043 0.293** 0.238* 0.249*<br />
TDTA1 -0.104 -0.940** -0.956** -0.163 -0.212 1.000 0.033 -0.266** -0.313** -0.108<br />
SATA1 0.038 -0.003 -0.021 -0.128 -0.043 0.033 1.000 -0.215* 0.090 -0.075<br />
Size1 0.044 0.352** 0.281** 0.070 0.293** -0.266** -0.215* 1.000 -0.139 -0.032<br />
EQTC1 0.218* 0.257** 0.287** 0.215* 0.238* -0.313** 0.090 -0.139 1.000 0.104<br />
ROE1 0.015 0.032 0.092 -0.009 0.249 -0.108 -0.075 -0.032 0.104 1.000<br />
*. Correlation is significant at the 0.05 level (2-tailed).<br />
**. Correlation is significant at the 0.01 level (2-tailed).<br />
5.2 Estimation results <strong>of</strong> the Logit model<br />
Similar to linear regression, logistic regression also gives estimation for the coefficient <strong>of</strong><br />
each parameter and its relevant significance (b<strong>as</strong>ed on t-ratios) to the dependent variable<br />
(PD). But the interpretation <strong>of</strong> logit regression is different, since it <strong>as</strong>sumes a non-linear<br />
relationship between probability and the independent variables. Remember that<br />
Li=ln[pi/(1-pi)], after taking the antilog <strong>of</strong> the estimated logit, we get pi/(1-pi) (that is, the<br />
odds ratio). In this c<strong>as</strong>e, since p represents probability <strong>of</strong> default, pi/(1-pi) can also be<br />
called <strong>as</strong> odds <strong>of</strong> default. Therefore, instead <strong>of</strong> looking at parameter β (which is used to<br />
explain the ln(odds <strong>of</strong> default)), Exp(β) should be considered the equivalent value when<br />
interpreting odds <strong>of</strong> default directly. Table 7 shows the logit results by using matched<br />
samples (sample one). The variables included in the model (RETA, NITA, TDTA, and<br />
ROE) are those which jointly make the model valid and maximize the predictive power<br />
<strong>of</strong> the model.<br />
19