Financial Ratios as Predictors of Failure: Evidence from ... - ERIM
Financial Ratios as Predictors of Failure: Evidence from ... - ERIM
Financial Ratios as Predictors of Failure: Evidence from ... - ERIM

Create successful ePaper yourself
Turn your PDF publications into a flip-book with our unique Google optimized e-Paper software.
C<strong>as</strong>e Selected<br />
Status a<br />
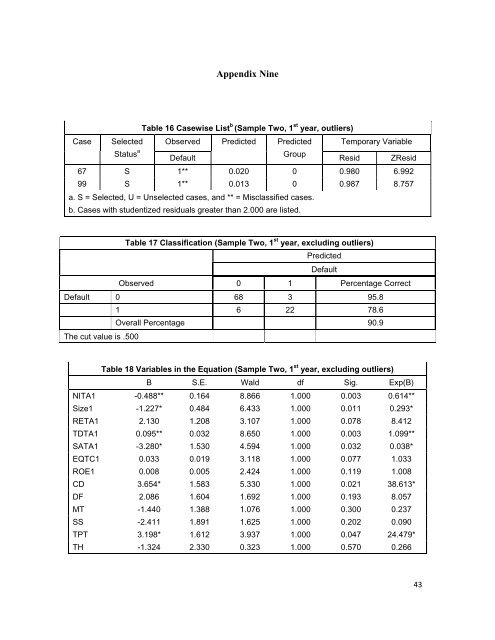
Appendix Nine<br />
Table 16 C<strong>as</strong>ewise List b (Sample Two, 1 st year, outliers)<br />
Observed Predicted Predicted Temporary Variable<br />
Default<br />
Group<br />
Resid ZResid<br />
67 S 1** 0.020 0 0.980 6.992<br />
99 S 1** 0.013 0 0.987 8.757<br />
a. S = Selected, U = Unselected c<strong>as</strong>es, and ** = Miscl<strong>as</strong>sified c<strong>as</strong>es.<br />
b. C<strong>as</strong>es with studentized residuals greater than 2.000 are listed.<br />
Table 17 Cl<strong>as</strong>sification (Sample Two, 1 st year, excluding outliers)<br />
Predicted<br />
Default<br />
Observed 0 1 Percentage Correct<br />
Default 0 68 3 95.8<br />
The cut value is .500<br />
1 6 22 78.6<br />
Overall Percentage 90.9<br />
Table 18 Variables in the Equation (Sample Two, 1 st year, excluding outliers)<br />
B S.E. Wald df Sig. Exp(B)<br />
NITA1 -0.488** 0.164 8.866 1.000 0.003 0.614**<br />
Size1 -1.227* 0.484 6.433 1.000 0.011 0.293*<br />
RETA1 2.130 1.208 3.107 1.000 0.078 8.412<br />
TDTA1 0.095** 0.032 8.650 1.000 0.003 1.099**<br />
SATA1 -3.280* 1.530 4.594 1.000 0.032 0.038*<br />
EQTC1 0.033 0.019 3.118 1.000 0.077 1.033<br />
ROE1 0.008 0.005 2.424 1.000 0.119 1.008<br />
CD 3.654* 1.583 5.330 1.000 0.021 38.613*<br />
DF 2.086 1.604 1.692 1.000 0.193 8.057<br />
MT -1.440 1.388 1.076 1.000 0.300 0.237<br />
SS -2.411 1.891 1.625 1.000 0.202 0.090<br />
TPT 3.198* 1.612 3.937 1.000 0.047 24.479*<br />
TH -1.324 2.330 0.323 1.000 0.570 0.266<br />
43