Economic Capital (EC) – The Market Perspective - ERM Symposium
Economic Capital (EC) – The Market Perspective - ERM Symposium
Economic Capital (EC) – The Market Perspective - ERM Symposium

Create successful ePaper yourself
Turn your PDF publications into a flip-book with our unique Google optimized e-Paper software.
<strong>Economic</strong> <strong>Capital</strong> (<strong>EC</strong>) <strong>–</strong><br />
<strong>The</strong> <strong>Market</strong> <strong>Perspective</strong><br />
<strong>ERM</strong> <strong>Symposium</strong><br />
Chicago<br />
March 28-30, 2007<br />
Hubert Mueller, (860) 843-7079<br />
Hubert.Mueller@towersperrin.com<br />
© 2007 Towers Perrin
<strong>EC</strong> Overview and Recent Trends<br />
Proprietary and Confidential<br />
Not for use or disclosure outside Towers Perrin and its clients
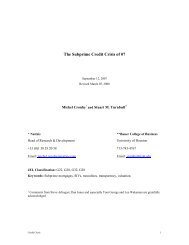
OVERVIEW AND R<strong>EC</strong>ENT TRENDS<br />
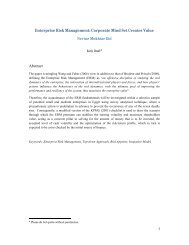
Application of <strong>EC</strong> is on the rise globally<br />
© 2007 Towers Perrin<br />
No:<br />
16%<br />
Considering:<br />
19%<br />
Global Survey Results on Use of <strong>EC</strong><br />
Yes:<br />
65%<br />
Source: Tillinghast 2006 <strong>ERM</strong> Survey.<br />
65% calculating <strong>EC</strong> in 2006<br />
… up from 53% in 2004<br />
Planning to calculate <strong>EC</strong><br />
U.K. 90%<br />
Bermuda 89%<br />
Asia-Pacific 72%<br />
U.S. 49%<br />
Likelihood of calculating <strong>EC</strong><br />
Reinsurers 80%<br />
Multi-line 72%<br />
P/C insurers 69%<br />
Life insurers 55%<br />
— No. America 45%<br />
— EU 61%<br />
Proprietary and Confidential<br />
Not for use or disclosure outside Towers Perrin and its clients<br />
3
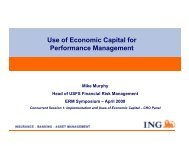
OVERVIEW AND R<strong>EC</strong>ENT TRENDS<br />
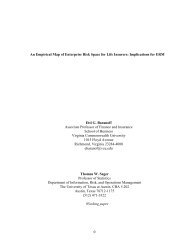
<strong>Market</strong>-consistent balance sheet approach is<br />
becoming most common method to calculate <strong>EC</strong><br />
<strong>Economic</strong> <strong>Capital</strong> is…<br />
Measured as the difference in “market-consistent net assets”<br />
between normal conditions and stressed conditions<br />
A set of stress tests are applied for each risk, calibrated to a<br />
probability level over a one-year time horizon, consistent with<br />
the company’s financial strength rating<br />
Separate stresses are applied to<br />
cover a variety of market, credit<br />
and insurance risks that might<br />
occur over the projected one-year<br />
time horizon<br />
Results are aggregated using a<br />
correlation matrix<br />
© 2007 Towers Perrin<br />
Normal Conditions<br />
MV<br />
Assets<br />
Net<br />
assets<br />
Net<br />
assets<br />
MCV<br />
Liabs<br />
Net<br />
assets<br />
Normal Stressed<br />
Commonly used in Europe, increasingly used in North America<br />
Stressed Conditions<br />
Net<br />
assets<br />
MV<br />
Assets MCV<br />
Liabs<br />
<strong>Economic</strong><br />
<strong>Capital</strong><br />
Proprietary and Confidential<br />
Not for use or disclosure outside Towers Perrin and its clients<br />
4
OVERVIEW AND R<strong>EC</strong>ENT TRENDS<br />
<strong>EC</strong> globally: Solvency II also suggests stress<br />
testing approach<br />
Based on European CFO Forum guidance, <strong>EC</strong> is calculated using<br />
the 99.5th percentile in a stress-testing methodology<br />
Requirements are specified for use of internal models<br />
Consistent standard applied for all EU countries<br />
Assets and liabilities are on a “fair value” basis<br />
<strong>Capital</strong> requirements set for timely intervention<br />
Approach similar to bank “3 Pillars” approach to <strong>EC</strong><br />
1. Technical valuation rules for assets/liabilities solvency margins<br />
2. Enhanced supervisory review process<br />
3. Private and public disclosures<br />
<strong>Capital</strong> for op risk typically set as a percentage of total capital<br />
© 2007 Towers Perrin<br />
Proprietary and Confidential<br />
Not for use or disclosure outside Towers Perrin and its clients<br />
5
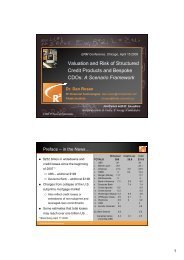
OVERVIEW AND R<strong>EC</strong>ENT TRENDS<br />
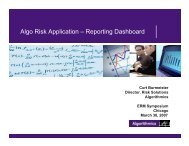
“Best estimate” liability is still the predominant<br />
approach used to calculate <strong>EC</strong> in North America<br />
<strong>Economic</strong> <strong>Capital</strong> is determined as…<br />
<strong>The</strong> level of assets, in addition to the Best Estimate Liability, required to pay future<br />
policyholder benefits at the chosen Security Factor<br />
<strong>Economic</strong> <strong>Capital</strong> covers the volatility in:<br />
<strong>The</strong> runoff of existing business<br />
<strong>The</strong> future business (“pricing risk”)<br />
Best Estimate Liability is…<br />
<strong>The</strong> best estimate projection of<br />
non-investment cash flows<br />
Discounted at the asset returns under<br />
the best estimate economic scenario<br />
Security Factor is…<br />
Based on a risk of ruin level that is<br />
consistent with the company’s financial<br />
strength rating<br />
© 2007 Towers Perrin<br />
<strong>Economic</strong><br />
<strong>Capital</strong><br />
Reserve<br />
margins<br />
Mostly used in North America, but with declining frequency<br />
Pricing<br />
risk<br />
Runoff<br />
risk<br />
Best<br />
Estimate<br />
Liability<br />
Proprietary and Confidential<br />
Not for use or disclosure outside Towers Perrin and its clients<br />
Needed<br />
Assets<br />
6
OVERVIEW AND R<strong>EC</strong>ENT TRENDS<br />
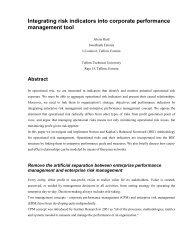
<strong>The</strong> measures of risk tolerance used in<br />
calculating <strong>EC</strong> are fairly evenly divided<br />
<strong>The</strong> most common responses among participants were tail value<br />
at risk or conditional tail expectation (37%), probability of ruin<br />
(37%) and a specified percentile (47%)<br />
TVaR or CTE is more commonly used in North America (49%)<br />
and in continental Europe (48%)<br />
<strong>The</strong> probability of ruin is used more frequently by participants<br />
in Bermuda (75%) and the U.K. (59%)<br />
Specified percentile<br />
Tail value at risk or conditional tail expectation<br />
(CTE)<br />
Probability of ruin<br />
Base: Those that calculate economic capital n = 133 Q.12 What measures of risk tolerance do you use? (Select all that apply.)<br />
Source: Tillinghast 2006 <strong>ERM</strong> Survey.<br />
© 2007 Towers Perrin<br />
<strong>Economic</strong> cost of ruin<br />
Below target risk<br />
11%<br />
9%<br />
37%<br />
37%<br />
47%<br />
Proprietary and Confidential<br />
Not for use or disclosure outside Towers Perrin and its clients<br />
7
OVERVIEW AND R<strong>EC</strong>ENT TRENDS<br />
Insurance companies and regulators<br />
use a range of different confidence levels<br />
Choice of confidence level and implied rating:<br />
Most European insurers are using one-year confidence levels<br />
ranging from 99.5% to 99.99%<br />
European regulators and CRO Forum are advocating a oneyear<br />
99.5% confidence level for Solvency II<br />
Confidence levels are typically linked to a target risk appetite<br />
and financial strength rating<br />
Rating agencies are evaluating tail risk like bond default risk,<br />
using CTE or percentile criteria<br />
Where longer time horizons are used, a lower multi-year<br />
confidence level can be justified (e.g., AA over five years vs.<br />
AA over one year)<br />
© 2007 Towers Perrin<br />
Proprietary and Confidential<br />
Not for use or disclosure outside Towers Perrin and its clients<br />
8
OVERVIEW AND R<strong>EC</strong>ENT TRENDS<br />
<strong>The</strong> calculation of <strong>EC</strong> should include all material<br />
risks<br />
<strong>Market</strong> Risk<br />
Interest Rates<br />
Equities<br />
Real Estate<br />
…<br />
© 2007 Towers Perrin<br />
Overall Risk Profile<br />
Risk Aggregation<br />
Credit Risk Liquidity Risk Insurance Risk Operational Risk<br />
Defaults<br />
Spreads<br />
Counterparty<br />
…<br />
Asset/Liability<br />
Risk<br />
Hedging<br />
Programs<br />
…<br />
Mortality<br />
Lapses<br />
Reserves<br />
…<br />
Distribution<br />
Systems<br />
People<br />
…<br />
Proprietary and Confidential<br />
Not for use or disclosure outside Towers Perrin and its clients<br />
9
OVERVIEW AND R<strong>EC</strong>ENT TRENDS<br />
<strong>The</strong> majority of firms are now including event and<br />
business operational risks in their <strong>EC</strong> calculations<br />
<strong>The</strong> vast majority of the respondents that calculate <strong>EC</strong> use event risks<br />
(82%) and business risks (70%) in their <strong>EC</strong> calculations for operational risks<br />
In 2004, less than half of the respondents included event and business<br />
risk<br />
Multi-line companies on a global basis more frequently included event<br />
risk in their <strong>EC</strong> calculations (91%); this statistic increases to 94% of the<br />
multi-line companies in Europe<br />
Almost all of the U.K. insurers (96%) include event risk in their<br />
calculations<br />
Life insurers (81%) and multi-line companies (87%) were more likely to<br />
include business risks than P/C insurers (48%) on a global basis<br />
Source: Tillinghast 2006 <strong>ERM</strong> Survey.<br />
© 2007 Towers Perrin<br />
Event<br />
Business<br />
Other<br />
14%<br />
70%<br />
82%<br />
Proprietary and Confidential<br />
Not for use or disclosure outside Towers Perrin and its clients<br />
10
OVERVIEW AND R<strong>EC</strong>ENT TRENDS<br />
<strong>The</strong>re is no “right” or “wrong” approach to building<br />
an <strong>EC</strong> model<br />
Decision 1:<br />
Period for<br />
assessment<br />
One year<br />
n years<br />
Run-off of<br />
portfolio<br />
© 2007 Towers Perrin<br />
Decision 2:<br />
Definition<br />
of capital<br />
Statutory<br />
GAAP<br />
<strong>Economic</strong><br />
Decision 3:<br />
Measure<br />
of risk<br />
Risk of ruin<br />
VAR<br />
TVaR<br />
or CTE<br />
Decision 4:<br />
Risks<br />
to include<br />
<strong>Market</strong><br />
Credit<br />
Insurance<br />
Operational<br />
Liquidity<br />
Decision 5:<br />
Quantification<br />
methodology<br />
Stochastic<br />
modelling<br />
Stress<br />
Testing<br />
Factor<br />
based<br />
Decision 6:<br />
Aggregation<br />
Additive<br />
Variance/<br />
Covariance<br />
Stochastic<br />
Six key decisions need to be made, and the approach taken should reflect the<br />
nature of the company and management’s objectives<br />
Proprietary and Confidential<br />
Not for use or disclosure outside Towers Perrin and its clients<br />
11
OVERVIEW AND R<strong>EC</strong>ENT TRENDS<br />
Towers Perrin’s FastTrack <strong>EC</strong> approach follows<br />
a well researched and thoroughly tested path<br />
Decision 1:<br />
Period for<br />
assessment<br />
One year<br />
n years<br />
Run off of<br />
portfolio<br />
© 2007 Towers Perrin<br />
Decision 2:<br />
Definition<br />
of capital<br />
Statutory<br />
GAAP<br />
<strong>Economic</strong><br />
Decision 3:<br />
Measure<br />
of risk<br />
Risk of ruin<br />
TVaR/CTE<br />
<strong>EC</strong>OR<br />
Decision 4:<br />
Risks<br />
to include<br />
<strong>Market</strong><br />
Credit<br />
Insurance<br />
Operational<br />
Liquidity<br />
Decision 5:<br />
Quantification<br />
methodology<br />
Stochastic<br />
modelling<br />
Stress<br />
Testing<br />
Factor<br />
based<br />
Decision 6:<br />
Aggregation<br />
Additive<br />
Variance/<br />
Covariance<br />
Stochastic<br />
Implemented by a majority of multinational insurers and adopted/proposed<br />
for: UK ICA regime, Swiss Solvency Test, EU Solvency II<br />
Proprietary and Confidential<br />
Not for use or disclosure outside Towers Perrin and its clients<br />
12
OVERVIEW AND R<strong>EC</strong>ENT TRENDS<br />
<strong>The</strong>re are four stages to implementing the<br />
FastTrack <strong>EC</strong> approach<br />
Step 1<br />
Develop an economic<br />
view of the business<br />
Step 2<br />
Identify key risks and<br />
determine levels of<br />
stress to be applied<br />
Step 3<br />
Apply stresses to<br />
the economic<br />
balance sheet<br />
Step 4<br />
Aggregate individual<br />
risk capital results,<br />
allowing for<br />
correlation effects<br />
© 2007 Towers Perrin<br />
<strong>Economic</strong> assessment of assets and liabilities<br />
List of stress events to quantify key risks<br />
<strong>EC</strong> requirement for each key risk<br />
Total <strong>EC</strong> requirement for your business<br />
Proprietary and Confidential<br />
Not for use or disclosure outside Towers Perrin and its clients<br />
13
OVERVIEW AND R<strong>EC</strong>ENT TRENDS<br />
One year has become the most frequent risk<br />
assessment period<br />
More than half (56%) of respondents assess risk over a one-year period<br />
This is a sharp increase from 2004, when only 32% of the respondents<br />
indicated they assessed risk over a one-year period<br />
Assessing risk over a two- to five-year period has decreased from 22%<br />
to 12% and the run-off of portfolio from 29% to 14% since 2004<br />
Respondents based in continental Europe (84%) were more likely to<br />
use a one-year period than their counterparts in the U.K. (48%)<br />
This is based on the widespread use of the Solvency II methodology<br />
worldwide<br />
Source: Tillinghast 2006 <strong>ERM</strong> Survey.<br />
© 2007 Towers Perrin<br />
Instantaneous<br />
1 year<br />
2 <strong>–</strong> 5 years<br />
6 <strong>–</strong> 10 years<br />
10 <strong>–</strong> 20 years<br />
Run-off of portfolio<br />
1%<br />
1%<br />
2%<br />
12%<br />
14%<br />
56%<br />
Proprietary and Confidential<br />
Not for use or disclosure outside Towers Perrin and its clients<br />
14
OVERVIEW AND R<strong>EC</strong>ENT TRENDS<br />
By combining models, insurance companies<br />
are able to measure diversification benefits<br />
© 2007 Towers Perrin<br />
Sum of<br />
P/C<br />
Segments<br />
Sum of<br />
Life/Health<br />
Segments<br />
Enterprise Diversification Benefit<br />
P/C<br />
diversification<br />
effect<br />
Life/Health<br />
diversification<br />
effect<br />
<strong>Economic</strong> <strong>Capital</strong><br />
Aggregated<br />
P/C<br />
Business<br />
Aggregated<br />
Life/Health<br />
Business<br />
Cross-sector<br />
diversification<br />
effect<br />
Aggregated<br />
Total<br />
Proprietary and Confidential<br />
Not for use or disclosure outside Towers Perrin and its clients<br />
15
OVERVIEW AND R<strong>EC</strong>ENT TRENDS<br />
Almost half of our <strong>ERM</strong> Survey respondents use a<br />
correlation matrix for aggregating risk<br />
<strong>The</strong> methodology most frequently used for aggregating risk is a correlation matrix<br />
applied to risk capital results for each risk or business unit (46%)<br />
Globally, multi-line companies (57%) and life insurers (52%) make more use of<br />
correlation matrices than P/C insurers (16%)<br />
Correlation matrices are used more frequently in Europe (60%) than in North<br />
America (32%)<br />
Structural models are utilized more frequently by P/C insurers globally (48%) than<br />
multi-line companies (14%) or life insurers (13%) to aggregate risk<br />
Structural models are used even more by P/C insurers in North America (58%)<br />
Only 8% of the respondents do not use a set methodology for aggregating risk<br />
Correlation matrix applied to risk capital results for<br />
each risk or business unit<br />
Simple correlation of individual risk distributions to<br />
give combined direction<br />
Copulas used to combine individual risk distributions<br />
Source: Tillinghast 2006 <strong>ERM</strong> Survey.<br />
© 2007 Towers Perrin<br />
Structural model<br />
5%<br />
12%<br />
22%<br />
Proprietary and Confidential<br />
Not for use or disclosure outside Towers Perrin and its clients<br />
46%<br />
16
Almost all of the respondents that calculate<br />
<strong>EC</strong> are planning to make further improvements<br />
89% of the survey participants that calculate <strong>EC</strong> are planning to make further<br />
improvements or enhancements to their <strong>EC</strong> calculations or framework<br />
This is a particular focus of the participants in Asia Pacific (96%) and Canada<br />
(100%)<br />
North American life insurers (93%) indicate an even higher propensity for<br />
wanting to improve their <strong>EC</strong> calculations or framework, as did 95% of the multiline<br />
companies in Europe<br />
Of those planning improvement, the most frequently cited goal is to improve<br />
aggregation capabilities (70%), followed by improving applications (64%)<br />
Plans for Further Improvements Goals of Planned Improvements<br />
No: 11%<br />
OVERVIEW AND R<strong>EC</strong>ENT TRENDS<br />
© 2007 Towers Perrin<br />
Yes:<br />
89%<br />
Source: Tillinghast 2006 <strong>ERM</strong> Survey.<br />
Improving the aggregation capabilities<br />
Improving applications<br />
Enhancing core methodology<br />
Extending the risks covered<br />
Improving internal reporting capabilities<br />
Improving controls surrounding data and process<br />
Increasing software modeling capabilities<br />
Improving the understanding and buy-in of sr. management<br />
Proprietary and Confidential<br />
Not for use or disclosure outside Towers Perrin and its clients<br />
54%<br />
53%<br />
53%<br />
52%<br />
50%<br />
56%<br />
64%<br />
17<br />
70%
Adding Value from <strong>EC</strong><br />
Proprietary and Confidential<br />
Not for use or disclosure outside Towers Perrin and its clients
ADDING VALUE FROM <strong>EC</strong><br />
Leading-edge companies maximize value by relating decisions<br />
on the risks they take to decisions on the capital they use<br />
© 2007 Towers Perrin<br />
Risk<br />
Structure<br />
Portfolio of<br />
Enterprise<br />
Risks<br />
Return<br />
on Risk<br />
How much<br />
capital do I<br />
need?<br />
Value<br />
Creation<br />
Value<br />
Management<br />
<strong>Capital</strong> Adequacy<br />
Risk and<br />
<strong>Capital</strong><br />
Management<br />
<strong>Economic</strong><br />
<strong>Capital</strong><br />
<strong>Capital</strong><br />
Costs<br />
What type<br />
of capital do<br />
I need?<br />
Portfolio of<br />
<strong>Capital</strong><br />
Resources<br />
<strong>Capital</strong><br />
Structure<br />
Proprietary and Confidential<br />
Not for use or disclosure outside Towers Perrin and its clients<br />
19
ADDING VALUE FROM <strong>EC</strong><br />
Adding value from <strong>EC</strong><br />
Increased focus on allocation of capital for performance management<br />
purposes<br />
<strong>EC</strong> as required capital for EEV/MCEV calculations<br />
Use of <strong>EC</strong> as a metric for short-term/long-term incentive plans<br />
Use of <strong>EC</strong> for business planning<br />
Requires projection of future new business<br />
Use of <strong>EC</strong> in pricing<br />
Principles-based regulation requires projection of <strong>EC</strong> at annual<br />
intervals<br />
In practice, factor-based shortcuts are typically used<br />
<strong>EC</strong> is seen as a key component of <strong>ERM</strong> framework<br />
Increasing scrutiny by regulators/rating agencies<br />
Typically, stress testing approach is used<br />
© 2007 Towers Perrin<br />
Leading-edge companies are leveraging <strong>EC</strong> to connect risk and value<br />
Proprietary and Confidential<br />
Not for use or disclosure outside Towers Perrin and its clients<br />
20
ADDING VALUE FROM <strong>EC</strong><br />
<strong>EC</strong> is increasingly used for product pricing and<br />
design<br />
Evaluating capital requirements<br />
Product pricing and design<br />
© 2007 Towers Perrin<br />
Current and Planned Uses of <strong>EC</strong> Calculations<br />
Managing tail risk<br />
Allocation of capital across sectors<br />
Measuring risk-adjusted performance<br />
Making strategic or tactical decisions<br />
Rating agency communication<br />
Shareholder communication<br />
Regulatory communication<br />
Source: Tillinghast CFO Survey 2006.<br />
21%<br />
31%<br />
47%<br />
47%<br />
56%<br />
56%<br />
76%<br />
69%<br />
64%<br />
36%<br />
31%<br />
25%<br />
47%<br />
47%<br />
Currently use<br />
Plan to use in next 12-24 months<br />
Do not use and have no future plans to use<br />
22%<br />
38%<br />
25%<br />
38%<br />
43%<br />
24%<br />
14%<br />
19%<br />
Proprietary and Confidential<br />
Not for use or disclosure outside Towers Perrin and its clients<br />
6%<br />
6%<br />
6%<br />
6%<br />
21<br />
0%
ADDING VALUE FROM <strong>EC</strong><br />
Rating agencies are increasingly considering<br />
proprietary <strong>EC</strong> models when assessing capital adequacy<br />
Building economic<br />
models into their rating<br />
process during <strong>ERM</strong><br />
reviews<br />
Expecting companies<br />
to demonstrate<br />
balance between<br />
qualitative and<br />
quantitative <strong>ERM</strong><br />
Linking capital<br />
adequacy<br />
requirements directly<br />
to ratings<br />
© 2007 Towers Perrin<br />
S&P<br />
Developing<br />
“Quantum Risk”<br />
evaluation<br />
approach<br />
Fitch<br />
Introduced proprietary<br />
<strong>EC</strong> model “Prism”<br />
Rating<br />
agency<br />
approaches<br />
to <strong>EC</strong><br />
A.M. Best<br />
Considers <strong>EC</strong> part of<br />
<strong>ERM</strong> as evidenced<br />
Proprietary and Confidential<br />
Not for use or disclosure outside Towers Perrin and its clients<br />
Moody’s<br />
Conducts<br />
quantitative<br />
and qualitative<br />
Analysis of <strong>EC</strong><br />
22
March 2007<br />
<strong>Capital</strong> Adequacy Model and<br />
<strong>Economic</strong> <strong>Capital</strong>: Insurance<br />
Ratings Impact<br />
David Ingram<br />
Director <strong>ERM</strong><br />
Financial Services<br />
Permission to reprint or distribute any content from this presentation requires the prior written approval of Standard & Poor’s.<br />
Copyright (c) 2006 Standard & Poor’s, a division of <strong>The</strong> McGraw-Hill Companies, Inc. All rights reserved.
2.<br />
Agenda<br />
A. S&P Insurer <strong>Capital</strong> Adequacy Model Update<br />
B. <strong>ERM</strong> <strong>–</strong> Bridging from <strong>Capital</strong> Adequacy to<br />
ICM<br />
C. <strong>Economic</strong> <strong>Capital</strong> and Ratings<br />
Permission to reprint or distribute any content from this presentation requires the prior written approval of Standard & Poor’s.
<strong>Capital</strong> Adequacy Model<br />
Update<br />
Permission to reprint or distribute any content from this presentation requires the prior written approval of Standard & Poor’s.<br />
Copyright (c) 2006 Standard & Poor’s, a division of <strong>The</strong> McGraw-Hill Companies, Inc. All rights reserved.
4.<br />
Why Update the <strong>Capital</strong> Model Now?<br />
<strong>The</strong> risk-based capital model is an integral tool to evaluate capital<br />
adequacy for life, property & casualty, and health companies.<br />
First introduced by S&P in the early 1990s<br />
Limited changes to the capital factors<br />
Insurance products have become more complex and existing<br />
factors may not have fully captured the embedded risks<br />
Observed volatility in economic parameters (credit, market,<br />
underwriting exposures) over the last 15+ years needs to be<br />
updated and captured in S&P’s analysis of capital<br />
Permission to reprint or distribute any content from this presentation requires the prior written approval of Standard & Poor’s.
5.<br />
Framework Changes to the <strong>Capital</strong> Model<br />
Current:<br />
Formula:<br />
Total adjusted capital (TAC) less charges for<br />
asset-related and credit-related risks<br />
Underwriting/pricing risks + reserve risk (p&c) + asset/liability risk<br />
(interest rate) (life) + business risks not already captured<br />
Updated:<br />
Estimate target capital (within confidence levels) based on insurer’s<br />
risk profile<br />
Target capital will capture all risks (asset, credit, insurance)<br />
Compare the total adjusted capital to the required target capital<br />
Calculate the redundancy or deficiency of target capital to TAC at each<br />
rating level<br />
Permission to reprint or distribute any content from this presentation requires the prior written approval of Standard & Poor’s.
6.<br />
Example<br />
XYZ Insurance Company (‘AA’ FSR) has total adjusted capital (TAC) of<br />
$1.1 billion. Under the current model, capital adequacy ratio is 150%<br />
(very strong)<br />
Proposal:<br />
Target Rating Confidence Required Target <strong>Capital</strong> (Bn)<br />
Level<br />
AAA 99.9% $ 1.5<br />
AA 99.7% $ 1.3<br />
A 99.4% $ 1.0<br />
BBB 97.2% $ 0.8<br />
Conclusion:<br />
•TAC of $1.1 billion is deficient by 15% or $200 million to absorb the<br />
company’s specific risks at the AA rating level<br />
Permission to reprint or distribute any content from this presentation requires the prior written approval of Standard & Poor’s.
7.<br />
Asset-Related Risk Factors: Fixed Income Securities<br />
Current:<br />
• Factors for each credit quality classification (AAA to<br />
impairment)<br />
• Assumed expected defaults over 10 year less varying<br />
recovery rates using a 6% discount rate<br />
Updated:<br />
• Factors for each credit quality classification (AAA to<br />
impairment) based on tenor and stressed in<br />
accordance with target capital levels<br />
Permission to reprint or distribute any content from this presentation requires the prior written approval of Standard & Poor’s.
8.<br />
Asset-Related Risk Charges: Common Equities<br />
Current:<br />
Single factor<br />
Assumption: A single factor (15%) applied based on 1 standard<br />
deviation of the historical annual prices of S&P 500 stock as a<br />
proxy for annual equity volatility<br />
Updated:<br />
Single factor for each target rating category by country<br />
• Methodology:<br />
Volatility of each country’s equity market has been<br />
measured and updated<br />
Factors stressed in accordance with target capital levels<br />
Permission to reprint or distribute any content from this presentation requires the prior written approval of Standard & Poor’s.
9.<br />
Asset-Related Risk Charges: Reinsurance Recoverables<br />
Current:<br />
• Assigned credit risk factors according to credit default<br />
statistics. Reinsurers under some form of regulatory control are<br />
deemed equivalent to a ‘CCC’ and those that are not rated<br />
considered to be a ‘B’<br />
Updated:<br />
Used the same cumulative default factors developed for fixed<br />
income securities, with the same confidence levels<br />
Assume a single tenor of 10 years for all recoverables<br />
Surcharge of 20% on reinsurance recoverable balances where<br />
there is an issue of ‘willingness to pay’<br />
Permission to reprint or distribute any content from this presentation requires the prior written approval of Standard & Poor’s.
10.<br />
Underwriting Risks: Mortality<br />
Current:<br />
A factor is applied against four groupings of net amount of risk<br />
(in-force less carried reserves)<br />
Updated:<br />
To factor in credit for higher levels of in-force diversification,<br />
expanded the number of net amount of risk groupings:<br />
< $1 Bn / $1 <strong>–</strong> 5 Bn / $5 - 10 Bn / $10 <strong>–</strong> 50 Bn / $50 <strong>–</strong>100 Bn /<br />
>$100Bn<br />
Methodology:<br />
Calculated a standard deviation of actual to expected ratios;<br />
converted to claim amount volatility and compared that to the<br />
net amount at risk.<br />
<strong>The</strong> same confidence levels as applied to fixed income<br />
securities will be used.<br />
Permission to reprint or distribute any content from this presentation requires the prior written approval of Standard & Poor’s.
11.<br />
Underwriting Risk Charges: Asset/Liability Matching<br />
Current:<br />
Asset-liability factors developed when products were much<br />
less complex. Less sophisticated risk measurement<br />
techniques employed<br />
Updated:<br />
Factors are derived by aggregating expected capital needs<br />
relating to each of the following sub-categories of risk:<br />
Mismatch risk (MV sensitivity difference of assets, hedges, and<br />
liabilities)<br />
Systemic spread volatility risk<br />
Basis risk<br />
Liability structural feature risk (embedded options) e.g. elective<br />
surrender, death related surrender, benefit responsive withdrawal,<br />
minimum guarantees, etc.<br />
Permission to reprint or distribute any content from this presentation requires the prior written approval of Standard & Poor’s.
12.<br />
Draft Proposal Circulated for Comments (Nov 2006)<br />
Standard & Poor’s published an article that:<br />
• identifies all updated risk-adjusted factors<br />
• provides an explanation behind the<br />
development of each factor<br />
• highlights risk profiles that are most/least<br />
impacted by the updates<br />
Permission to reprint or distribute any content from this presentation requires the prior written approval of Standard & Poor’s.
13.<br />
Next Steps<br />
Standard & Poor’s Received 300+ pages of feedback<br />
from insurance companies and other interested<br />
market participants on the proposed revisions to the<br />
capital model over a three month period<br />
Updated capital model will be finalized in the 1 st half<br />
2007<br />
During 2007, both models will be run simultaneously<br />
As S&P gains more confidence in the revised capital<br />
modeling indications, greater reliance will be placed<br />
on it for analytical purposes<br />
Permission to reprint or distribute any content from this presentation requires the prior written approval of Standard & Poor’s.
S&P Insurer <strong>ERM</strong><br />
Evaluation Process<br />
Bridging from <strong>Capital</strong><br />
Adequacy to Internal<br />
<strong>Capital</strong> Models (ICM)<br />
Permission to reprint or distribute any content from this presentation requires the prior written approval of Standard & Poor’s.<br />
Copyright (c) 2006 Standard & Poor’s, a division of <strong>The</strong> McGraw-Hill Companies, Inc. All rights reserved.
15.<br />
<strong>ERM</strong> Evaluation Components<br />
Strategic Risk Management<br />
Risk<br />
Control<br />
Processes<br />
Emerging<br />
Risks<br />
Mgmt<br />
Risk Management Culture<br />
Permission to reprint or distribute any content from this presentation requires the prior written approval of Standard & Poor’s.<br />
Risk &<br />
<strong>Economic</strong><br />
<strong>Capital</strong><br />
Models
16.<br />
Capacity / <strong>Capital</strong> Management<br />
• Many Insurers & Reinsurers practice Capacity / <strong>Capital</strong> Mgt<br />
<strong>–</strong> Make plans for writing all of the profitable business they can write<br />
<strong>–</strong> <strong>The</strong>n Assess whether they have exceeded their Capacity<br />
Based on S&P, AM Best or RBC <strong>Capital</strong> Target<br />
<strong>–</strong> Use Reinsurance to bring retained risk back into line with Capacity<br />
This is not Strategic Risk Management!<br />
S&P, AM Best, RBC <strong>Capital</strong> formulas are not measures of company<br />
specific risks<br />
Strategic Risk Management uses company specific risk measure<br />
<strong>–</strong>May be <strong>Economic</strong> <strong>Capital</strong> or Earnings at Risk or other risk measure<br />
We are not saying that Capacity / <strong>Capital</strong> Mgt is bad<br />
- It is just not Strategic Risk Management<br />
Permission to reprint or distribute any content from this presentation requires the prior written approval of Standard & Poor’s.
17.<br />
What Can go Wrong with using General Risk <strong>Capital</strong> models?<br />
• When new products or investments become major activities<br />
• before the NAIC, S&P or others add something to their capital<br />
formula…<br />
• Two Bad things can happen:<br />
<strong>–</strong> <strong>The</strong> company can hit a bad spell and experience losses far above their risk<br />
tolerances<br />
<strong>–</strong> <strong>The</strong> Regulators / Ratings agencies can decide to set a reasonable level of<br />
expected capital requirement or reserves<br />
• Two Good Things could happen:<br />
<strong>–</strong> Nobody gets wise<br />
<strong>–</strong> No loss event happens<br />
Planning for Luck - IS NOT RISK MANAGEMENT!!!<br />
Permission to reprint or distribute any content from this presentation requires the prior written approval of Standard & Poor’s.
18.<br />
Strategic Risk Management (SRM)<br />
• Why are we making SRM so important?<br />
• <strong>The</strong>re are some companies with Superior Risk Management<br />
that we will then be judging to be Adequate?!?<br />
<strong>–</strong> Companies with Superior Risk Management (Controls) will have low<br />
volatility of earnings and low incidence of losses.<br />
<strong>–</strong> Companies with Strong/Excellent <strong>ERM</strong> will have low volatility of earnings,<br />
low incidence of losses AND Steadily improving Returns.<br />
• Strategic Risk Management is the UPSIDE of Risk<br />
Management<br />
Permission to reprint or distribute any content from this presentation requires the prior written approval of Standard & Poor’s.
<strong>Economic</strong> <strong>Capital</strong><br />
And the S&P Insurer Rating Process<br />
Permission to reprint or distribute any content from this presentation requires the prior written approval of Standard & Poor’s.<br />
Copyright (c) 2006 Standard & Poor’s, a division of <strong>The</strong> McGraw-Hill Companies, Inc. All rights reserved.
20.<br />
Evaluating <strong>Economic</strong> <strong>Capital</strong> Models<br />
S&P is developing robust processes for evaluating insurers'<br />
internal economic capital models<br />
Dynamic approach will enhance our existing and prospective view of<br />
capital adequacy<br />
To be performed only for companies with effective/coordinated<br />
processes for risk control, emerging event management, riskmanagement<br />
culture, and risk models<br />
STRONG or EXCELLENT <strong>ERM</strong><br />
Evaluations of economic capital will be used in conjunction with<br />
existing static, risk-based measures<br />
Through evaluation of a robust economic capital model, S&P can incorporate<br />
benefits of uncorrelated risks (diversification)<br />
Insurers must have effective procedures for maintaining both<br />
risks and losses within predictable bounds<br />
Permission to reprint or distribute any content from this presentation requires the prior written approval of Standard & Poor’s.
21.<br />
<strong>Economic</strong> <strong>Capital</strong> Models<br />
Major Review Considerations:<br />
1. Risk Quantum<br />
2. General level of risks<br />
3. Company specific variations in level of risks.<br />
4. Company specific exposures & offsets<br />
5. Diversification effects<br />
6. Model robustness<br />
7. Model execution<br />
8. Model usage <strong>–</strong> specific<br />
9. Stress Tests<br />
Permission to reprint or distribute any content from this presentation requires the prior written approval of Standard & Poor’s.
22.<br />
Major <strong>EC</strong>M Review Considerations<br />
1. Risk Quantum <strong>–</strong> Definition of <strong>EC</strong> Value<br />
<strong>–</strong>Var vs. CTE<br />
<strong>–</strong>Time Frame<br />
<strong>–</strong>Confidence level<br />
<strong>–</strong>Open vs. Closed Fund<br />
2. General Level of Risks<br />
<strong>–</strong>How risky is the stock market?<br />
<strong>–</strong>How volatile are interest rates?<br />
<strong>–</strong>How much Credit risk at each rating level?<br />
<strong>–</strong>How much tail risk in from insurance & policyholder behavior?<br />
<strong>–</strong>How large is Operational Risk?<br />
Permission to reprint or distribute any content from this presentation requires the prior written approval of Standard & Poor’s.
23.<br />
Major <strong>EC</strong>M Review Considerations<br />
3. Company Specific Variations in level of risks<br />
<strong>–</strong>Due to specific restrictions<br />
<strong>–</strong>Due to favorable risk selection<br />
<strong>–</strong>Due to favorable risk divestiture<br />
<strong>–</strong>Due to other past or future management actions<br />
4. Company Specific exposures & Offsets<br />
<strong>–</strong>Detailed Company specific products & product features<br />
<strong>–</strong>Detailed Company specific investments<br />
<strong>–</strong>Detailed Company specific customer base<br />
<strong>–</strong>Company Specific markets and sub-markets<br />
Permission to reprint or distribute any content from this presentation requires the prior written approval of Standard & Poor’s.
24.<br />
Major <strong>EC</strong>M Review Considerations<br />
5. Diversification Effects<br />
<strong>–</strong>Source of Correlation assumptions & methodologies<br />
<strong>–</strong>Treatment of differences between tail correlation & loss distribution average<br />
correlation<br />
<strong>–</strong>Treatment of risks with low or negative alpha<br />
6. Model Robustness<br />
<strong>–</strong>Model vs. factor<br />
<strong>–</strong>Granularity<br />
<strong>–</strong>Approximations vs. exact<br />
<strong>–</strong>Scenarios vs. Stress<br />
<strong>–</strong>May vary by risk and by location<br />
<strong>–</strong>Materiality considerations<br />
<strong>–</strong>“State of the Art” considerations<br />
Permission to reprint or distribute any content from this presentation requires the prior written approval of Standard & Poor’s.
25.<br />
Major <strong>EC</strong>M Review Considerations<br />
7. Model Execution<br />
<strong>–</strong>IT infastructure<br />
<strong>–</strong>Model development <strong>–</strong> Internal vs. External<br />
<strong>–</strong>Custom vs. Standardized<br />
<strong>–</strong>Support Staff<br />
<strong>–</strong>Validation & Review Process<br />
<strong>–</strong>Documentation<br />
8. Model Usage<br />
<strong>–</strong>Steering <strong>–</strong> Strategic Risk Management<br />
<strong>–</strong>Trading <strong>–</strong> Product Pricing Usage<br />
<strong>–</strong>Risk Management <strong>–</strong> ALM, Hedging, etc.<br />
If <strong>EC</strong> model not used for any of these purposes, how are different models<br />
reconciled?<br />
Permission to reprint or distribute any content from this presentation requires the prior written approval of Standard & Poor’s.
26.<br />
Major <strong>EC</strong>M Considerations<br />
9. Stress Tests<br />
• Internal Stress tests and assumption sensitivity tests<br />
• Output Review <strong>–</strong> Summary and detailed<br />
• S&P scenario tests<br />
• S&P sample product tests<br />
• Risk Limit test (MP<strong>EC</strong>)<br />
Permission to reprint or distribute any content from this presentation requires the prior written approval of Standard & Poor’s.
Questions?<br />
Insurance <strong>ERM</strong> Evaluation Criteria<br />
on the web at<br />
www.erm.standardandpoors.com<br />
For further Information Contact:<br />
David Ingram<br />
+1 212 438 7104<br />
david_ingram@standardandpoors.com<br />
Permission to reprint or distribute any content from this presentation requires the prior written approval of Standard & Poor’s.<br />
Copyright (c) 2006 Standard & Poor’s, a division of <strong>The</strong> McGraw-Hill Companies, Inc. All rights reserved.
Regulatory<br />
Risk Based <strong>Capital</strong><br />
<strong>ERM</strong> <strong>Symposium</strong><br />
Chicago<br />
March 28-30, 2007<br />
Larry Bruning FSA, MAAA<br />
lbruning@ksinsurance.org
Regulatory RBC<br />
Purpose<br />
Overview of Current Structure<br />
Regulatory Updates<br />
2
Purpose of Regulatory RBC<br />
Minimum amount of capital needed to<br />
support the overall business operations<br />
considering the size and risk profile of<br />
the insurance company<br />
3
Purpose of Regulatory RBC<br />
5 Major Categories of Risk<br />
C-0 Asset Risk Affiliates<br />
C-1 Asset Risk <strong>–</strong> Other<br />
C-2 Insurance Risk<br />
C-3 Interest Rate, <strong>Market</strong> & Health Credit Risk<br />
C-4 Business Risk<br />
4
Current RBC Structure<br />
Regulatory Financial Solvency Measure<br />
Compares Total Adjusted <strong>Capital</strong> (TAC) to<br />
Authorized Control Level (ACL) RBC<br />
5
Current RBC Structure<br />
4 Regulatory Action Triggers<br />
Company Action Level (TAC 150% - 200% ACL)<br />
Regulatory Action Level (TAC 100% - 150% ACL)<br />
Authorized Control Level (TAC 70% - 100% ACL)<br />
Mandatory Control Level (TAC < 70% ACL)<br />
6
Current RBC Structure<br />
Regulatory Actions By Trigger<br />
Company Action Level (CFP)<br />
Regulatory Action Level (CFP + Examination / Analysis)<br />
Authorized Control Level (Authorizes Regulatory Action)<br />
Mandatory Control Level (Requires Regulatory Control)<br />
7
Current RBC Structure<br />
Authorized Control Level RBC = 50% of RBC after<br />
Covariance<br />
Total Adjusted <strong>Capital</strong> = Statutory <strong>Capital</strong> & Surplus (Total<br />
Net Worth) + Adjustments<br />
Examples of Adjustments - Asset Valuation Reserve, Half of<br />
Dividend Liability, Non-tabular Discounts, Medical<br />
Discounts<br />
8
9<br />
Current RBC Structure<br />
Life Company RBC after Covariance<br />
2<br />
)<br />
4<br />
(<br />
3<br />
2<br />
3<br />
1<br />
3<br />
1<br />
4<br />
0<br />
Component)<br />
Expense<br />
tive<br />
Administra<br />
(Health<br />
Risk<br />
Business<br />
4<br />
Component)<br />
Liability<br />
(Premium<br />
Business<br />
4<br />
Risk<br />
<strong>Market</strong><br />
3<br />
Risk<br />
Credit<br />
Health<br />
3<br />
Risk<br />
Rate<br />
Interest<br />
3<br />
Reserves)<br />
(NAR,<br />
Risk<br />
Insurance<br />
2<br />
Risk<br />
Asset<br />
Other<br />
All<br />
1<br />
Stock<br />
Insurance<br />
Non<br />
liated<br />
Stock/Affi<br />
Common<br />
ed<br />
Unaffiliat<br />
1<br />
0<br />
)<br />
4<br />
(<br />
3<br />
2<br />
3<br />
1<br />
3<br />
1<br />
4<br />
0<br />
2<br />
2<br />
2<br />
2<br />
2<br />
2<br />
2<br />
2<br />
2<br />
2<br />
b<br />
C<br />
b)<br />
(C<br />
)<br />
(C<br />
c)<br />
C<br />
cs<br />
(C<br />
a)<br />
C<br />
o<br />
(C<br />
a<br />
C<br />
C<br />
ACL<br />
b<br />
C<br />
a<br />
C<br />
c<br />
C<br />
b<br />
C<br />
a<br />
C<br />
C<br />
o<br />
C<br />
cs<br />
C<br />
sets RBC<br />
Company As<br />
Insurance<br />
Affiliated<br />
C<br />
where<br />
b<br />
C<br />
b)<br />
(C<br />
)<br />
(C<br />
c)<br />
C<br />
cs<br />
(C<br />
a)<br />
C<br />
o<br />
(C<br />
a<br />
C<br />
C<br />
+<br />
+<br />
+<br />
+<br />
+<br />
+<br />
+<br />
+<br />
=<br />
=<br />
=<br />
=<br />
=<br />
=<br />
=<br />
=<br />
−<br />
=<br />
=<br />
+<br />
+<br />
+<br />
+<br />
+<br />
+<br />
+<br />
+
Regulatory Updates<br />
Goal: Replace the current factor based approach with a<br />
principles-based approach to determining the C-3 component<br />
of RBC (PBA = Stochastic Modeling with CTE Statistic)<br />
C-3 Phase I <strong>–</strong> Fixed Annuities and Single Premium Life Insurance<br />
C-3 Phase II <strong>–</strong> Variable Annuity Guaranteed Benefits<br />
C-3 Phase III <strong>–</strong> All Other Life Insurance and Indexed Annuities<br />
10
C-3 Phase I<br />
Regulatory Updates<br />
January 2006 AAA releases an enhanced C-3 Phase I<br />
interest rate generator<br />
Produces interest rate scenarios based on a specified<br />
yield curve using the same model parameters as original<br />
generator<br />
Predetermined scenario sets (12 or 50) no longer provided<br />
Development of Calibration Criteria for insurers using<br />
internal interest rate models<br />
11
C-3 Phase I<br />
Regulatory Updates<br />
C-3 Phase I testing required for companies with assets<br />
exceeding $ 100 million<br />
C-3 Phase I testing required for companies with assets<br />
less than $ 100 million if fail significance test, the stress<br />
test or elect to do C-3 testing on a continuing basis<br />
12
Regulatory Updates<br />
C-3 Phase II<br />
CARVM Expense Allowance recovery risk adjusted for<br />
liabilities subject to C-3 Phase II testing<br />
Actuarial Certification instructions clarified<br />
Added section to require Actuarial Memorandum to be<br />
completed<br />
Standard Scenario equity class changed from two 10%<br />
drops to one 20% drop and balanced class changed<br />
from two 6% drops to one 12% drop<br />
C-3 Phase II results subgroup analysis completed in<br />
2006 recommendations to follow<br />
13
Regulatory Updates<br />
C-3 Phase III ???<br />
AAA Life <strong>Capital</strong> Adequacy Subcommittee (LCAS) formed:<br />
(1) Life <strong>Capital</strong> working group 2005<br />
(2) Annuity <strong>Capital</strong> working group 2006<br />
Goal: Single integrated framework for C-3 risk evaluated<br />
using a principles-based approach to risk<br />
measurement<br />
14
Regulatory Updates<br />
Implications of restructuring<br />
Consistency in economic scenario generators across product lines<br />
Consistency in principles underlying risk measurement<br />
Elimination of reference to phases<br />
C-3 Phase I (annuity) and C-3 Phase II covered under ACWG<br />
C-3 Phase I (single premium life) covered under LCWG<br />
15
Regulatory Risk Based <strong>Capital</strong><br />
Questions ?<br />
16