Implementation and Uses of Economic Capital ... - ERM Symposium
Implementation and Uses of Economic Capital ... - ERM Symposium
Implementation and Uses of Economic Capital ... - ERM Symposium

Create successful ePaper yourself
Turn your PDF publications into a flip-book with our unique Google optimized e-Paper software.
Use <strong>of</strong> <strong>Economic</strong> <strong>Capital</strong> for<br />
Performance Management<br />
Mike Murphy<br />
Head <strong>of</strong> USFS Financial Risk Management<br />
<strong>ERM</strong> S<strong>Symposium</strong> mposi m – April 2008<br />
Concurrent Session 1: <strong>Implementation</strong> <strong>and</strong> <strong>Uses</strong> <strong>of</strong> <strong>Economic</strong> <strong>Capital</strong> – CRO Panel
What is <strong>Economic</strong> <strong>Capital</strong> <strong>and</strong> Why is it Valuable?<br />
Discussion Items<br />
• Definition <strong>of</strong> <strong>Economic</strong> <strong>Capital</strong> (EC)<br />
• Role <strong>of</strong> EC at ING<br />
• EC as Performance Measurement & Management Tool<br />
• Future Applications <strong>of</strong> EC in Performance Management<br />
Retirement - Insurance - Investments 1
Definition <strong>of</strong> <strong>Economic</strong> <strong>Capital</strong> (“EC”)<br />
The amount <strong>of</strong> capital required to protect the market value<br />
<strong>of</strong> the liabilities within a 99.95% confidence interval based<br />
on shocks that could occur over a 1-year time horizon<br />
• Maximum loss approach pp within a confidence interval over one yyear<br />
is<br />
consistent with Solvency II<br />
• 99.95% confidence interval consistent with AA rating, <strong>and</strong> more<br />
conservative than Solvency II minimum <strong>of</strong> 99.5%<br />
• Market Value <strong>of</strong> Liabilities (“MVL”) is the value at which the liabilities<br />
could be transferred to a willing, rational, diversified counterparty in an<br />
arms’ length g transaction <strong>and</strong> in an orderly y manner<br />
• The risk that is captured in the capital also relates to uncertainties<br />
beyond the 1-year period through the MVL<br />
Retirement - Insurance - Investments 2
<strong>Capital</strong> held for Risk Types that Correspond to Sources<br />
<strong>of</strong> <strong>Economic</strong> Loss<br />
Financial risk Credit &<br />
Transfer risk<br />
Insurance risk Operational risk Business risk<br />
Changes in Changes in the Deviations from Unexpected Deviations from<br />
financial markets<br />
which would<br />
impact the market<br />
value <strong>of</strong> assets<br />
<strong>and</strong> a d liabilities ab tes<br />
(including options<br />
in assets <strong>and</strong><br />
liabilities) from:<br />
• Interest rates<br />
• Equity prices<br />
• Real estate<br />
• Credit spreads<br />
• Implied vols<br />
• Currency rates<br />
credit quality <strong>of</strong><br />
assets,<br />
reinsurance<br />
receivables <strong>and</strong><br />
counterparties,<br />
coutepates, including default.<br />
The recovery risk<br />
in case <strong>of</strong> default<br />
or loss <strong>of</strong> value<br />
due to migration.<br />
Transfer risk is<br />
related to the<br />
inability to<br />
repatriate or<br />
transfer<br />
shareholder value<br />
due to restrictions<br />
best estimate<br />
claims<br />
development,<br />
including size,<br />
frequency eque cy a<strong>and</strong> d<br />
timing <strong>of</strong> both<br />
level <strong>and</strong> long<br />
term trend,<br />
covering:<br />
• Mortality<br />
• Morbidity<br />
• Longevity risk<br />
• Property<br />
• Casualty<br />
• NATCAT<br />
events such as<br />
processing<br />
errors, fraud,<br />
systems failures,<br />
litigation, t gat o ,<br />
regulatory or<br />
compliance<br />
breaches, etc.<br />
Carefully taking <strong>and</strong> managing these risks is how to create value<br />
Retirement - Insurance - Investments 3<br />
best estimates on<br />
business<br />
expenses, lapses<br />
/ persistency <strong>and</strong><br />
future utu e ppremium e u<br />
re-rating
<strong>Economic</strong> <strong>Capital</strong> is a more complete measure <strong>of</strong><br />
Required Risk <strong>Capital</strong><br />
• Aptly reflects the specific risks <strong>of</strong> the business<br />
• Appropriately recognizes diversification<br />
• Does not rely on market risk premiums to ensure solvency<br />
• Captures risks not measured by RBC <strong>and</strong> Rating Agency<br />
models (e.g., business risk, market volatility, credit<br />
spreads) p )<br />
• Reports <strong>and</strong> analyzes risks across all entities in holistic,<br />
consistent manner<br />
• Explicitly incorporates commitment <strong>of</strong> our parent <strong>and</strong><br />
diversification <strong>of</strong> risk available from worldwide operations<br />
Retirement - Insurance - Investments 4
EC/internal risk model supports the roles <strong>of</strong> <strong>ERM</strong><br />
Risk<br />
Disclosure<br />
Risk<br />
Strategy<br />
Risk<br />
Reporting/<br />
Controlling<br />
Risk<br />
Underwriting<br />
Purpose<br />
Risks <strong>and</strong> strategy are transparent to<br />
internal <strong>and</strong> external stakeholders to<br />
support an appropriate evaluation<br />
Delegated authorities are consistent<br />
with the overall Group strategy for<br />
pr<strong>of</strong>itable growth <strong>and</strong> the Group’s<br />
risk appetite<br />
Ri Risk k pr<strong>of</strong>ile fil iis ttransparent, t e.g. “ “no<br />
surprises”, <strong>and</strong> consistent with<br />
authorities <strong>and</strong> limits delegated by<br />
the Group<br />
Products <strong>and</strong> portfolios are<br />
structured, underwritten, priced,<br />
approved <strong>and</strong> managed<br />
appropriately<br />
Retirement - Insurance - Investments 5<br />
Examples<br />
• Investor disclosures –<br />
substantially improved in 07/08<br />
• IFRS 7 Risk Paragraph<br />
• Basis for Solvency II/QIS 4<br />
• Establish Risk Appetite<br />
• Strategic Planning:<br />
EC/limits/value metrics<br />
• <strong>Capital</strong> Management & Planning<br />
• Ri Risk k Dashboard D hb d<br />
• MVaR limit structure<br />
• EC <strong>and</strong> MVS quarterly<br />
• Innovative EC system ties to<br />
market risk analysis<br />
• PARP <strong>and</strong> NICARP for product<br />
approval <strong>of</strong> ins./inv. products<br />
• SoPs/Guidelines<br />
• Value metrics for new business-<br />
IRR <strong>and</strong> d market k t consistent<br />
i t t
EC/<strong>ERM</strong> requires continually improving Risk<br />
Measurement, Reporting <strong>and</strong> Management<br />
Management<br />
Control<br />
Measurement<br />
2004:<br />
2007:<br />
New ECAPS system developed <strong>and</strong> implemented<br />
Enhanced quarterly q y reporting p g <strong>of</strong> MV balance sheet <strong>and</strong> risk limits<br />
9/2007 External publication <strong>of</strong> EC, with fully audited reporting by 12/07<br />
Exp<strong>and</strong>ed IRM St<strong>and</strong>ards <strong>of</strong> Practice to tighten risk governance<br />
2006:<br />
MC Pricing g requirements q in PARP<br />
Full migration <strong>of</strong> EC, MVaR, MCEV(0) review <strong>and</strong> hotspots<br />
into planning process<br />
Focus on auditable, efficient risk <strong>and</strong> value reporting<br />
processes<br />
Risk governance g framework<br />
2005:<br />
Board & ALCO approval to further implement EC<br />
Input in MTP: MVaR limits<br />
MC Pricing g s<strong>of</strong>t targets g<br />
EC results used to calibrate ICM<br />
1999/2000<br />
Start EC Pilots<br />
Retirement - Insurance - Investments 6
Adoption <strong>of</strong> EC supports Management to make better<br />
informed decisions<br />
Management Aspect Business Benefits<br />
<strong>Capital</strong> Management • Optimizing the asset allocation strategies, both at product <strong>and</strong> aggregate level<br />
Risk Management<br />
• Managing <strong>and</strong> allocating Group capital more efficiently, to maximize value creation<br />
• Provides an improved underst<strong>and</strong>ing <strong>of</strong> risks to avoid costly mistakes<br />
PPerformance f Measurement M t • BBusiness i iis managed d bbased d on ttrue underlying d l i economics, i management t iincentives ti are<br />
aligned to “Managing for Value” objectives <strong>and</strong> to develop strategies which create value <strong>and</strong><br />
balance risk<br />
Product Management • Optimizing the business mix according to the value creation potential <strong>of</strong> products<br />
• Different products become comparable under this framework, e.g., able to compare the<br />
pr<strong>of</strong>itability <strong>of</strong> a VA in the US <strong>and</strong> Japan, which up to now is very difficult due to<br />
differences in economic assumptions, risk pr<strong>of</strong>ile, etc.<br />
• Improved definition <strong>of</strong> value is important to “Managing for Value”<br />
• Implement value improvements to the in-force block <strong>of</strong> business<br />
• Pricing according to market consistent principles (i.e., a fair price for the risk taken)<br />
Increased value creation leads to increased Total Shareholder Return<br />
Retirement - Insurance - Investments 7
The Executive Board defines Risk Appetite<br />
Risk appetite sets boundaries…<br />
Spare risk<br />
taking<br />
capacity<br />
BU risk i k<br />
appetite<br />
Actual BU risk<br />
pr<strong>of</strong>ile<br />
Breach <strong>of</strong><br />
risk i k<br />
appetite<br />
Actual risk pr<strong>of</strong>ile is monitored against the risk<br />
appetite (in part through the dashboard)<br />
The role <strong>of</strong> the business is to maximize value<br />
within these bounds<br />
Group intervenes when there are material<br />
breaches<br />
Risk appetite is a core consideration in the<br />
strategic planning process<br />
Retirement - Insurance - Investments 8<br />
…across multiple dimensions<br />
Earnings at Risk (EaR)<br />
<strong>Capital</strong> at Risk (CaR)<br />
Based on stressed scenarios<br />
Risk management metrics<br />
presented in the Risk Dashboard<br />
<strong>Economic</strong> <strong>Capital</strong><br />
Based on extreme stress scenarios<br />
Defines internal view <strong>of</strong> solvency<br />
capital requirements
The Risk Dashboard summarizes risk position against<br />
risk appetite triggers<br />
Earnings at Risk<br />
Current risk pr<strong>of</strong>ile<br />
-- Restatement 2006 Q4 --<br />
Restatement 2006 Q4 MARKET RISKS<br />
Credit & Interest<br />
Real<br />
Non<br />
financial<br />
Earnings 06 (pre EaR / Earnings<br />
€ MM<br />
transfer rate Equity Estate FX Insurance risks Total<br />
tax)<br />
2006<br />
Total Wholesale 670 120 45 274<br />
6<br />
- 168 1,283<br />
2,525<br />
51%<br />
Total Retail 436 47 4 -<br />
0<br />
-<br />
55 542<br />
1,932<br />
28%<br />
Total ING Direct 120 112 -<br />
-<br />
-<br />
-<br />
27 259<br />
717<br />
36%<br />
Corporate line (Bank) -<br />
9 -<br />
-<br />
15<br />
-<br />
0<br />
25<br />
(102)<br />
NA<br />
Total ING Bank 1,226 288 49 274 21<br />
- 251 2,110<br />
5,072<br />
42%<br />
Insurance Americas 59 36 92 8 -<br />
19 76 281<br />
1,992<br />
14%<br />
Insurance Asia Pacific 21 5 4 2 61<br />
7 41 140<br />
621 621<br />
23%<br />
Insurance Europe 25 15 5 369<br />
2<br />
18 51 485<br />
2,328<br />
21%<br />
Corporate line (Insurance) 1 24 -<br />
-<br />
84<br />
-<br />
-<br />
108<br />
(55)<br />
NA<br />
Total ING Insurance 107 79 100 378 146<br />
44 169 1,014<br />
4,886<br />
21%<br />
Total ING Group 1,332<br />
<strong>Capital</strong> at Risk<br />
367<br />
149<br />
652<br />
Restatement 2006 Q4 MARKET RISKS<br />
Non<br />
Available CaR / Available<br />
Credit & Interest<br />
Real<br />
financial<br />
Financial<br />
Financial<br />
€ MM<br />
transfer rate Equity Estate FX Insurance risks Total Resources * Resources *<br />
Total Wholesale 629 179 59 267<br />
6<br />
- 120 1,259<br />
Total Retail 347 67 117 23<br />
0<br />
-<br />
38 591<br />
Total ING Direct 276 205 -<br />
3 -<br />
-<br />
18 502<br />
Corporate line (Bank) -<br />
-<br />
-<br />
-<br />
57<br />
-<br />
0<br />
57<br />
Total ING Bank 1,252 451 176 293 63<br />
- 176 2,410<br />
25,822 25,822<br />
9%<br />
Insurance Americas 181 410 469 0 156<br />
56 74 1,346<br />
Insurance Asia Pacific 64 1,588 90 12 98 234 45 2,131<br />
Insurance Europe 137 218 835 338 14<br />
58 43 1,642<br />
Corporate line (Insurance) - 514 -<br />
-<br />
304<br />
-<br />
-<br />
817<br />
Total ING Insurance 382 2,730 1,394 350 572 348 161 5,936<br />
27,200<br />
22%<br />
Total ING Group 1,634<br />
Traffic light trigger points<br />
EaR expressed as % forecast earnings<br />
CaR expressed as % AFR<br />
EaR LoBs<br />
EaR<br />
Group CaR Total<br />
Red 100% 50% 40%<br />
Amber 50% 40% 20%<br />
Green 0% 0% 0%<br />
3,180<br />
1,569<br />
Retirement - Insurance - Investments 9<br />
644<br />
167<br />
634<br />
44<br />
348<br />
420<br />
338<br />
3,123<br />
8,347<br />
9,958<br />
48,812<br />
31%<br />
17%
Risk Dashboard provides an overview <strong>of</strong> risks in the Group<br />
Role <strong>of</strong> the Risk Dashboard<br />
Practical use <strong>of</strong> the Risk Dashboard<br />
• The dashboard allows the<br />
Executive Board to take strategic<br />
decisions using comparable risk<br />
measures<br />
•<br />
•<br />
Risk metrics presented in the Risk<br />
DDashboard hb d tto th the EExecutive ti BBoard d<br />
on quarterly basis<br />
Key tool in monitoring the adherence<br />
<strong>of</strong> risk taking to the risk appetite<br />
• EE.g. g 1 unit <strong>of</strong> equity risk can be<br />
compared to 1 unit <strong>of</strong> insurance<br />
• Ri Risk k iissues are an iintegral t l part t <strong>of</strong> f<br />
the strategic planning process<br />
•<br />
risk<br />
This is a powerful management<br />
ttooll • Allows risk vs. return trade-<strong>of</strong>fs to<br />
be made<br />
• Shows how risk taking cascades<br />
through the Group<br />
• Aids in identifying “hotspots”<br />
• Ensures management focus is on<br />
more material t i l risks/portfolios<br />
i k / tf li<br />
•<br />
•<br />
Risk increasingly supporting<br />
strategic decision making, rather<br />
than simply being “budgeted” budgeted<br />
Dashboard will be audited <strong>and</strong><br />
reported annually, as part <strong>of</strong> the<br />
normal IFRS disclosure process<br />
Retirement - Insurance - Investments 10
Implementing a similar approach to set US Risk Appetite<br />
<strong>and</strong> support decision-making process<br />
ING Group Risk Appetite<br />
• EaR = % <strong>of</strong> Group forecast earnings<br />
• CaR = % <strong>of</strong> Group available financial<br />
resources<br />
• ING Group’s risk appetite has been defined <strong>and</strong> is<br />
measured regularly<br />
• Diversification between bank, insurance, risk factors <strong>and</strong><br />
geographies is fully taken into account<br />
• EaR diversification approach between risk factors <strong>and</strong><br />
US Risk Appetite<br />
business units needs to be developed<br />
• EaR = % <strong>of</strong> US forecast earnings<br />
•<br />
•<br />
The US risk appetite needs to be further defined<br />
The % <strong>of</strong> earnings <strong>and</strong> available financial resources the<br />
• CaR = % <strong>of</strong> US available financial US can put p at stake depends p on the appetite pp <strong>of</strong> senior<br />
resources<br />
leaders for volatility in earnings <strong>and</strong> capital<br />
• A high range is limited by the stated Group risk appetite<br />
Transaction approval:<br />
• EaR vs. forecast earnings<br />
• CaR vs. forecast earnings<br />
• Within overall US risk appetite<br />
Retirement - Insurance - Investments 11<br />
• Develop criteria to evaluate major transactions/projects;<br />
streamline decision-making <strong>and</strong> approval process<br />
• Minimum requirements for EaR/CaR vs forecast earnings<br />
• Transactions can be added to the portfolio when the total<br />
risk appetite has not been breached;<br />
• <strong>and</strong> when the US/BU is within its MVaR limit
Example <strong>of</strong> EC approach within the Retail Life Business<br />
• Largest element <strong>of</strong> EC is Market Risk, with risk <strong>of</strong> loss from movement in interest rates<br />
• Success <strong>of</strong> ALM drives optimization <strong>of</strong> Market Risk EC<br />
• Consider out-<strong>of</strong>-the out <strong>of</strong> the money hedges to limit tail risk<br />
11%<br />
14%<br />
11%<br />
12%<br />
52%<br />
Market Risk<br />
Business Risk<br />
Credit Risk<br />
Insurance Risk<br />
Operational Risk<br />
• Not optimum risk distribution for Life insurance business<br />
• EC tools support direction for future management actions<br />
• Increase mortality exposure → “Term Strategy”<br />
• Reduce market risk exposure → Lengthen asset duration<br />
• Reduce market risk exposure → Reduce exposure to volatile asset types<br />
• Improve distribution <strong>of</strong> risk → Increase diversification benefit<br />
Retirement - Insurance - Investments 12
Future Expected Management <strong>Uses</strong> <strong>of</strong> EC as a<br />
Performance Management Tool<br />
• Pricing<br />
• Complexity <strong>of</strong> market consistent pricing<br />
• Volatility <strong>of</strong> EC results<br />
• NNeed d tto provide id ffor regulatory l t capital it l<br />
• Evolution <strong>of</strong> methodology<br />
• Compensation<br />
• Volatility <strong>of</strong> EC results<br />
• Lack <strong>of</strong> full underst<strong>and</strong>ing by senior leaders<br />
• Evolution <strong>of</strong> methodology<br />
Retirement - Insurance - Investments 13
Concluding Remarks<br />
• ING has been using <strong>Economic</strong> <strong>Capital</strong> approach internally for many<br />
years to support management decisions within <strong>ERM</strong> framework<br />
• Use EC <strong>and</strong> market consistent techniques to manage business at all<br />
levels<br />
• PProduct d t design, d i pricing i i <strong>and</strong> d approval l<br />
• Setting risk/reward strategy<br />
• Risk, capital <strong>and</strong> value management <strong>and</strong> reporting<br />
• EC framework is well suited for managing the business<br />
• Based on best-in-class models<br />
• Consistent with direction <strong>of</strong> Solvency y II<br />
• Provides results we believe reflects the economics <strong>of</strong> the business<br />
• Provides appropriate incentives for capital <strong>and</strong> risk management<br />
Retirement - Insurance - Investments 14
Development <strong>of</strong> EC using Stress testing <strong>and</strong><br />
linkage with capital management framework<br />
Anant Bhalla<br />
Vice President – Strategic Decisioning<br />
Ameriprise Financial Inc.<br />
April 15, 2008<br />
Concurrent Session 1: <strong>Implementation</strong> <strong>and</strong> <strong>Uses</strong> <strong>of</strong> <strong>Economic</strong> <strong>Capital</strong><br />
The views expressed in this presentation are those <strong>of</strong> the presenter <strong>and</strong> do not represent the views <strong>of</strong> Ameriprise Financial, Inc.
Key technical elements <strong>of</strong> the EC measurement framework<br />
Definition <strong>of</strong> Required <strong>Economic</strong> <strong>Capital</strong> (REC)<br />
Amount <strong>of</strong> resources required to protect against economic insolvency due to<br />
changes in value over a specified time horizon <strong>and</strong> confidence interval<br />
Financial<br />
framework<br />
Tailored to<br />
each risk<br />
Time<br />
horizon<br />
Confidence<br />
level<br />
2
The Financial Framework<br />
Determine Determination Available Value Value Determine Change (possible loss) in Value<br />
(MVA)<br />
Market<br />
value <strong>of</strong><br />
assets<br />
Available<br />
<strong>Economic</strong><br />
<strong>Capital</strong><br />
(AEC)<br />
(MCVL)<br />
Market<br />
consistent<br />
value <strong>of</strong><br />
liabilities<br />
(MVA)<br />
Market<br />
value <strong>of</strong><br />
assets<br />
AEC<br />
(MCVL)<br />
Market<br />
consistent<br />
value <strong>of</strong><br />
liabilities<br />
(REC)<br />
Required<br />
<strong>Economic</strong><br />
<strong>Capital</strong><br />
Normal (Base) Condition Stressed Condition For Each<br />
Risk Driver<br />
3
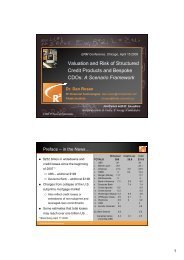
The rationale behind using a stress testing based approach<br />
A ‘Pure’ Stochastic Simulation approach would require stochastic-on-stochastic projections to<br />
estimate market values at future points <strong>of</strong> time across all real-world scenarios in order to construct<br />
a distribution <strong>of</strong> change in economic value. This is computationally “extremely” intense, possibly<br />
impractical in certain environments.<br />
‘Secondary risk neutral scenarios’: Used to<br />
define market value at each point <strong>of</strong> time in<br />
the future.<br />
t = 1<br />
t = 2<br />
. . .<br />
t = 3<br />
‘Primary real-world scenarios’: Used to produce a<br />
range/distribution <strong>of</strong> “change in economic value” that<br />
is then used to identify the desired level <strong>of</strong> stress.<br />
Some Alternatives pursued by others:<br />
-“Brute force”: Run the embedded projection at each future time force. Impractical in some modeling environments.<br />
- Replicating portfolio to map assets & liabilities to a small set <strong>of</strong> st<strong>and</strong>ard financial instruments, thereby reducing the<br />
time required to generate market value projections in the future.<br />
- Mathematical techniques for estimation <strong>of</strong> future values (e.g. pre-generated 1000’s <strong>of</strong> “like” scenarios, matrices).<br />
Stress Testing Approach: Apply a pre-determined level <strong>of</strong> real world stress, based on desired<br />
confidence level, to the normal (base) condition market value balance sheet to determine the change<br />
in value over the desired time horizon (one year). This approach is robust <strong>and</strong> it elegantly addresses<br />
the implementation difficulties <strong>of</strong> the pure stochastic simulation approach.
Calculating required EC via stress testing: 4 stages to implementation<br />
Developing an economic<br />
view <strong>of</strong> the business<br />
Identify key risks <strong>and</strong><br />
determine level <strong>of</strong> stress<br />
to be applied<br />
Apply stresses to the<br />
economic balance sheet<br />
Aggregate individual risk<br />
capital results, allowing<br />
for correlation effects<br />
<strong>Economic</strong> assessment <strong>of</strong> assets, liabilities <strong>and</strong><br />
net available capital using risk neutral principles<br />
Real world stress events for each key risk<br />
Reassess value <strong>of</strong> assets, liabilities <strong>and</strong> net<br />
available capital under each risk stress<br />
Change in net available capital for each risk is the<br />
required economic capital (REC) for the risk.<br />
Total REC across risks for aggregate requirement<br />
5
The key risks that financial services firms may consider include:<br />
Risks<br />
Financial Risks Non-Financial Risks<br />
Market Risks Credit Risks Client Behavior<br />
Equity Level Default<br />
Equity Volatility Ratings Migration<br />
Interest Rates Spread Volatility<br />
Foreign Exchange<br />
Property Price<br />
Alternative Assets<br />
Counterparty<br />
Concentration Risk<br />
Subcategories for each<br />
include:<br />
•Catastrophe<br />
•Trend<br />
•Parameter & mis-estimation<br />
Exits People<br />
Utilization <strong>of</strong><br />
Product Optionality<br />
Process<br />
Expense Risk Systems<br />
Br<strong>and</strong> Risk<br />
(Catastrophic Client Exits)<br />
Insurance /Underwriting<br />
Mortality / Longevity<br />
Morbidity<br />
Property & Casualty<br />
Operational Risk<br />
Regulatory<br />
Legal<br />
Strategic Risks
How to determine the stressed conditions for each key risk driver?<br />
For each risk define the level <strong>of</strong> stress at the appropriate level <strong>of</strong> granularity<br />
E.g. Credit risk for at individual rating by asset class level (AAA Credit card ABS). Possibly<br />
differentiate based on underlying collateral features/vintages (2006 vs. 2004)<br />
Historical data based techniques to define stress level<br />
• Parametric approaches (e.g. ‘Best fit’ distributions)<br />
• Interpolation techniques<br />
Expert judgment & analysis based if historical data availability is limited<br />
Key points to consider when defining stress levels for any risk:<br />
• Non-normality <strong>and</strong> rich set <strong>of</strong> fatter tail distributions<br />
• Non linearity <strong>of</strong> dynamic functions (e.g. client behavior)<br />
• Second order risks (e.g. convexity) <strong>and</strong> cross-greek effects<br />
• Robust basis for judgments where “missing or lack” historical data<br />
• Relevant historical time frame (e.g. regime changes)<br />
• Relative vs. Absolute changes
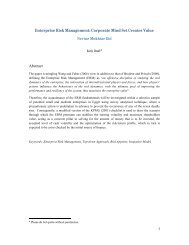
Example <strong>of</strong> Stressing Key Risks: Equity level <strong>and</strong> volatility<br />
Equity level stress<br />
Specific level shocks by equity index (S&P 500, EAFE,<br />
Russell) e.g. S&P 500: 30+% stress over 1 year<br />
Time period: Balance between relevant regime <strong>and</strong><br />
statistically significant data points<br />
Distribution <strong>of</strong> results: Lognormal<br />
Equity volatility stress<br />
Extremely high degree <strong>of</strong> correlation between equity<br />
level stress <strong>and</strong> elevated equity volatility<br />
•‘Stressed’ volatility is elevated volatility after 1 year equity<br />
level shock, not instantaneous short lived volatility peak<br />
Implied vs. historical realized volatility<br />
Full term structure <strong>of</strong> volatility (30 day to 10/15 year)<br />
Full Volatility surface (impractical for now)<br />
Build methodology to stress volatility despite very<br />
limited historical data on few points <strong>of</strong> the curve.<br />
frequency<br />
60<br />
50<br />
40<br />
30<br />
20<br />
10<br />
0<br />
S&P 500 annual log returns<br />
Compared to the lognormal distribution<br />
historical data (1950-2007)<br />
lognormal distribution<br />
LTCM, Russian<br />
default (1998)<br />
log returns<br />
VIX (S&P500 options)<br />
Dot-com bubble
Example <strong>of</strong> Stressing Key Risks: Interest rate levels<br />
A Company can use Principal Component Analysis (PCA)<br />
to derive their worst case yield curve movement<br />
One approach used to identify this worst case yield curve<br />
movement is to generate 10,000 real world yield curve<br />
movements using PCA <strong>and</strong> then calculate the resulting<br />
impact on the market value <strong>of</strong> assets <strong>and</strong> liabilities for all<br />
the 10,000 scenarios (e.g. nested simulation or estimation<br />
using key rate durations).<br />
Alternatively, a firm may choose to determine the targeted<br />
(99.x%) real world principle component stresses (3x2)<br />
<strong>and</strong> for each calculate required economic capital (REC)<br />
Illustrative<br />
• The aggregate interest rate REC = SQRT (MAX PC 1 2 + MAX PC2 2 + MAX PC3 2 )<br />
PCA allows yield curve movements to be decomposed into their primary drivers<br />
• Principal Component 1: Yield curve shifts<br />
The most important movement is an upwards or downward shift in the whole yield curve<br />
This typically explains over 70% <strong>of</strong> all yield curve movements<br />
• Principal Component 2: Yield curve twist<br />
Represents twisting <strong>of</strong> the yield curve (Around the 1 year rate)<br />
This normally accounts for an additional 15-25% <strong>of</strong> the variance <strong>of</strong> the yield curve<br />
• Principal Component 3: Yield curve inflection, bending or tilt<br />
Additional principle components become less intuitive <strong>and</strong> explain less than 2% <strong>of</strong> movements
Aggregating results across risks for one business:<br />
The use <strong>of</strong> correlation matrices has been the dominant industry trend<br />
Correlation matrix<br />
• By pair <strong>of</strong> tail risk events (e.g. equity level <strong>and</strong> interest rate level)<br />
• In the tails, not average over time<br />
• Based on historical data <strong>and</strong> expert judgment (where data is limited)<br />
• Emerging as the best practice across the industry with increasing degree <strong>of</strong><br />
convergence in the range <strong>of</strong> values across different users<br />
• Correlation at the lowest level <strong>of</strong> risk drivers (sub-components <strong>of</strong> risk) not just between<br />
major risk categories (like equity, interest rate, credit)<br />
• Test correlations by evaluating vs. specific scenarios with no assumed correlation<br />
Historical extreme events like 1987 market crash, Russian default 1998, 2001, 2008<br />
Hypothetical scenarios like inflation spike, increased leverage in the system widening spreads<br />
Copula (a set <strong>of</strong> fitted correlation distributions)<br />
• A newer practice. May be challenged by lack <strong>of</strong> data to fit distributions<br />
• Can be difficult to explain results & business linkages to management
Aggregating Results across businesses: One Enterprise View<br />
The diversification between risks is captured with the risk correlation matrix<br />
Additionally diversification benefit is seen between business units due to<br />
portfolio effect. This can be quantified using an “in <strong>and</strong> out” type analysis.<br />
Hypothetical<br />
illustration<br />
for two<br />
Business<br />
units (BU)<br />
Sum<br />
<strong>of</strong><br />
BU-1<br />
risks<br />
Sum<br />
<strong>of</strong><br />
BU-2<br />
risks<br />
Risk 1<br />
Risk 2<br />
Risk 3<br />
Risk 4 St<strong>and</strong>alone<br />
BU-1<br />
Risk 1<br />
Required<br />
EC<br />
Risk 2<br />
Risk 3<br />
Risk 4<br />
Diversification<br />
between risks<br />
within a single<br />
business unit<br />
St<strong>and</strong>alone<br />
BU-2<br />
Required EC<br />
Diversification<br />
<strong>of</strong> risks between<br />
different<br />
business units<br />
(portfolio effect)<br />
Aggregate<br />
Enterprise<br />
Required EC<br />
BU-1<br />
BU-2
Linkage <strong>of</strong> EC with capital management framework<br />
EC usually starts as a corporate initiative with a focus on assessing capital<br />
adequacy <strong>and</strong> planning.<br />
Subsequent applications embed the discipline down in the business units<br />
<strong>Capital</strong><br />
Adequacy<br />
Organization<br />
wide<br />
adoption &<br />
knowledge<br />
transfer<br />
<strong>Capital</strong> Efficiency <strong>Capital</strong> Protection<br />
Start
Evolution <strong>of</strong> usage for capital management<br />
Meeting the User Test<br />
<strong>Capital</strong><br />
measurement<br />
Introduction <strong>of</strong> risk<br />
sensitive measures <strong>of</strong><br />
capital requirements at<br />
corporate level<br />
First benefits: largely intangible<br />
insights into business steering<br />
Large scale risk avoidance can<br />
result in significant tangibles<br />
gains<br />
Business unit comparative<br />
pr<strong>of</strong>itability analysis<br />
Risk transfer optimization at the<br />
corporate level<br />
Pro-active approach to<br />
management <strong>of</strong> capital<br />
resources<br />
<strong>Capital</strong><br />
management<br />
Embedding <strong>of</strong> the risk capital<br />
metrics in the day-to-day<br />
business unit operations<br />
Increasing uses in business<br />
units<br />
Business units realize<br />
implications <strong>of</strong> applying risk<br />
measurements<br />
Business units underst<strong>and</strong><br />
measures well enough to be<br />
able to plan using risk adjusted<br />
pr<strong>of</strong>itability
Evolution <strong>of</strong> usage for capital management<br />
Application<br />
<strong>Capital</strong> allocation <strong>and</strong> planning<br />
Strategic risk management<br />
ALM/ corporate investments<br />
Pricing<br />
Product design<br />
Risk transfer / mitigation strategy<br />
Performance management<br />
Executive compensation<br />
External communication<br />
Short<br />
term<br />
Mid<br />
term<br />
Corporate vs. BU<br />
Corporate<br />
Corporate<br />
BU/ corporate<br />
BU<br />
BU<br />
Corporate/ BU<br />
Corporate<br />
Corporate<br />
Corporate<br />
Long<br />
term<br />
<strong>Implementation</strong> horizon
Charlie Shamieh<br />
Executive Director, Enterprise Risk Management<br />
2008 <strong>ERM</strong> <strong>Symposium</strong><br />
<strong>Implementation</strong> <strong>and</strong> <strong>Uses</strong> <strong>of</strong> <strong>Economic</strong> <strong>Capital</strong> – CRO Panel<br />
April 15, 2008 Chicago<br />
1 1
It should be noted that this presentation <strong>and</strong> the remarks made by AIG<br />
representatives may contain projections concerning financial information <strong>and</strong><br />
statements concerning future economic performance <strong>and</strong> events, plans <strong>and</strong><br />
objectives relating to management, operations, products <strong>and</strong> services, <strong>and</strong><br />
assumptions underlying these projections <strong>and</strong> statements. It is possible that<br />
AIG's actual results <strong>and</strong> financial condition may differ, possibly materially,<br />
from the anticipated results <strong>and</strong> financial condition indicated in these<br />
projections <strong>and</strong> statements. Factors that could cause AIG's actual results to<br />
differ, possibly materially, from those in the specific projections <strong>and</strong><br />
statements are discussed in Item 1A. Risk Factors <strong>of</strong> AIG's Annual Report on<br />
Form 10-K for the year ended December 31, 2007. AIG is not under any<br />
obligation (<strong>and</strong> expressly disclaims any such obligations) to update or alter<br />
its projections <strong>and</strong> other statements whether as a result <strong>of</strong> new information,<br />
future events or otherwise.<br />
This presentation may also contain certain non-GAAP financial measures.<br />
The reconciliation <strong>of</strong> such measures to the comparable GAAP figures are<br />
included in the Fourth Quarter 2007 Financial Supplement available in the<br />
Investor Information Section <strong>of</strong> AIG's corporate website,<br />
www.aigcorporate.com.<br />
2 2
AIG’s Multi-Layered <strong>ERM</strong> Processes<br />
Credit Risk Management<br />
Market Risk Management<br />
Gen Ins. Risk Management<br />
Life Ins. Risk Management<br />
Op. Risk Management<br />
Liquidity Risk Management<br />
Each <strong>of</strong> the <strong>ERM</strong> functions focuses on<br />
systematic (non-diversifiable) risks<br />
Combination <strong>of</strong> centralized <strong>and</strong> decentralized<br />
processes that fit the business model<br />
Regional <strong>ERM</strong> hubs in North America, Asia <strong>and</strong><br />
Europe<br />
Mature risk governance structure since early<br />
90’s<br />
<strong>ERM</strong> does not compensate for, but rather builds<br />
on, pr<strong>of</strong>it center RM<br />
Extensive use <strong>of</strong> “stress scenarios” that cut<br />
through all risk types (e.g. P<strong>and</strong>emics)<br />
AIG’s corporate philosophy has always encouraged full pr<strong>of</strong>it center accountability<br />
for risk management – <strong>ERM</strong> has built on this unique risk culture<br />
3 3
<strong>ERM</strong>’s efforts “connect the dots” between each <strong>of</strong> the businesses’ silo risk<br />
management processes to maximize economic value for shareholders<br />
Within &<br />
Between<br />
Segments<br />
“Pyramid” Risk<br />
Governance<br />
Structures<br />
Three Pillar<br />
Approach<br />
<strong>ERM</strong>’s “Enterprise” - Wide Focus<br />
<strong>ERM</strong>’s focus has been on activities <strong>of</strong> an “aggregation” nature – e.g.<br />
economic capital, stress testing/catastrophic scenarios, consistent<br />
economic-based performance measurement, concentration risk<br />
management, reinsurance & risk mitigation (e.g. hedging) strategies,<br />
emerging risk management, etc.<br />
Commencing with the Board <strong>and</strong> its Committees (e.g. Finance <strong>and</strong> Audit);<br />
cascading down to the four business segments, the regional/management<br />
subdivisions, the functional risk management committees (e.g. loss<br />
reserves) <strong>and</strong> the legal entity/pr<strong>of</strong>it center risk committees<br />
<strong>ERM</strong>’s Pillar 1 capital requirement approach is centered around the ECM<br />
<strong>and</strong> quantification <strong>of</strong> risk capital<br />
<strong>ERM</strong>’s Pillar 2 supervisory review approach is guided by stress testing <strong>and</strong><br />
the active dialogue with regulators <strong>and</strong> rating agencies<br />
<strong>ERM</strong>’s Pillar 3 market discipline approach is demonstrated by regular risk<br />
based disclosures in the Form 10-K <strong>and</strong> 10-Q supplements <strong>and</strong> the<br />
enhanced disclosures to investors through the AIG website (e.g. sub-prime<br />
presentation <strong>and</strong> ECM Initiative update)<br />
4 4
Enterprise Risk<br />
Enterprise Management 2007 Risk<br />
Management<br />
Credit Risk<br />
Market Risk<br />
Insurance Risk<br />
<strong>Economic</strong> <strong>Capital</strong><br />
Operational Risk<br />
SOX<br />
CSFT<br />
<strong>ERM</strong> Governance <strong>and</strong> Reporting<br />
Senior<br />
Senior<br />
Management<br />
Management<br />
Committees<br />
Credit Risk<br />
Cross-Border Exposure<br />
Country Rating Review<br />
Financial Risk<br />
Foreign Exchange<br />
Derivatives<br />
L&RS RM<br />
General Insurance RM<br />
CEO Approval Process<br />
<strong>Capital</strong> Management<br />
<strong>Economic</strong> <strong>Capital</strong><br />
ORM Forums<br />
CSFT/ TRC<br />
Board <strong>of</strong><br />
Directors Board <strong>of</strong><br />
Directors<br />
Finance Committee<br />
Audit Committee<br />
5 5
Rating Agencies<br />
Four major rating agencies have indicated that they will, over<br />
time, incorporate <strong>ERM</strong> <strong>and</strong> ECM in the rating process.<br />
“St<strong>and</strong>ard &<br />
Poor’s is<br />
developing a<br />
process for<br />
evaluating the<br />
economic capital<br />
(EC) models <strong>of</strong><br />
insurers with <strong>ERM</strong><br />
programs that<br />
have been viewed<br />
as strong or<br />
excellent”<br />
S&P, Jan. 31, 2007<br />
“Moody's expects best<br />
practice insurers to<br />
develop economic capital<br />
models based on sound<br />
principles <strong>and</strong><br />
conservative<br />
assumptions to reflect the<br />
risk pr<strong>of</strong>ile <strong>of</strong> their<br />
businesses”<br />
Moody’s, Mar. 22, 2007<br />
“Fitch believes<br />
reviewing<br />
insurers’ in-house<br />
models is a key<br />
part <strong>of</strong><br />
capital analysis”<br />
“Prism provides a<br />
common<br />
ground to<br />
compare various<br />
insurers’ capital<br />
positions on a true<br />
economic basis”<br />
Fitch, Apr. 27 2007<br />
“A.M. Best will also<br />
exp<strong>and</strong> the use <strong>of</strong><br />
company-provided<br />
capital models in<br />
developing capital<br />
requirements within<br />
the rating evaluation<br />
process”<br />
A.M. Best, Mar. 5, 2007<br />
6 6
“We value the more meaningful information provided by [MC]EV-based measures<br />
because they more faithfully represent the underlying economics <strong>of</strong> the insurance<br />
portfolio, <strong>and</strong> enable us to dissect financial performance by new business<br />
contribution, experience deviations for all principal assumptions, <strong>and</strong> assumption<br />
changes.”<br />
Source: S&P RatingsDirect, October 15, 2007<br />
Summary <strong>of</strong> S&P position:<br />
• Encourages MCEV as a global financial<br />
reporting st<strong>and</strong>ard<br />
• Starting in 2008, will allow for capital relief<br />
based on internal MCEV models<br />
• In favor <strong>of</strong> valuation via market consistent<br />
discounting plus margins<br />
• Does not object to “day one” pr<strong>of</strong>its (<strong>and</strong><br />
losses)<br />
• Prefers going concern market consistent<br />
value rather than exit value<br />
S&P Endorses MCEV Reporting<br />
Disadvantages noted by S&P:<br />
• Recognizes that fair value reporting will<br />
add to volatility, but says that volatility is a<br />
reality <strong>of</strong> the business<br />
• Fair value will require “huge” actuarial<br />
resources, adoption <strong>of</strong> new systems, <strong>and</strong><br />
increasing administrative costs<br />
• Insurers are worried that accelerated<br />
recognition <strong>of</strong> pr<strong>of</strong>its will accelerate<br />
taxation<br />
7 7
Source: Citigroup<br />
Global Markets,<br />
“Valuation Crisis in<br />
Insurance – Can<br />
Better Disclosure<br />
Rescue the Sector?”;<br />
Sept. 17, 2007<br />
European Analysts Favor Transparency <strong>of</strong> MCEV But<br />
Dem<strong>and</strong> Whole Lot More<br />
8 8
The Experience <strong>of</strong> European Insurers with US Operations<br />
41.0%<br />
European Insurers’ New Business: Geographical Features 1<br />
New Sales (APE) New Business Pr<strong>of</strong>its<br />
8.0%<br />
29.0%<br />
22.0%<br />
53.0%<br />
US Asia (ex Japan & Aust.)<br />
UK<br />
1. Includes: Aegon, Allianz, Aviva, Axa, ING, Old Mutual, Prudential (UK), ZFS<br />
Source: Citigroup, European Embedded Value Review, June 28, 2007<br />
Other<br />
19.0%<br />
12.0%<br />
16.0%<br />
9 9
European Insurers Report Increasing Pr<strong>of</strong>it Margins Since EEV<br />
CFO Forum<br />
Launched EEV<br />
Principles in May<br />
2004, with<br />
implementation<br />
set for year end<br />
2005 at the latest<br />
European Insurers’ New Business Pr<strong>of</strong>it Margins 1<br />
15<br />
10<br />
5<br />
0<br />
8<br />
(NBP as % <strong>of</strong> New APE)<br />
12 12<br />
13<br />
2003 2004 2005 2006<br />
1. Includes: Aegon, Allianz, Aviva, Axa, ING, Old Mutual, Prudential (UK), ZFS<br />
Source: Citigroup, European Embedded Value Review, June 28, 2007<br />
10 10
What’s Driving AIG’s <strong>Economic</strong> <strong>Capital</strong><br />
<strong>and</strong> Risk Optimization<br />
Opportunity Impact<br />
Greater individual business unit risk<br />
retention / buy less reinsurance<br />
Increased operating efficiency / more<br />
financial flexibility<br />
More aggressive products evaluated<br />
on overall AIG portfolio risk effect vs.<br />
pr<strong>of</strong>it center<br />
Converge rating agency & economic<br />
views <strong>of</strong> excess capital positions<br />
Link management compensation to<br />
economic value creation<br />
Higher growth <strong>and</strong> pr<strong>of</strong>itability<br />
Optimize net investment income<br />
<strong>and</strong> total return<br />
Higher ROE<br />
Higher margins<br />
Allows for more efficient<br />
redeployment <strong>of</strong> capital<br />
Optimization <strong>of</strong> cost <strong>of</strong> capital<br />
Allows measurement <strong>of</strong> risk<br />
adjusted business performance<br />
11 11
<strong>Economic</strong> <strong>Capital</strong> at AIG<br />
By focusing on business applications, AIG’s economic capital modeling<br />
has leapfrogged many <strong>of</strong> the traditional approaches to EC<br />
Later 90's<br />
Banks<br />
Group<br />
Early 00's 2006<br />
European<br />
Insurers<br />
European<br />
Insurers'<br />
disclosures focus<br />
on group level:<br />
. Allianz<br />
. AXA<br />
. Generali<br />
. ING<br />
. Munich Re<br />
. Pru UK<br />
. Swiss Re<br />
2005 2006 2007<br />
Foreign<br />
Life Insurance &<br />
Retirement<br />
Services<br />
Japan <strong>and</strong><br />
Other Asia<br />
ALICO<br />
AIG Edison<br />
AIG Star Life<br />
A6<br />
APLO<br />
AIA China<br />
Nan Shan<br />
Philam<br />
AIRCO Life<br />
AIG Life & AI<br />
Life<br />
Domestic<br />
Domestic<br />
General<br />
DLC DRS<br />
DBG<br />
Personal Lines<br />
UGC<br />
HSB<br />
AGL AIG Annuity 21st Century<br />
AGLA VALIC<br />
Sun America<br />
TRH<br />
AIG Canada (Ex. GIC)<br />
General<br />
Insurance<br />
ILFC AG Finance<br />
AIG CEF AIG CFG<br />
AIG Credit FSB<br />
Wealth AM (AIG<br />
Private Bank)<br />
Retail AM<br />
(SAAMCo, AIG<br />
Advisors)<br />
Important for<br />
<strong>Capital</strong> fungibility<br />
Regulatory capital dialogue<br />
Underst<strong>and</strong>ing business<br />
Performance metrics – “fit for purpose”<br />
Foreign<br />
General<br />
AIG decided very early on<br />
to focus on business<br />
units/legal entities/pr<strong>of</strong>it<br />
centers, not just group.<br />
AIG<br />
<strong>Capital</strong><br />
Markets<br />
AIG FP<br />
Parent<br />
Financial<br />
Services<br />
Comm.<br />
Finance<br />
Consumer<br />
Finance<br />
Asset<br />
Management<br />
Asset<br />
Management<br />
Institutional AM<br />
(AIGGIG)<br />
Spread-Based<br />
Investment<br />
SALIC (GIC)<br />
AIG MIP<br />
12 12
AIG’s Applications <strong>of</strong> EC<br />
Optimization <strong>of</strong> <strong>Capital</strong> Structure – Hybrid Issuances & Share Repurchases;<br />
Assessment <strong>of</strong> alternative risk retention <strong>and</strong> reinsurance strategies for<br />
exposures to U.S. natural catastrophes ;<br />
Assessment <strong>of</strong> the economic costs/benefits <strong>of</strong> purchasing index-based<br />
excess <strong>of</strong> loss credit protection for portfolio <strong>of</strong> reinsurance recoverables;<br />
Evaluation <strong>of</strong> alternative asset allocation strategies taking account <strong>of</strong><br />
regulatory constraints <strong>and</strong> economic considerations for our life insurance<br />
businesses operating in low-yield environments;<br />
Facilitation <strong>of</strong> active capital management processes for the life insurance<br />
segments by incorporating economic capital analysis for potential<br />
transactions;<br />
Assessment <strong>of</strong> capital mobility throughout the organization, developing<br />
principles <strong>and</strong> strategies to improve capital efficiency<br />
Source: AIG Investor Relations Website; February 2008<br />
13 13
CRO Forum Recommendations Re EC Time Horizon<br />
“ There is a trade <strong>of</strong>f between choosing a long time horizon (where portfolio<br />
characteristics far out from the valuation date can be brought into consideration in a<br />
more satisfactory way) <strong>and</strong> choosing a short time horizon (based on funding changes<br />
in market-consistent liability values over a one year time horizon).<br />
Market consistent liability valuations already take into account the lifetime <strong>of</strong> the<br />
business <strong>and</strong> associated risks. The traditional actuarial approach to risk modelling (i.e.<br />
choosing a long time horizon) comes at a cost – that <strong>of</strong> lower confidence in the<br />
calibration <strong>of</strong> parameters that far out into the future.<br />
The CRO Forum does not advocate one time horizon over another but rather believes<br />
that it should be appropriate to the business model <strong>and</strong> also the period <strong>of</strong> time over<br />
which management can deploy risk management strategies that can significantly<br />
impact the risk pr<strong>of</strong>ile <strong>of</strong> the firm. Often running a model on more than one time horizon<br />
provides useful insight that is important for shaping enduring risk management or risk<br />
mitigation strategies.<br />
Nevertheless, the length <strong>of</strong> the period covering the worst-case loss should be longer<br />
than the risk measurement cycle <strong>of</strong> the company as measurement <strong>and</strong> decisions take<br />
time.<br />
Since the CRO Forum supports market consistent models, for external capital<br />
adequacy assessment purposes, our preferred time horizon for losses is generally one<br />
year <strong>and</strong> assumes a quarterly risk management cycle.”<br />
Source: CRO Forum, Response to A.M.Best “Draft: Risk Management <strong>and</strong> the Rating Process for Insurance Companies”; April 6, 2007<br />
14 14
Case study<br />
dispels myth that<br />
One-Year VAR is<br />
an inferior risk<br />
measure to Run-<br />
Off measures<br />
Solvency Time Horizon : the Great Debate<br />
Case Study : UK Annuity Book with Credit Risky Cash flow<br />
Matching Strategy (Credit Composition = Globox Index)<br />
RBC (95% CI Run-Off with 10 Year Duration or 99.5% One Year) as % <strong>of</strong><br />
Fair Value <strong>of</strong> Liability<br />
12<br />
8<br />
4<br />
6.8<br />
Run-Off to<br />
Ultimate<br />
8.6<br />
Run-Off with<br />
Realistic<br />
Valuation<br />
10.9 10.9<br />
Run-Off with<br />
"Continuous"<br />
Fair Valuation<br />
One-Year<br />
VAR<br />
Source:<br />
Barrie & Hibbert, September<br />
2007, “Annuity Risk<br />
Management – The Impact <strong>of</strong><br />
Intermediate Solvency on Risk<br />
Based <strong>Capital</strong> Requirements”<br />
15 15
Assessment <strong>of</strong> Financial Strength <strong>of</strong> P&C Insurers - Reserve<br />
Risk Required <strong>Capital</strong> : One-Year vs. Run-Off<br />
Does use <strong>of</strong> a common (e.g. 5, 10, 30 year) projection period, result in an apples-to-apples<br />
comparison <strong>of</strong> financial strength <strong>of</strong> P&C insurers with vastly different run-<strong>of</strong>f pr<strong>of</strong>iles?<br />
Source : AIG Analysis <strong>of</strong> Schedule P Data as at Dec, 31, 2006<br />
Comparison <strong>of</strong> Coefficients <strong>of</strong> Variation<br />
8%<br />
6%<br />
4%<br />
2%<br />
0%<br />
50%<br />
40%<br />
30%<br />
20%<br />
10%<br />
0%<br />
6%<br />
7%<br />
One Year Run-Off<br />
20%<br />
40%<br />
One Year Run-Off<br />
Short Tail<br />
(PPA)<br />
Long Tail<br />
(Excess WC)<br />
100%<br />
80%<br />
60%<br />
40%<br />
20%<br />
0%<br />
60%<br />
Commercial<br />
Lines<br />
Dominance<br />
- ILLUSTRATION -<br />
Comparison <strong>of</strong> <strong>Capital</strong> Requirements: One-Year<br />
% <strong>of</strong> Run-Off <strong>Capital</strong> Required<br />
80%<br />
US P&C<br />
Industry<br />
90%<br />
Personal<br />
Lines<br />
Dominance<br />
16 16
Risk Aggregation – Three Step Approach<br />
AIG’s ECM uses a three step approach for ensuring that “accumulations” <strong>of</strong> risk are<br />
robustly estimated<br />
Hybrid Approach<br />
in ECM<br />
<strong>Capital</strong> Mobility<br />
Stress Testing<br />
Within risk types, aggregation is performed using consistent scenarios (e.g.<br />
the different components <strong>of</strong> market risk)<br />
Between risk types, risks are aggregated using a correlation matrix / copula<br />
approach to reflect the impact <strong>of</strong> “stress correlations” <strong>and</strong> increased<br />
interconnectedness <strong>of</strong> risks<br />
Some <strong>of</strong> the aggregations (e.g. between market <strong>and</strong> credit) are increasingly<br />
being performed using a consistent scenario approach<br />
Insurance operations are regulated along legal entities by different<br />
jurisdictions with varying minimum risk based capital (RBC) requirements<br />
Restrictions on dividend payments to the parent <strong>and</strong> other capital flow<br />
constraints <strong>and</strong> tax considerations give rise to a further “fungibility haircut”<br />
to determine realizable diversification benefits<br />
Bottom up “stress tests” (e.g. effect <strong>of</strong> a severe p<strong>and</strong>emic) are performed by<br />
simple addition <strong>of</strong> risk type effect, following detailed assessment <strong>of</strong> each<br />
category <strong>of</strong> loss (e.g. mortality, credit, interest rate <strong>and</strong> business interruption<br />
losses for p<strong>and</strong>emics)<br />
Provides a “reality check” on assumed modeled dependencies<br />
17 17
<strong>Economic</strong> <strong>Capital</strong> – the Importance <strong>of</strong> Integrated Modeling<br />
Extreme Mortality &<br />
Interest Scenarios<br />
derived from Low<br />
Interest Rate<br />
Scenarios<br />
– Negatively<br />
Correlated with<br />
Extreme Credit Loss<br />
Scenarios (High<br />
Interest Scenarios)<br />
Case Study : UK Annuity Book with Credit Risky Cash flow<br />
Matching Strategy (Credit Composition = Globox Index)<br />
100<br />
95<br />
90<br />
100<br />
RBC (GBP MM)<br />
Combining St<strong>and</strong>alone RBC<br />
Assuming Independence<br />
93<br />
Integrated M odelling -<br />
Reflects Negative<br />
Correlation in the Tail<br />
Source:<br />
Barrie & Hibbert, February<br />
2007, “Annuity Risk<br />
Management : One-Year VAR<br />
Decomposition – A Case Study”<br />
18 18
Dominance <strong>of</strong> Regulatory Risk Measures Across Global Insurance Industry<br />
Although two thirds <strong>of</strong> large insurers have economic capital models,<br />
fewer companies have truly embedded these in business applications.<br />
Aggregate Survey Results<br />
When measuring risk, what are the<br />
principal financial measures on which<br />
the impact <strong>of</strong> the risk is assessed?<br />
(Select up to 3)<br />
Source : Tillinghast, <strong>ERM</strong> Survey, September 2006<br />
Key Regional Differences<br />
Most frequently cited financial measures on<br />
which the impact <strong>of</strong> risk is assessed are<br />
statutory or regulatory capital <strong>and</strong> surplus<br />
(56%) <strong>and</strong> economic/embedded value<br />
Use <strong>of</strong> regulatory capital <strong>and</strong> surplus is<br />
most frequently cited by participants in<br />
North America (70%) <strong>and</strong> the U.K.<br />
(67%)<br />
Life insurers <strong>and</strong> multi-line companies<br />
in North America (75% in each case)<br />
were more likely than their European<br />
counterparts (58% <strong>and</strong> 31%,<br />
respectively) to focus on statutory or<br />
regulatory capital <strong>and</strong> surplus<br />
Results were approximately the same<br />
for P&C companies in North America<br />
(62%) versus Europe (60%)<br />
CONFIDENTIAL - FOR INTERNAL USE ONLY<br />
19 19
$BN<br />
101.68<br />
GAAP<br />
Shareholders'<br />
Equity at<br />
December 31,<br />
2006<br />
6.28<br />
AIG Disclosures (1 <strong>of</strong> 3)<br />
Change in Available <strong>Economic</strong> <strong>Capital</strong><br />
Year End 2006 to Year End 2007<br />
101.68 6.28 6.20 (5.71)<br />
6.20<br />
Net Income AIGFP Market<br />
Consistent<br />
Settlement<br />
Value<br />
Adjustment<br />
5.71<br />
OCI Unrealized<br />
Losses Net <strong>of</strong><br />
Tax<br />
1.61 (7.98) 5.81 107.89<br />
Plus Plus Less Plus Less Plus<br />
1.61<br />
OCI Translation<br />
Adj. Net <strong>of</strong> Tax &<br />
Other<br />
6.02<br />
1.96<br />
Share<br />
Repurchases &<br />
Dividends<br />
5.81<br />
AIG Hybrid<br />
Issuances<br />
6.20<br />
5.81<br />
95.88<br />
Available<br />
<strong>Economic</strong><br />
<strong>Capital</strong> at<br />
December 31,<br />
2007<br />
• Dividends <strong>and</strong><br />
Share<br />
Repurchases ($8.0<br />
BN) exceeded<br />
Hybrid Issuances<br />
($5.8 billion)<br />
• The AIGFP market<br />
consistent<br />
settlement value<br />
adjustment ($6.2<br />
BN) was largely<br />
<strong>of</strong>fset by OCI<br />
unrealized losses<br />
($5.7 billion)<br />
During 2007, AIG’s conservative estimate <strong>of</strong> Available <strong>Economic</strong> <strong>Capital</strong> increased by $6.2<br />
billion (i.e. $107.9 less $101.7 billion).<br />
Source: AIG Investor Relations Website, February 2008<br />
20 20
AIG Disclosures (2 <strong>of</strong> 3)<br />
Adjustments Made to Unrealized GAAP Market Valuation Loss<br />
to Determine Available <strong>Economic</strong> <strong>Capital</strong> Under AIG’s ECM<br />
12.00<br />
10.00<br />
$BN<br />
8.00<br />
6.00<br />
4.00<br />
2.00<br />
0.00<br />
Market Consistent Settlement Value<br />
Adjustment to Determine Available<br />
<strong>Economic</strong> <strong>Capital</strong> (December 31, 2007)<br />
11.25<br />
Unrealized Market<br />
Valuation Loss Carried<br />
on GAAP Balance Sheet<br />
1.71<br />
Market Consistent<br />
Settlement Value Loss<br />
9.54<br />
Pre-Tax Adjustment to<br />
Unrealized Losses<br />
6.20<br />
After-Tax Adjustment to<br />
GAAP Equity<br />
• At June 30, 2007 AIG used GAAP equity<br />
as a conservative proxy for Available<br />
<strong>Economic</strong> <strong>Capital</strong><br />
• For December 31, 2007:<br />
– AIG will use Market Consistent Embedded<br />
Value* as its estimate <strong>of</strong> Available<br />
<strong>Economic</strong> <strong>Capital</strong> for the Life & Retirement<br />
Services segment<br />
– For the General Insurance segment, a<br />
consistent approach will be used<br />
– These valuation approaches are<br />
consistent with the market consistent<br />
settlement value approach AIG has<br />
applied to FP’s Super Senior credit<br />
derivative portfolio <strong>of</strong> Multi-Sector CDOs<br />
* Currently being independently reviewed <strong>and</strong> certified by Towers Perrin.<br />
For the purposes <strong>of</strong> determining Available <strong>Economic</strong> <strong>Capital</strong>, AIG believes it is reasonable to make a<br />
positive market consistent settlement value adjustment <strong>of</strong> $6.2 billion in respect <strong>of</strong> the AIGFP Unrealized<br />
Loss to its GAAP Reported Total Shareholders’ Equity as at December 31, 2007.<br />
Source: AIG Investor Relations Website, February 2008<br />
21 21
$BN<br />
25.0<br />
20.0<br />
15.0<br />
10.0<br />
5.0<br />
0.0<br />
AIG Disclosures (3 <strong>of</strong> 3)<br />
Change in Conservative Estimate <strong>of</strong> Excess <strong>Capital</strong><br />
Estimate <strong>of</strong> Excess <strong>Economic</strong><br />
<strong>Capital</strong> (incl. Hybrid) September<br />
30, 2007<br />
September 30, 2007 to December 31, 2007<br />
16.0 to 21.0 (0.9) (0.6) 14.5 to 19.5<br />
High<br />
Low<br />
Estimated Change in Available<br />
<strong>Economic</strong> <strong>Capital</strong> Q4'2007<br />
Estimated Change in Required<br />
<strong>Economic</strong> <strong>Capital</strong> Q4' 2007<br />
Estimate <strong>of</strong> Excess <strong>Economic</strong><br />
<strong>Capital</strong> (incl. Hybrid) December<br />
31, 2007<br />
• Estimated<br />
Available<br />
<strong>Economic</strong> <strong>Capital</strong><br />
was reduced by<br />
$0.9 billion in<br />
Q4’07, driven by<br />
Net Income, Share<br />
Repurchases <strong>and</strong><br />
OCI Unrealized<br />
Losses<br />
• Estimated<br />
Required<br />
<strong>Economic</strong> <strong>Capital</strong><br />
increased<br />
marginally by $0.6<br />
billion in Q4’07<br />
AIG’s conservative estimate <strong>of</strong> excess capital has reduced slightly by $1.5 billion over Q4’07 to a range <strong>of</strong><br />
$14.5 to $19.5 billion as at December 31, 2007 1 . This estimate is based on a roll-forward <strong>of</strong> the September 30,<br />
2007 disclosure <strong>and</strong> will be “refreshed” consequent to the full model valuation update at December 31, 2007 2 .<br />
1. Before allowance for an additional $1 billion that was required to be advanced in January 2008 for share repurchases pursuant to commitments that existed at December 31, 2007.<br />
2. The full model valuation update will use the published results <strong>of</strong> <strong>of</strong><br />
AIG as at December 31, 2007, as inputs <strong>and</strong> is therefore expected expected<br />
to be available in May 2008.<br />
Source: AIG Investor Relations Website, February 2008<br />
High<br />
Low<br />
22 22
AIG’s Use <strong>of</strong> <strong>Economic</strong> Performance Measures<br />
“Commencing in 2008, the economic value added for each <strong>of</strong> AIG’s business<br />
segments will be considered as an element, alongside other existing<br />
measures, in the evaluation <strong>of</strong> senior management performance.”<br />
- AIG Investor Relations Website, February 2008<br />
23 23