Phase transition and density of subducted MORB crust in the lower ...
Phase transition and density of subducted MORB crust in the lower ...
Phase transition and density of subducted MORB crust in the lower ...

You also want an ePaper? Increase the reach of your titles
YUMPU automatically turns print PDFs into web optimized ePapers that Google loves.
246<br />
strated that <strong>the</strong> volume decreased by about 1% at<br />
<strong>the</strong> post-perovskite phase <strong>transition</strong> [8]. These P–V<br />
data <strong>in</strong> <strong>MORB</strong> composition, however, do not <strong>in</strong>dicate<br />
such a large volume decrease. It should be due<br />
to a change <strong>in</strong> <strong>the</strong> chemical composition from perovskite<br />
to post-perovskite phase <strong>in</strong> <strong>MORB</strong> bulk<br />
composition.<br />
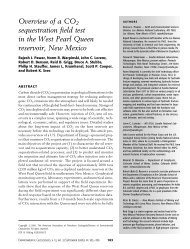
The P–V data <strong>of</strong> stishovite <strong>and</strong> CaCl2-type SiO2<br />
were fitted toge<strong>the</strong>r to <strong>the</strong> Birch–Murnaghan equation<br />
<strong>of</strong> state (Fig. 4b). Fitt<strong>in</strong>g result shows<br />
K0=279(F13) GPa <strong>and</strong> V0=47.3(F0.3) A˚ 3 when<br />
KV=4, which are quite consistent with <strong>the</strong> previous<br />
results on Al-bear<strong>in</strong>g stishovite [40]. a-PbO2-type<br />
phase <strong>in</strong> <strong>MORB</strong> composition conta<strong>in</strong>s 12.6 wt.%<br />
Al2O3 that significantly exp<strong>and</strong>s volumes. The unitcell<br />
volume <strong>of</strong> a-PbO2-type phase syn<strong>the</strong>sized <strong>in</strong><br />
<strong>MORB</strong> composition is 73.79 A˚ 3 at 132 GPa (Table<br />
1), which is larger by about 4% than that <strong>of</strong> pure<br />
SiO2 phase obta<strong>in</strong>ed at 136 GPa [12]. It is noted<br />
that <strong>the</strong> unit-cell volume <strong>of</strong> a-PbO2-type phase<br />
[Z =4] is remarkably larger than double unit-cell<br />
volume <strong>of</strong> CaCl2-type phase [Z =2] at equivalent<br />
pressure (Fig. 4b).<br />
The volumes <strong>of</strong> Ca-perovskite were determ<strong>in</strong>ed on<br />
<strong>the</strong> basis <strong>of</strong> tetragonal structure (space group; P4/<br />
mmm) proposed by Shim et al. [13] at 300 K <strong>and</strong><br />
cubic structure at high temperatures. The P–V data <strong>of</strong><br />
Ca-perovskite <strong>and</strong> CaFe2O4-type Al-phase from 40 to<br />
132 GPa respectively lie on a s<strong>in</strong>gle compression<br />
curve (Fig. 4c <strong>and</strong> d). Fitt<strong>in</strong>g to <strong>the</strong> Birch–Murnaghan<br />
equation <strong>of</strong> state show K0=245(F6) GPa <strong>and</strong><br />
V0=45.6(F0.2) A˚ 3<br />
K. Hirose et al. / Earth <strong>and</strong> Planetary Science Letters 237 (2005) 239–251<br />
for Al-bear<strong>in</strong>g Ca-perovskite<br />
<strong>and</strong> K 0=214(F8) GPa <strong>and</strong> V 0=239.7(F1.5) A˚ 3 for<br />
CaFe 2O 4-type Al-phase, when KV is fixed at 4. Previous<br />
measurements <strong>of</strong> <strong>the</strong> compressibility <strong>of</strong> CaFe 2O 4type<br />
Al-phase showed relatively wide variation <strong>in</strong> <strong>the</strong><br />
value <strong>of</strong> K0. Present result is higher than that measured<br />
by Guignot <strong>and</strong> Andrault [36] (~190 GPa) but is<br />
<strong>lower</strong> than that by Ono et al. [41] (243 GPa).<br />
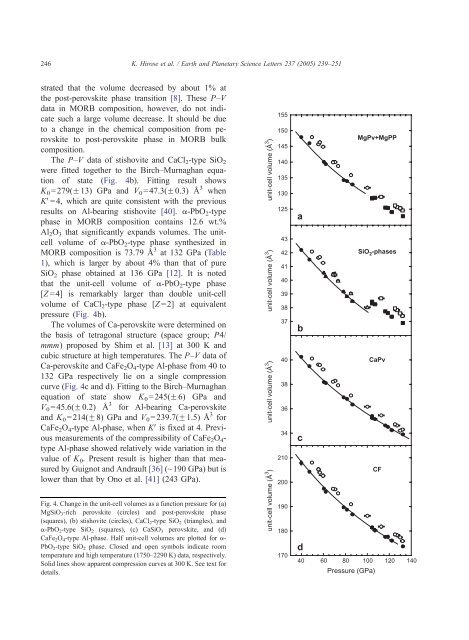
Fig. 4. Change <strong>in</strong> <strong>the</strong> unit-cell volumes as a function pressure for (a)<br />
MgSiO 3-rich perovskite (circles) <strong>and</strong> post-perovskite phase<br />
(squares), (b) stishovite (circles), CaCl2-type SiO2 (triangles), <strong>and</strong><br />
a-PbO2-type SiO2 (squares), (c) CaSiO3 perovskite, <strong>and</strong> (d)<br />
CaFe2O4-type Al-phase. Half unit-cell volumes are plotted for a-<br />
PbO 2-type SiO 2 phase. Closed <strong>and</strong> open symbols <strong>in</strong>dicate room<br />
temperature <strong>and</strong> high temperature (1750–2290 K) data, respectively.<br />
Solid l<strong>in</strong>es show apparent compression curves at 300 K. See text for<br />
details.<br />
unit-cell volume (Å 3 unit-cell volume (Å )<br />
3 ) unit-cell volume (Å 3 unit-cell volume (Å )<br />
3 )<br />
155<br />
150<br />
145<br />
140<br />
135<br />
130<br />
125<br />
43<br />
42<br />
41<br />
40<br />
39<br />
38<br />
37<br />
40<br />
38<br />
36<br />
34<br />
210<br />
200<br />
190<br />
180<br />
170<br />
a<br />
b<br />
c<br />
d<br />
MgPv+MgPP<br />
SiO 2 -phases<br />
CaPv<br />
CF<br />
40 60 80 100 120 140<br />
Pressure (GPa)