Molecular Beam Mass Spectrometry for Analysis of ... - EVUR
Molecular Beam Mass Spectrometry for Analysis of ... - EVUR
Molecular Beam Mass Spectrometry for Analysis of ... - EVUR

You also want an ePaper? Increase the reach of your titles
YUMPU automatically turns print PDFs into web optimized ePapers that Google loves.
Results and experience<br />
•Provides real-time, continuous, and robust<br />
process monitoring <strong>of</strong> hot, untreated process gas<br />
•Near-universal detection (typical sensitivity ~1<br />
ppmv)<br />
•Reproducible and stable with routine<br />
maintenance<br />
•Learning curve is steep, complex system<br />
•Quantitation is somewhat cumbersome (requires<br />
careful injection <strong>of</strong> liquid standard <strong>for</strong> each<br />
species <strong>of</strong> interest and good measurement <strong>of</strong> wet<br />
volumetric flow)<br />
•Compares well with EU Tar Protocol, but<br />
estimations <strong>of</strong> “gravimetric” tar difficult with limited<br />
standard set (injection <strong>of</strong> heavy tar standards into<br />
hot oven problematic due to solvent vaporization<br />
and capillary plugging)<br />
•Expensive (approx. $300K U.S.)<br />
•Most valuable during plant startup and initial<br />
product gas characterization, less valuable <strong>for</strong><br />
routine analysis<br />
NATIONAL RENEWABLE ENERGY LABORATORY<br />
Intensity (arb.)<br />
Intensity (arb.)<br />
1.5e+8<br />
1.0e+8<br />
5.0e+7<br />
2.5e+8<br />
2.0e+8<br />
1.5e+8<br />
1.0e+8<br />
5.0e+7<br />
16 (methane)<br />
40 (argon)<br />
78 94 108<br />
3.0e+7<br />
2.0e+7<br />
1.0e+7<br />
108<br />
110<br />
122<br />
132<br />
144 158<br />
100 150 200 250 300<br />
0 50 100 150 200 250 300 350 400<br />
16 (methane)<br />
40 (argon)<br />
78<br />
8.0e+7<br />
6.0e+7<br />
4.0e+7<br />
2.0e+7<br />
104<br />
116<br />
128<br />
m/z<br />
m/z<br />
160<br />
650 C<br />
0.0<br />
100 150 200 250 300<br />
128<br />
178<br />
142<br />
0 50 100 150 200 250 300 350 400<br />
152<br />
166<br />
178<br />
202<br />
216<br />
228<br />
875 C<br />
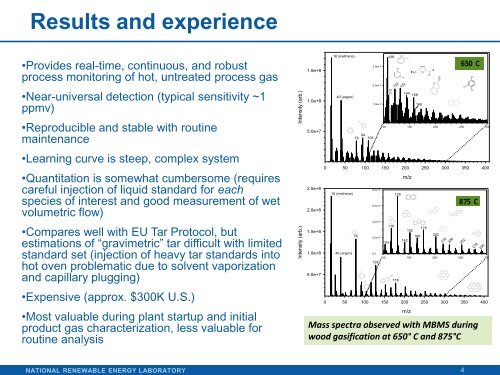
<strong>Mass</strong> spectra observed with MBMS during<br />
wood gasification at 650° C and 875°C<br />
252<br />
4<br />
276<br />
290