2004 Summary Annual Report - ExxonMobil
2004 Summary Annual Report - ExxonMobil
2004 Summary Annual Report - ExxonMobil

Create successful ePaper yourself
Turn your PDF publications into a flip-book with our unique Google optimized e-Paper software.
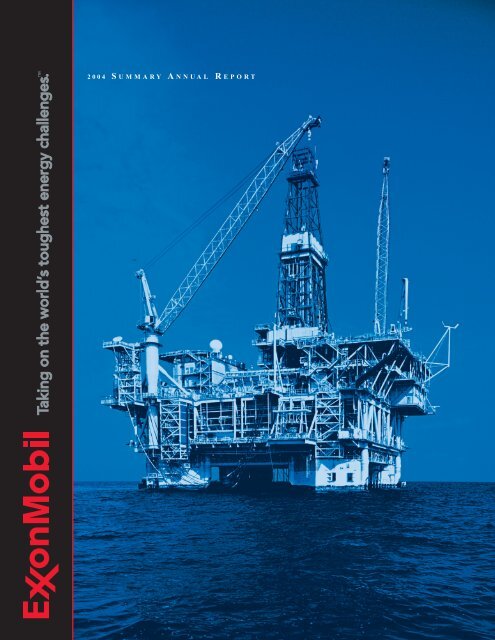
<strong>2004</strong> S UMMARY A NNUAL R EPORT
Initial production from the Kizomba A<br />
project occurred in August <strong>2004</strong>, setting<br />
an industry record for project execution<br />
time from contract award to first oil for a<br />
project of this size. Production from the<br />
36-slot tension leg platform (shown here<br />
and on the cover) is transferred to the<br />
world’s largest floating production,<br />
storage, and offloading vessel.<br />
TABLE OF CONTENTS<br />
To Our Shareholders 2-3<br />
Financial Highlights 4-5<br />
Technology 6-7<br />
Upstream 8-17<br />
Downstream 18 -25<br />
Chemical 26 -31<br />
Corporate Citizenship 32 -36<br />
Financial <strong>Summary</strong> 37-43<br />
Frequently Used Terms 44-45<br />
Directors, Officers, and<br />
Affiliated Companies 46 -47<br />
Investor Information 48 -49<br />
The term Upstream refers to exploration, development, production, and<br />
gas and power marketing. Downstream refers to the refining and marketing<br />
of petroleum products such as motor fuels and lubricants.<br />
Projections, targets, expectations, estimates, and business plans in this<br />
report are forward-looking statements. Actual future results, including demand<br />
growth and energy mix; capacity growth; the impact of new technologies;<br />
capital expenditures; project plans, dates, and capacities; production rates<br />
and resource recoveries; and efficiency gains and cost savings could differ<br />
materially due to, for example, changes in long-term oil and gas prices or<br />
other market conditions affecting the oil and gas industry; reservoir<br />
performance; timely completion of development projects; war and other<br />
political or security disturbances; changes in law or government regulation;<br />
the actions of competitors; unexpected technological developments; the<br />
occurrence and duration of economic recessions; the outcome of commercial<br />
negotiations; unforeseen technical difficulties; and other factors discussed<br />
in this report and under the heading “Factors Affecting Future Results” in<br />
Item 1 of <strong>ExxonMobil</strong>’s most recent Form 10-K.<br />
Definitions of certain financial and operating measures and other terms used<br />
in this report are contained in the section titled “Frequently Used Terms” on<br />
pages 44 and 45. In the case of financial measures, the definitions also include<br />
information required by SEC Regulation G to the extent we believe applicable.<br />
“Factors Affecting Future Results” and “Frequently Used Terms” are also<br />
posted on our website and are updated from time to time during the year.<br />
Certain reclassifications to prior years have been made to conform to<br />
the <strong>2004</strong> presentation.
To grow and prosper, the world will need 50 percent more<br />
energy by 2030 – an enormous challenge. This challenge<br />
demands more than the foresight to push ahead in new<br />
areas and markets. It requires people who are committed<br />
to finding better solutions through new technology and with<br />
the collective experience to successfully apply them. Not just<br />
quarter to quarter but decade to decade. To this challenge<br />
we bring continued dedication to the values we live by –<br />
discipline, integrity, reliability, consistency,<br />
and a commitment to technology. These principles<br />
are fundamental to our success today, and will remain so<br />
as we take on the world’s toughest energy challenges.
2<br />
To Our Shareholders<br />
<strong>2004</strong> was an outstanding year for our Company. We earned net income of $25.3 billion,<br />
the highest in the history of the Corporation. Cash flow from operations and asset sales was<br />
$43.3 billion, also a record. Return on average capital employed increased to 24 percent.<br />
And we returned nearly $15 billion to shareholders in dividends and share buybacks.<br />
Cumulatively since the merger, we have paid $33 billion in dividends and distributed<br />
nearly $24 billion through share purchases, reducing shares outstanding by over 8 percent.<br />
Our disciplined approach generated strong performance<br />
in each of our business lines and enabled us to fully<br />
capture the benefits of a robust business environment.<br />
The Upstream recorded the highest earnings in our<br />
history and generated more net income per barrel than<br />
our competitors over the past five years. Downstream<br />
earnings were also a record and increased 62 percent<br />
from 2003. And our Chemical business set a new<br />
earnings record – more than doubling 2003 results –<br />
and exceeded competitors’ returns.<br />
The strength of our performance in recent years<br />
speaks to the success of the merger. The breadth<br />
and scale of our combined businesses provided a<br />
platform for a step-change improvement in our financial<br />
and operating performance, our ability to leverage<br />
technology, and our capability to execute. And we<br />
continue to see more opportunity.<br />
<strong>ExxonMobil</strong> is well-positioned to meet the challenges of<br />
a rapidly changing and developing world. Our industry<br />
is constantly evolving. The industry has globalized as<br />
the world’s economies have expanded. Partners and<br />
competition change. New opportunities are larger,<br />
more capital intensive, and often in remote areas<br />
or difficult physical environments. Business cycles<br />
fluctuate, but our long-term view provides us with<br />
consistent direction. Finally, technology has improved<br />
the methods we employ and the results we achieve<br />
in meeting the world’s energy challenges.<br />
EXXON MOBIL CORPORATION • <strong>2004</strong> SUMMARY ANNUAL REPORT<br />
The challenges are enormous. Even with significant<br />
energy efficiency gains, we estimate the world’s oil<br />
and gas needs are likely to grow 50 percent by 2030.<br />
The industry must develop approximately 170 million<br />
oil-equivalent barrels per day of new production –<br />
about one-third higher than the current rate. Meeting<br />
these needs in a safe, environmentally responsible<br />
way is essential to support the development that<br />
drives improvement in the world’s standard of living.<br />
Change associated with this challenge is inevitable and<br />
is likely to accelerate. <strong>ExxonMobil</strong> embraces change as<br />
a source of business opportunity. Our ability to adapt<br />
and balance reward with risk is a competitive strength<br />
that will be of increasing importance.<br />
The challenges ahead play to <strong>ExxonMobil</strong>’s strengths.<br />
We achieve results through the disciplined implementation<br />
of strategies that are unique to each of our<br />
businesses. But, at the core, these strategies are<br />
underpinned by principles that are fundamental to all of<br />
our businesses and practiced by our employees in each<br />
of the roughly 200 countries and territories in which we<br />
operate around the world. We can count on these core<br />
principles for stability and consistency as we progress<br />
our long-term business objectives and adapt to change.<br />
Our approach begins with safety – an area where<br />
we continuously improve upon our industry-leading<br />
performance. We believe an organization that has a<br />
disciplined, successful approach to safety carries<br />
that discipline into all aspects of its operations.
Our operational excellence is demonstrated by projects<br />
completed on time and on budget. We meet our<br />
commitments and set industry benchmarks in the<br />
process. We are relentless in our pursuit of efficiencies,<br />
which are enabled by our rigorous project management,<br />
operating systems, and work processes deployed in<br />
our global functional organization.<br />
Our selective and disciplined investment approach<br />
has delivered pacesetting returns. Our unmatched<br />
financial strength gives us the flexibility to pursue<br />
multiple world-scale opportunities. We select only those<br />
investments that increase long-term shareholder value,<br />
and that are resilient across the business cycle. In <strong>2004</strong>,<br />
we invested $15 billion, and continue to make substantial<br />
progress in advancing our significant portfolio of<br />
high-quality projects.<br />
Advantages do not last forever. Our robust proprietary<br />
research effort is essential to improve performance<br />
capabilities faster than competition. <strong>ExxonMobil</strong>’s<br />
commitment and success in technology differentiate<br />
us from others and distinguish us as a partner of<br />
choice. The changing nature of opportunities plays to<br />
our strength in technology.<br />
And finally, we have long recognized the importance<br />
and value of maintaining high standards of ethics and<br />
business integrity. We believe that both results and<br />
the manner in which those results are achieved<br />
matter. The people of <strong>ExxonMobil</strong> take great pride in<br />
knowing that our behavior in all aspects is consistent<br />
with this belief.<br />
These fundamental beliefs and values form the<br />
backbone of our business approach and are<br />
encompassed by our overarching commitment to<br />
excellence in everything we do. They are embedded<br />
in our culture. We are confident that they will continue<br />
to serve us well as our Company embraces the changing<br />
world and takes on the toughest energy challenges.<br />
Lee R. Raymond Rex W. Tillerson<br />
Chairman and CEO President<br />
Lee R. Raymond<br />
Chairman and CEO<br />
T O O UR S HAREHOLDERS 3<br />
Rex W. Tillerson<br />
President<br />
<strong>ExxonMobil</strong> is well-positioned<br />
to meet the challenges of a rapidly<br />
changing and developing world.<br />
EXXON MOBIL CORPORATION • <strong>2004</strong> SUMMARY ANNUAL REPORT
4<br />
FINANCIAL HIGHLIGHTS<br />
(millions of dollars, unless noted) <strong>2004</strong> 2003 2002 2001 2000<br />
___________________________________________________________________________________________________________________________________________________________________________________________________________________________________________________________________________________________________________________________________________________________________________________________________________________________________________________________________________________<br />
Sales and other operating revenue 291,252 237,054 200,949 208,715 227,596<br />
Net income 25,330 21,510 11,460 15,320 17,720<br />
Cash flow from operations and asset sales (1) 43,305 30,788 24,061 23,967 28,707<br />
Capital and exploration expenditures (1) 14,885 15,525 13,955 12,311 11,168<br />
Cash dividends to <strong>ExxonMobil</strong> shareholders 6,896 6,515 6,217 6,254 6,123<br />
Common stock purchases (gross) 9,951 5,881 4,798 5,721 2,352<br />
Research and development costs 649 618 631 603 564<br />
Cash and cash equivalents at year end (2) 18,531 10,626 7,229 6,547 7,080<br />
Total assets at year end 195,256 174,278 152,644 143,174 149,000<br />
Total debt at year end 8,293 9,545 10,748 10,802 13,441<br />
Shareholders’ equity at year end 101,756 89,915 74,597 73,161 70,757<br />
Average capital employed (1) 107,339 95,373 88,342 88,000 87,463<br />
Market valuation at year end 328,128 269,294 234,101 267,577 301,239<br />
Regular employees at year end (thousands) 85.9 88.3 92.5 97.9 99.6<br />
KEY FINANCIAL RATIOS<br />
<strong>2004</strong> 2003 2002 2001 2000<br />
___________________________________________________________________________________________________________________________________________________________________________________________________________________________________________________________________________________________________________________________________________________________________________________________________________________________________________________________________________________<br />
Net income per common share (dollars) 3.91 3.24 1.69 2.23 2.55<br />
Net income per common share – assuming dilution (dollars) 3.89 3.23 1.68 2.21 2.52<br />
Return on average capital employed (1) (percent) 23.8 20.9 13.5 17.8 20.6<br />
Net income to average shareholders’ equity (percent) 26.4 26.2 15.5 21.3 26.4<br />
Debt to capital (3) (percent) 7.3 9.3 12.2 12.4 15.4<br />
Net debt to capital (4) (percent) (10.7) (1.2) 4.4 5.3 7.9<br />
Current assets to current liabilities 1.40 1.20 1.15 1.18 1.06<br />
Fixed charge coverage (times) 36.1 30.8 13.8 17.7 15.6<br />
(1) See Frequently Used Terms on pages 44 and 45.<br />
(2) Excluding restricted cash of $4,604 million.<br />
(3) Debt includes short and long-term debt. Capital includes short and long-term debt, shareholders’ equity, and minority interests.<br />
(4) Debt net of cash, excluding restricted cash. The ratio of net debt to capital including restricted cash is (16.3) percent for <strong>2004</strong>.<br />
R ECORD EARNINGS IN <strong>2004</strong><br />
Functional Earnings and Net Income<br />
Upstream Downstream Chemical All Other Segments Net Income<br />
(billions of dollars)<br />
30<br />
25<br />
20<br />
15<br />
10<br />
5<br />
0<br />
–2<br />
2000 2001 2002 2003 <strong>2004</strong><br />
EXXON MOBIL CORPORATION • <strong>2004</strong> SUMMARY ANNUAL REPORT<br />
S UPERIOR SHAREHOLDER RETURNS (1)<br />
<strong>ExxonMobil</strong> S&P 500<br />
(percent per year)<br />
30<br />
25<br />
20<br />
15<br />
10<br />
5<br />
0<br />
–5<br />
1 Year 5 Years 10 Years 20 Years<br />
(1) The annualized appreciation of the stock price over a period with dividends<br />
reinvested, and excluding trading commissions and taxes.<br />
_<br />
_
C ORPORATE 5<br />
Disciplined execution of the right strategies and activities generates superior results.<br />
At <strong>ExxonMobil</strong>, decisions are made to maximize results for the long term. They are rooted<br />
in long-held corporate values and carried out with the highest standards and integrity.<br />
Our Management Committee oversees and provides<br />
leadership for the disciplined execution of our global business.<br />
Each of the five members is functionally responsible for a<br />
part of the operating business and business services.<br />
All major decisions, strategic plans, and results are reviewed<br />
by this group. The committee works as an integrated team,<br />
assessing reward and risk, and making the decisions that<br />
will shape our business and maximize returns for our shareholders.<br />
Collectively, the committee brings over 180 years of<br />
company and industry experience to the decisions they make.<br />
The Management Committee ensures that the core values<br />
and principles that have established us as the world’s<br />
premier petroleum and petrochemical company are reflected<br />
in the Corporation’s long-term strategies and day-to-day<br />
activities. Foremost among them is the straightforward<br />
approach and integrity with which we conduct our business,<br />
including our relationships with shareholders, governments,<br />
customers, business partners, employees, and communities.<br />
Anchored by our unmatched financial strength and industryleading<br />
technology, our disciplined approach to the business<br />
enables us to fulfill our basic economic function and responsibilities<br />
as a corporate citizen. Our challenge is to meet the<br />
needs of a growing worldwide economy, while improving the<br />
communities where we operate, and delivering unparalleled<br />
long-term value to our shareholders.<br />
The Management Committee consists of, from left:<br />
Ed Galante, Senior Vice President;<br />
Rex Tillerson, President;<br />
Lee Raymond, Chairman and CEO;<br />
Stuart McGill, Senior Vice President; and,<br />
Steve Simon, Senior Vice President.<br />
R OCE LEADERSHIP<br />
<strong>Annual</strong> Return on Average Capital Employed<br />
<strong>ExxonMobil</strong> Integrated Oil Competitor Average (1)<br />
(percent)<br />
25<br />
20<br />
15<br />
10<br />
5<br />
0<br />
2000 2001 2002 2003 <strong>2004</strong><br />
(1) Royal Dutch Shell, BP, and ChevronTexaco values calculated on a consistent basis<br />
with <strong>ExxonMobil</strong>, based on public information. Competitor data estimated for <strong>2004</strong>.<br />
EXXON MOBIL CORPORATION • <strong>2004</strong> SUMMARY ANNUAL REPORT
6<br />
TECHNOLOGY<br />
Technology<br />
Our unwavering commitment to research underscores a fundamental belief that technology is<br />
absolutely vital to our effort to provide reliable and affordable energy supplies. Increasingly,<br />
proprietary technology solutions are a key differentiating factor for <strong>ExxonMobil</strong>.<br />
<strong>ExxonMobil</strong> invests over $600 million per year on proprietary<br />
research. During the past 10 years, we have received over<br />
10,000 patents. We balance our investments between<br />
extensions of existing technology and breakthrough<br />
research. The development of extensions is prioritized by<br />
business need and is focused on the development of<br />
Above – Proprietary hardware and software have advanced Remote<br />
Reservoir Resistivity Mapping (R3M) for direct hydrocarbon detection.<br />
Right – Our advances in 3D visualization are resulting in more<br />
efficient development and production of oil and gas fields.<br />
We continue to set new industry benchmarks in drilling and completions.<br />
Above – <strong>ExxonMobil</strong> is improving well<br />
production rates and reducing well-related<br />
problems using technologies validated<br />
by learnings in the laboratory and the field.<br />
Right – <strong>ExxonMobil</strong> engineers use an<br />
integrated suite of technologies to drill and<br />
complete complex extended-reach wells.<br />
EXXON MOBIL CORPORATION • <strong>2004</strong> SUMMARY ANNUAL REPORT<br />
improved technologies for application to day-to-day<br />
operations. A significant portion of our research effort is<br />
also aimed at discovering next-generation and breakthrough<br />
technologies that have the potential to provide a stepchange<br />
to the Corporation’s competitive position and<br />
financial performance.<br />
We believe our understanding of the subsurface is unparalleled. We continue to<br />
develop new tools to add to our industry-leading suite of proprietary technology.<br />
≈6 miles
Technology is the key to unlocking the value of remote resources.<br />
Above – The Nebula-20 catalyst enables<br />
us to meet more stringent ultralowsulfur<br />
specifications, while minimizing<br />
investment.<br />
Left – With our partners, <strong>ExxonMobil</strong><br />
developed, and successfully fieldtested<br />
under arctic conditions, the<br />
world’s strongest linepipe (X120),<br />
which could be used for the<br />
proposed Alaska Gas pipeline.<br />
Right – We are commercializing<br />
our industry-leading gas-to-liquids<br />
(GTL) technology to make high-quality<br />
diesel and lube basestocks.<br />
Higher value from proprietary catalysts, applied across our unparalleled portfolio of<br />
refining and chemical plants, gives <strong>ExxonMobil</strong> a competitive advantage.<br />
T ECHNOLOGY 7<br />
Left – Metallocene technology has<br />
allowed us to develop a broad<br />
suite of chemical products with<br />
enhanced properties ranging<br />
from polyethylenes that provide<br />
outstanding stiffness and clarity<br />
to revolutionary elastomers.<br />
<strong>ExxonMobil</strong> uses state-of-the-art research tools to develop new and improved<br />
processes and catalyst systems.<br />
Left – High-throughput experimentation<br />
(HTE) is accelerating our research<br />
and development, especially for new<br />
catalysts in both refining and chemicals.<br />
Right – Competitive advantages<br />
generated by process technology<br />
include the ability to process low-cost<br />
feedstock, increase yield, and add<br />
effective capacity for significantly less<br />
investment than new grassroots plants.<br />
EXXON MOBIL CORPORATION • <strong>2004</strong> SUMMARY ANNUAL REPORT
UPSTREAM<br />
Kizomba B utilized a design similar to<br />
Kizomba A in order to reduce costs<br />
and cycle time. The project is expected<br />
to develop 1 billion barrels of oil from<br />
the Kissanje and Dikanza fields.<br />
In December <strong>2004</strong>, the tension leg<br />
platform left the construction yard<br />
in Korea and will be installed on site in<br />
Angola in early 2005.
Consistency is key to leading results. <strong>ExxonMobil</strong>’s<br />
Upstream sets benchmarks as an industry leader in project<br />
execution and operating performance.<br />
Exploration, Development, Production, and Gas & Power Marketing<br />
<strong>2004</strong> RESULTS AND HIGHLIGHTS<br />
Earnings were $16.7 billion, up 15 percent and a record,<br />
primarily due to strong oil and natural gas prices.<br />
Upstream return on average capital employed was<br />
33 percent in <strong>2004</strong> and averaged 29 percent over the<br />
past five years.<br />
Net income per oil-equivalent barrel was $10.81.<br />
Total liquids and gas production available for sale was<br />
4.2 million oil-equivalent barrels per day, exceeding all<br />
competitors. Strong liquids production growth of 2.2 percent<br />
was offset by lower gas production, which declined<br />
2.5 percent.<br />
Proved oil and gas reserve additions totaled 1.8 billion<br />
oil-equivalent barrels, excluding asset sales and year-end<br />
price/cost revisions. The Corporation replaced 112 percent<br />
of production including asset sales, and 125 percent<br />
excluding asset sales. This is the 11th year in a row that<br />
<strong>ExxonMobil</strong> has more than replaced reserves produced.<br />
At 22 billion oil-equivalent barrels, <strong>ExxonMobil</strong>’s proved<br />
reserves are the highest among nongovernmental producers.<br />
New field resource additions totaled 2.9 billion oil-equivalent<br />
barrels in <strong>2004</strong>. <strong>ExxonMobil</strong>’s resource base now stands<br />
at 73 billion oil-equivalent barrels.<br />
Finding costs were $0.44 per oil-equivalent barrel.<br />
Upstream capital and exploration spending remained<br />
robust at $11.7 billion, driven by a strong portfolio of<br />
development projects.<br />
U PSTREAM RETURN ON AVERAGE CAPITAL EMPLOYED<br />
<strong>ExxonMobil</strong> Integrated Oil Competitor Average<br />
(percent)<br />
(1)<br />
35<br />
30<br />
25<br />
20<br />
15<br />
10<br />
5<br />
0<br />
U PSTREAM NET INCOME PER BARREL<br />
<strong>ExxonMobil</strong> Integrated Oil Competitor Average<br />
(dollars per oil-equivalent barrel)<br />
(1)<br />
12<br />
10<br />
8<br />
6<br />
4<br />
2<br />
0<br />
2000 2001 2002 2003 <strong>2004</strong><br />
2000 2001 2002 2003 <strong>2004</strong><br />
(1) Royal Dutch Shell, BP, and ChevronTexaco values calculated on a consistent basis<br />
with <strong>ExxonMobil</strong>, based on public information. Competitor data estimated for <strong>2004</strong>.<br />
STATISTICAL RECAP <strong>2004</strong> 2003 2002 2001 2000<br />
Earnings (millions of dollars) 16,675 14,502 9,598 10,736 12,685<br />
Liquids production (thousands of barrels per day) 2,571 2,516 2,496 2,542 2,553<br />
Natural gas production available for sale (millions of cubic feet per day) 9,864 10,119 10,452 10,279 10,343<br />
Oil-equivalent production (thousands of barrels per day) 4,215 4,203 4,238 4,255 4,277<br />
Proved reserves replacement (1) (percent) 125 107 118 111 112<br />
New field resource additions (millions of oil-equivalent barrels) 2,940 2,110 2,150 2,490 2,120<br />
Average capital employed (millions of dollars) 50,642 47,672 43,064 40,029 41,218<br />
Return on average capital employed (percent) 32.9 30.4 22.3 26.8 30.8<br />
Capital and exploration expenditures (millions of dollars) 11,715 11,988 10,394 8,816 6,933<br />
(1) Excluding asset sales and year-end price/cost revisions.<br />
EXXON MOBIL CORPORATION • <strong>2004</strong> SUMMARY ANNUAL REPORT<br />
9
10<br />
Our Upstream Business<br />
<strong>ExxonMobil</strong>’s industry-leading, geographically diverse<br />
Upstream business includes the largest reserve base among<br />
nongovernmental oil companies, a development portfolio<br />
of over 100 projects involving more than $80 billion in net<br />
investment, the leading production base, and global gas<br />
and power marketing activities.<br />
<strong>2004</strong> Global Upstream <strong>Summary</strong><br />
Countries with operations . . . . . . . . . . . . . . . . . . . . . . . . . . . . 37<br />
Resource base (oil-equivalent barrels) . . . . . . . . . . . . . . . 73 billion<br />
Reserves (oil-equivalent barrels) . . . . . . . . . . . . . . . . . . . 22 billion<br />
Exploration acreage (gross acres) . . . . . . . . . . . . . . . . 109 million<br />
Production (oil-equivalent barrels per day) . . . . . . . . . . . 4.2 million<br />
Producing wells (gross) . . . . . . . . . . . . . . . . . . . . . . 59 thousand<br />
Functional Organization Capitalizes on Strengths<br />
<strong>ExxonMobil</strong> has an experienced, dedicated, and diverse<br />
work force of exceptional quality. The Upstream is<br />
comprised of four global functional organizations –<br />
Exploration, Development, Production, and Gas & Power<br />
Marketing. Each organization is supported by the Upstream<br />
Research Company. This global functional structure leverages<br />
our upstream strengths. Our structure was not created<br />
EXXON MOBIL CORPORATION • <strong>2004</strong> SUMMARY ANNUAL REPORT<br />
OUR UPSTREAM STRATEGIES<br />
Regardless of the business environment, our core<br />
upstream strategies continue to deliver solid results.<br />
They are enhanced by an unparalleled commitment to<br />
technology, leveraged by our global functional organization,<br />
and supported by our dedication to superior<br />
execution, operational excellence, and a continual focus<br />
on cost management.<br />
Although conditions and opportunities change from year<br />
to year, our core strategies remain constant. These key<br />
strategies are:<br />
■ Maximize profitability of existing oil<br />
and gas production;<br />
■ Identify and pursue all attractive<br />
exploration opportunities;<br />
■ Invest in projects that deliver superior returns; and,<br />
■ Capitalize on growing natural gas and power markets.<br />
overnight. It has been developed and refined over a long<br />
period of time, and reflects a constancy of purpose that is<br />
grounded in our long-term view of the business. It is not<br />
easy to duplicate, and is a competitive advantage.<br />
Chad production exceeded 200 thousand barrels of oil per day in <strong>2004</strong>. The Chad project will recover an estimated 1 billion barrels (gross)<br />
of oil. Above, Dingamyo Mbao surveys operations at the Central Treating Facility at Kome, Chad.
A Strong, Diverse Production Base<br />
Large, highly profitable, and established oil and gas operations<br />
in North America, Europe, Asia Pacific, West Africa,<br />
and the Caspian form a strong foundation for our business.<br />
Our portfolio includes about 59,000 gross productive wells<br />
from more than 8,300 reservoirs and nearly 600 offshore<br />
platforms. This breadth provides an efficient base to<br />
generate new production from work programs and<br />
near-field opportunities.<br />
Profitable Growth Opportunities<br />
<strong>ExxonMobil</strong> Upstream has over 70 major development<br />
projects under way. From the industry’s largest portfolio of<br />
opportunities, we are able to pursue all projects and select<br />
the best according to our rigorous investment criteria.<br />
We gain significant scale advantages by leveraging<br />
best practices and technology across all opportunities.<br />
Our processes ensure we not only optimize profitability,<br />
but also mitigate risk through prudent diversification.<br />
We brought eight major new projects on stream in <strong>2004</strong>,<br />
with targeted gross peak liquids production of 420 thousand<br />
barrels per day (average <strong>ExxonMobil</strong> interest, 39 percent) and<br />
gross peak gas production of 1.7 billion cubic feet per day<br />
(average <strong>ExxonMobil</strong> interest, 35 percent). Over the last six<br />
years, we started up over 70 major projects that we expect<br />
will produce 3.7 billion oil-equivalent barrels (net) by 2010.<br />
As future development projects bring new resources on line,<br />
we expect a shift in the geographic mix of production<br />
volumes. Growth areas include West Africa, the Middle East,<br />
the Caspian, and Russia. We expect these areas will<br />
contribute over 40 percent of producing volumes in 2010<br />
versus about 20 percent today. Established areas in<br />
North America, Europe, and Asia Pacific are still expected<br />
to provide in excess of half our total production in 2010.<br />
Geopolitics, economics, and technology are opening up new<br />
areas for development that present the industry with new<br />
challenges – challenges that play to <strong>ExxonMobil</strong>’s strengths.<br />
P R ODUCTION VOLUME CONTRIBUTION BY RESOURCE TYPE<br />
Deepwater<br />
Extra Heavy Oil<br />
Arctic<br />
Tight Gas<br />
Acid/Sour Gas<br />
Conventional<br />
Projects<br />
LNG<br />
Conventional<br />
Base and<br />
Work Programs<br />
We expect major development projects currently in the pipeline<br />
will develop up to 24 billion net oil-equivalent barrels of resources.<br />
Shown here, development drilling on Angola Block 15.<br />
We are investing now to capitalize on many new opportunities<br />
that are often in remote areas or involve difficult physical<br />
environments, technical challenges, or frontier resources.<br />
Examples include arctic and deepwater resources as well as<br />
LNG, tight gas, and heavy oil. We expect production from<br />
these opportunities to nearly double by 2010 even while<br />
conventional volumes remain significant at about 60 percent.<br />
Commitment to Technology<br />
<strong>2004</strong> 2010<br />
Oil and gas resources remain plentiful, but it takes the<br />
best technology and an organization with the know-how to<br />
profitably find, develop, and produce them. New technology<br />
gives us the tools and understanding to improve recovery<br />
from existing fields and to develop opportunities that were<br />
previously out of reach. For example, 40 years ago, 500 feet<br />
of water was the deepest industry had drilled. With new technology,<br />
we have drilled wells in excess of 7,000 feet of water.<br />
Deepwater<br />
Extra Heavy Oil<br />
Arctic<br />
Tight Gas<br />
Acid/Sour Gas<br />
LNG<br />
Conventional<br />
Projects<br />
U PSTREAM 11<br />
Conventional<br />
Base and<br />
Work Programs<br />
EXXON MOBIL CORPORATION • <strong>2004</strong> SUMMARY ANNUAL REPORT
12<br />
OUR WORLDWIDE ACTIVITIES<br />
Resource & Reserve Additions in <strong>2004</strong><br />
<strong>ExxonMobil</strong> continued to explore for and add significant new<br />
resources in <strong>2004</strong> – 2.9 billion oil-equivalent barrels in total.<br />
This marks the fifth consecutive year that resource additions<br />
exceeded 2 billion oil-equivalent barrels. Key resource<br />
additions were made in Qatar, the United States, Canada,<br />
and Nigeria. Technology applications have held finding<br />
costs below $0.75 per barrel for the last five years.<br />
We added 1.8 billion oil-equivalent barrels to proved<br />
reserves in <strong>2004</strong>, excluding year-end price/cost revisions.<br />
The Corporation replaced 112 percent of production<br />
including asset sales and 125 percent excluding asset sales.<br />
We have also stated, for the first time, our <strong>2004</strong> reserves<br />
to reflect the impact to the proved reserve base from using<br />
prices on December 31, <strong>2004</strong>. Including year-end price/cost<br />
revisions and asset sales, we replaced 83 percent of<br />
production. Refer to our 2005 Proxy Statement, page A58,<br />
for more information.<br />
Year-end price/cost revisions in <strong>2004</strong> were due to unusually<br />
low bitumen prices on December 31, <strong>2004</strong>, at our<br />
Cold Lake heavy oil development. However, prices increased<br />
substantially after December 31, and resulted in the<br />
rebooking of approximately 0.5 billion oil-equivalent barrels<br />
to the proved category at Cold Lake in 2005.<br />
<strong>ExxonMobil</strong> has always taken a rigorous and structured<br />
approach to booking proved reserves. All reserve additions<br />
LNG activities in Qatar represented the largest source of proved<br />
reserve adds in <strong>2004</strong> – a result of the successful, growing partnership<br />
between <strong>ExxonMobil</strong> and Qatar Petroleum.<br />
EXXON MOBIL CORPORATION • <strong>2004</strong> SUMMARY ANNUAL REPORT<br />
<strong>2004</strong> Global Production <strong>Summary</strong><br />
Region Liquids Gas Percent*<br />
(kBD) (MCFD)<br />
United States . . . . . . . . . . . . . . . . . . . . .557 1,947 21<br />
Canada . . . . . . . . . . . . . . . . . . . . . . . . . .355 972 12<br />
Europe . . . . . . . . . . . . . . . . . . . . . . . . . . .583 4,614 32<br />
Africa . . . . . . . . . . . . . . . . . . . . . . . . . . . .572 – 14<br />
Middle East . . . . . . . . . . . . . . . . . . . . . . .158 642 6<br />
Asia Pacific . . . . . . . . . . . . . . . . . . . . . . .202 1,519 11<br />
Other Areas . . . . . . . . . . . . . . . . . . . . . .144 170 4<br />
Total Worldwide . . . . . . . . . . . . . . . .2,571 9,864 100<br />
* Percent of oil-equivalent total<br />
and revisions are subject to a long-standing, structured<br />
management review process regarding the reasonable<br />
certainty of recovery, which is the standard set by the<br />
Securities and Exchange Commission.<br />
THE AMERICAS<br />
<strong>ExxonMobil</strong>’s operations in North<br />
and South America contributed<br />
about 42 percent of <strong>2004</strong><br />
Upstream earnings. We optimize<br />
this diverse portfolio through investment<br />
in high-return opportunities,<br />
while enhancing existing capacity and<br />
selectively divesting properties when it adds value.<br />
For example, in <strong>2004</strong>, we arranged to farm out some of<br />
our undeveloped Canadian properties, transfer a number of<br />
mature producing assets in West Texas, and, with a partner,<br />
jointly explore deep gas plays on more than 800,000 acres<br />
onshore Louisiana and offshore Gulf of Mexico. Opportunities<br />
like these maximize value from mature properties and add<br />
resources efficiently and through broader application of<br />
proprietary technologies.<br />
United States<br />
We continue to develop one of the leading acreage positions<br />
in the Gulf of Mexico. In the ultra-deepwater foldbelt, we<br />
participated in the successful appraisal of the St. Malo discovery<br />
(<strong>ExxonMobil</strong> interest, 4 percent) in 2003. This provided us with<br />
valuable geotechnical data to assess the exploration potential<br />
of surrounding <strong>ExxonMobil</strong> acreage in the Walker Ridge area,<br />
where we are the predominant acreage holder.<br />
Additional development projects are slated to add to the<br />
production from more than 40 existing Gulf of Mexico fields<br />
where <strong>ExxonMobil</strong> has an interest. Production began in <strong>2004</strong><br />
from the Llano field (<strong>ExxonMobil</strong> interest, 23 percent) and the<br />
South Diana field (<strong>ExxonMobil</strong> interest, 100 percent). The startup<br />
of the deepwater Thunder Horse development (<strong>ExxonMobil</strong><br />
interest, 25 percent) is projected for the second half of 2005.
U PSTREAM 13<br />
<strong>ExxonMobil</strong> continues to be a major producer in the North Sea. In addition to projects that leverage existing infrastructure, we are progressing<br />
new opportunities such as the Kristin development in Norway. Above, the semisubmersible platform is under construction in Norway.<br />
The diversity of <strong>ExxonMobil</strong>’s portfolio<br />
allows us to pursue all opportunities and<br />
select the best for investment.<br />
In Alaska, we are in fiscal discussions with the state,<br />
a step toward the development of significant North Slope<br />
gas resources, which total 34 trillion cubic feet (gross).<br />
We are also commercializing tight gas resources from our<br />
significant acreage position in the Piceance Basin.<br />
Canada<br />
The main regulatory applications were filed in <strong>2004</strong> with<br />
Canadian authorities to build a 1.2-billion-cubic-foot-per-day,<br />
800-mile pipeline as part of the Mackenzie Gas Project<br />
(<strong>ExxonMobil</strong> interest, 57 percent). The project will initially<br />
develop three large gas fields totaling 6 trillion cubic feet of<br />
gas (gross), at a peak rate of 850 million cubic feet per day,<br />
with start-up projected by the end of the decade.<br />
Offshore eastern Canada, the Sable Offshore Energy<br />
Project (<strong>ExxonMobil</strong> interest, 60 percent) started up South<br />
Venture in <strong>2004</strong>, ahead of schedule. This fifth field in the<br />
project is an example of the benefit of our “design one,<br />
build multiple” approach.<br />
In western Canada, heavy oil operations in Cold Lake<br />
(Imperial Oil interest, 100 percent) and the Syncrude tar<br />
sands project (Imperial Oil interest, 25 percent) accounted for<br />
almost 370 thousand barrels per day of production (gross).<br />
An upgrader expansion at Syncrude is scheduled for<br />
completion in 2006.<br />
South America<br />
<strong>ExxonMobil</strong> produces 120 thousand barrels per day (gross)<br />
of extra-heavy crude from the Cerro Negro field (<strong>ExxonMobil</strong><br />
interest, 42 percent) in Venezuela. The heavy oil is then<br />
upgraded to synthetic crude oil. Also in Venezuela, extended<br />
production tests are under way at La Ceiba as part of the<br />
commercialization evaluation plan for the block.<br />
Offshore Colombia, <strong>ExxonMobil</strong> began exploration activities<br />
covering the 11-million-acre Tayrona block (<strong>ExxonMobil</strong><br />
interest, 40 percent). We utilized our proprietary Remote<br />
Reservoir Resistivity Mapping (R3M) technology to progress<br />
evaluation of the block.<br />
EUROPE<br />
<strong>ExxonMobil</strong> is the largest net<br />
producer of hydrocarbons in Europe.<br />
<strong>ExxonMobil</strong>’s European operations<br />
contributed about 26 percent of<br />
<strong>2004</strong> Upstream earnings. Extensive<br />
North Sea oil and gas operations, and<br />
significant onshore natural gas production,<br />
are among the Company’s key assets.<br />
In <strong>2004</strong>, several major North Sea projects started up that<br />
leveraged existing infrastructure and increased production.<br />
These include Goldeneye (<strong>ExxonMobil</strong> interest, 39 percent),<br />
Scoter (<strong>ExxonMobil</strong> interest, 44 percent), and the Sleipner<br />
West Compression project and Alpha North satellite development<br />
(<strong>ExxonMobil</strong> interest, 32 percent). These projects<br />
are expected to develop over 500 million oil-equivalent<br />
barrels (gross).<br />
EXXON MOBIL CORPORATION • <strong>2004</strong> SUMMARY ANNUAL REPORT
14<br />
New deepwater North Sea developments are also under<br />
way at Kristin (<strong>ExxonMobil</strong> interest, 11 percent) and the<br />
giant Ormen Lange field (<strong>ExxonMobil</strong> interest, 7 percent).<br />
Together they are expected to produce 2.5 billion cubic<br />
feet of gas per day (gross).<br />
<strong>ExxonMobil</strong> is the largest gas producer in continental Europe<br />
where the world-class Groningen field in the Netherlands,<br />
and key fields in Germany, combine to help meet European<br />
gas demand. Compression projects are under way to ensure<br />
continued long-term integrity of the facilities and to extend<br />
field life.<br />
Restructuring of our European gas marketing operations<br />
has progressed in anticipation of the impact of the European<br />
Gas Directives. Part of this effort includes an agreement to<br />
restructure the ownership and business activities of Gasunie<br />
in the Netherlands. This will position <strong>ExxonMobil</strong> to compete<br />
effectively in the future European gas market.<br />
AFRICA<br />
In Africa, <strong>ExxonMobil</strong> has a<br />
substantial, profitable net liquids<br />
production base of over<br />
570 thousand barrels per day, up<br />
29 percent from 2003 with substantial<br />
further growth opportunities being<br />
developed. Our operations in Africa<br />
contributed about 13 percent of <strong>2004</strong> Upstream earnings.<br />
We have a high-quality acreage position, including interests<br />
in 19 deepwater blocks offshore Africa covering almost<br />
21 million gross acres, and a large number of new development<br />
projects recently completed and coming on stream.<br />
In Angola, the Company has interests in five deepwater<br />
blocks that cover 4.5 million acres. With our co-venturers,<br />
we have announced 38 discoveries, which represent recoverable<br />
resource potential of almost 12 billion oil-equivalent<br />
barrels (gross).<br />
When the <strong>ExxonMobil</strong>-operated Kizomba A development<br />
(<strong>ExxonMobil</strong> interest, 40 percent) started up in August <strong>2004</strong>,<br />
it set an industry record for project execution time from<br />
contract award to first oil for a development of this size.<br />
Production from the world’s largest floating production,<br />
storage, and offloading (FPSO) vessel has already ramped<br />
up to over 200 thousand barrels of oil per day (gross).<br />
Kizomba A is one of three world-class developments on<br />
the prolific Angola Block 15 that are ultimately expected to<br />
develop over 2.5 billion barrels of oil at a total investment of<br />
about $10 billion (gross). Sister development Kizomba B<br />
EXXON MOBIL CORPORATION • <strong>2004</strong> SUMMARY ANNUAL REPORT<br />
incorporates our “design one, build multiple” approach that<br />
captures substantial cost savings. Planning is under way for<br />
Kizomba C, which will include the fourth and fifth offshore<br />
production centers on Block 15. Kizomba B and C are<br />
expected to start up in 2005 and 2007, respectively.<br />
Construction is also in progress on the Dalia and Rosa Area<br />
projects (<strong>ExxonMobil</strong> interest, 20 percent) on Angola Block<br />
17 with anticipated start-ups in 2006 and 2007, respectively.<br />
In Nigeria, <strong>ExxonMobil</strong> is the operator for over 90 offshore<br />
platforms and other facilities. In <strong>2004</strong>, <strong>ExxonMobil</strong> produced<br />
570 thousand barrels of liquids per day (gross) as a participant<br />
in a joint venture (<strong>ExxonMobil</strong> interest, 40 percent for<br />
crude oil) with the Nigerian National Petroleum Corporation.<br />
We capture significant savings with<br />
approaches such as “design one, build<br />
multiple” and our early production system.<br />
Three major projects are progressing to increase future<br />
production capacity from the shallow water Nigerian shelf.<br />
Full-field development at Yoho is expected to be completed<br />
in 2005. Successful implementation of our first early production<br />
system (EPS) in 2002 improved returns by enabling first<br />
production more than three years ahead of full-field production.<br />
Together, the East Area Additional Oil Project and the<br />
East Area Natural Gas Liquids Project are expected to<br />
recover over 800 million oil-equivalent barrels of oil and<br />
natural gas liquids, and will significantly reduce gas flaring.<br />
The Nigerian deepwater project Bonga (<strong>ExxonMobil</strong> interest,<br />
20 percent), is expected to start up in 2005. First oil from the<br />
<strong>ExxonMobil</strong>-operated deepwater project, Erha (<strong>ExxonMobil</strong><br />
interest, 56 percent), is anticipated in 2006. In <strong>2004</strong>, the first<br />
subsea integration test ever conducted in West Africa took<br />
place in Nigeria for the Erha project. This critical milestone<br />
was successfully completed and represented a move<br />
forward in capability for West Africa.<br />
In Equatorial Guinea, total production from Zafiro<br />
(<strong>ExxonMobil</strong> interest, 71 percent) increased 40 percent over<br />
2003 with the ramp-up from the Southern Expansion Area<br />
Project. <strong>ExxonMobil</strong>’s use of one of three EPSs resulted in<br />
rapid start-up and lower cost. In Chad (<strong>ExxonMobil</strong> interest,<br />
40 percent), liquids production exceeded 200 thousand<br />
barrels per day (gross) with the addition of production from<br />
the Bolobo area. Planned Chad developments are ultimately<br />
expected to produce 1 billion barrels of oil (gross).
Above – Installation of the giant FPSO vessel at Kizomba A in Angola with the tension leg platform (TLP) visible in the background.<br />
Below – Offloading oil at Kizomba A to a tanker for transport to market.
16<br />
MIDDLE EAST<br />
<strong>ExxonMobil</strong> has producing operations<br />
in Qatar, Abu Dhabi, and<br />
Yemen. There is also significant<br />
growth potential throughout the<br />
Middle East, where our project<br />
management expertise, coupled with<br />
technology leadership, makes us a partner<br />
of choice with host governments. <strong>ExxonMobil</strong> is pursuing<br />
opportunities in Qatar, Kuwait, and Abu Dhabi.<br />
<strong>ExxonMobil</strong>’s technology advantage<br />
plays a key role in commercializing<br />
challenging new resources.<br />
We are supporting Qatar Petroleum in the development of the<br />
North Field, the largest nonassociated gas field in the world.<br />
Resources to be developed through existing and planned<br />
LNG trains, the gas-to-liquids (GTL) project, and pipeline<br />
sales projects exceed 25 billion oil-equivalent barrels (gross).<br />
Our existing RasGas and Qatargas joint ventures<br />
(<strong>ExxonMobil</strong> interest, 18 to 34 percent) produced 18.7 million<br />
tons last year (gross) and sold LNG to customers in Japan,<br />
Korea, India, Spain, the United Kingdom, and the United<br />
States. RasGas started up Train 3 in February <strong>2004</strong>. RasGas<br />
Trains 4 and 5 are expected to commence production in<br />
2005 and 2007, respectively, with sales predominantly<br />
to Europe.<br />
<strong>ExxonMobil</strong> and Qatar Petroleum are progressing plans for<br />
two additional projects to each supply LNG to Europe and<br />
the United States. The four 7.8-million-ton-per-annum trains<br />
will be the largest ever constructed. Two trains are expected<br />
LNG TECHNOLOGY LEADERSHIP<br />
<strong>ExxonMobil</strong> is well-positioned to continue its leadership in<br />
the growing LNG trade. Our knowledge of world markets<br />
combined with advanced technology have allowed us to<br />
commercialize new resources. Technology has played<br />
400<br />
a very important part in enabling economic supply of gas<br />
from remote sources. For example, our new LNG liquefac- 300<br />
tion trains will increase in size from around 3 million tons<br />
per annum of capacity in 2000 to almost 8 million tons<br />
200<br />
by 2008. Likewise, we are currently designing LNG ships<br />
as large as 250,000 cubic meters, nearly double the<br />
100<br />
140,000-cubic-meter vessels commonly in use today.<br />
As a result of these scale advantages, unit costs are<br />
0<br />
1983 1999 2003 2005 2008<br />
expected to decline by over 30 percent. ;;<br />
EXXON MOBIL CORPORATION • <strong>2004</strong> SUMMARY ANNUAL REPORT<br />
<strong>ExxonMobil</strong> is a leader in developing large-scale integrated LNG<br />
projects. The gas lines shown above will handle over 3 billion cubic<br />
feet per day of natural gas from Ras Laffan offshore blocks.<br />
to start up in 2008, one train in 2009, and another in 2010.<br />
Plans call for integration through the LNG supply chain,<br />
from liquefaction trains that are 60 percent larger than<br />
current standards, to transportation on larger ships, and<br />
regasification terminals in the United States and Europe.<br />
In <strong>2004</strong>, we announced an agreement to build what is the<br />
world’s largest, fully integrated GTL plant planned to date.<br />
Upstream operations are expected to produce 1.4 billion<br />
cubic feet per day (gross) of feed gas and 165 thousand<br />
barrels of condensate and natural gas liquids per day<br />
(gross). The GTL plant is expected to convert the feed gas<br />
to yield 154 thousand barrels per day (gross) of products<br />
such as low-sulfur diesel, lube basestocks, and naphtha.<br />
Finally, in 2005, the first phase of the multiphase Al Khaleej<br />
Gas Project (<strong>ExxonMobil</strong> interest, 100 percent) is anticipated<br />
to start up with pipeline sales to domestic users in Qatar.<br />
C OST LEADERSHIP – LNG CONSTRUCTION<br />
Left Scale: Right Scale:<br />
Engineering, Procurement, and Construction Cost Train Size<br />
(dollars per ton) (million tons per annum)<br />
;<br />
;;;<br />
;;; ;;<br />
;;;<br />
;;<br />
8<br />
6<br />
4<br />
2<br />
0
R USSIA AND CASPIAN<br />
<strong>ExxonMobil</strong> operates the<br />
$12 billion Sakhalin-1 project<br />
(<strong>ExxonMobil</strong> interest, 30 percent)<br />
offshore the Russian Far East.<br />
Total recoverable resources are<br />
estimated at 2.3 billion barrels of oil<br />
and 17 trillion cubic feet of gas (gross).<br />
In the first phase of the Chayvo field development, extendedreach<br />
wells were drilled from onshore to targets almost six<br />
miles offshore. This technology saved over $200 million.<br />
An early production systems (EPS) will allow first oil and gas<br />
sales in 2005, followed by full-field production in 2006.<br />
In the Caspian, <strong>ExxonMobil</strong> has the unique position of participating<br />
in the development of three of the largest fields in the<br />
world – Tengiz and Kashagan in Kazakhstan, and Azeri-<br />
Chirag-Gunashli (ACG) in Azerbaijan. Phased development<br />
of these projects will continue well into the next decade.<br />
Liquids production capacity at Tengiz (<strong>ExxonMobil</strong> interest,<br />
25 percent) is currently 300 thousand barrels per day (gross).<br />
Expected Project Start-Ups<br />
<strong>ExxonMobil</strong><br />
Working<br />
Target Peak<br />
Production (Gross) _<br />
Interest Liquids Gas<br />
<strong>2004</strong><br />
(%) (kBD) (MCFD)<br />
Angola – Kizomba A . . . . . . . . . . . . . . . . . 40 250 – ■<br />
Canada – Sable Energy Tier 2 –<br />
South Venture . . . . . . . . . . . . . . . . . . . . . . 60 10 140 ■<br />
Chad – Bolobo . . . . . . . . . . . . . . . . . . . . . . . 40 60 – ■<br />
Norway – Sleipner West Alpha North 32 15 195 ●<br />
Norway – Sleipner West Compression 32 20 250 ●<br />
Qatar – RasGas Train 3 . . . . . . . . . . . . . . 29 30 725 ▲<br />
U.K. – Goldeneye . . . . . . . . . . . . . . . . . . . . 39 30 260 ●<br />
U.K. – Scoter . . . . . . . . . . . . . . . . . . . . . . . . . 44 5 125 ●<br />
2005 (Projected)<br />
Angola – Kizomba B . . . . . . . . . . . . . . . . . 40 250 – ■<br />
Azerbaijan – Azeri-Chirag-<br />
Gunashli (ACG) Phase 1 . . . . . . . . . . 8 325 – ●<br />
Nigeria – Bonga . . . . . . . . . . . . . . . . . . . . . . 20 200 150 ●<br />
Qatar – Al Khaleej Gas Phase 1 . . . . .100 50 600 ■<br />
Qatar – RasGas Train 4 . . . . . . . . . . . . . . 34 45 740 ▲<br />
Russia – Sakhalin-1<br />
(Chayvo) Phase 1 . . . . . . . . . . . . . . . . . . 30 250 1,000 ■<br />
U.K. – Arthur . . . . . . . . . . . . . . . . . . . . . . . . . 70 5 120 ■<br />
U.S. – Thunder Horse . . . . . . . . . . . . . . . 25 250 200 ●<br />
Operatorship:<br />
■ = <strong>ExxonMobil</strong> Operated<br />
▲ = Joint Operation ● = Operated by Others<br />
– Not applicable.<br />
U PSTREAM 17<br />
Expansions at Tengiz are planned to add 520 thousand<br />
barrels per day (gross) with first-phase construction under<br />
way, and projected start-up in 2006.<br />
Development planning and drilling continues on the first<br />
phase of the super-giant Kashagan field (<strong>ExxonMobil</strong><br />
interest, 17 percent) that is expected to bring 450 thousand<br />
barrels per day (gross) of production on line. Future phases<br />
are expected to increase peak production to over 1 million<br />
barrels of oil per day (gross).<br />
Production from the Chirag field in Azerbaijan totaled<br />
130 thousand barrels per day (gross) in <strong>2004</strong>. Developed<br />
resources from the planned three-phase ACG project<br />
(<strong>ExxonMobil</strong> interest, 8 percent) are expected to total<br />
5.4 billion oil-equivalent barrels (gross). Phase 1 development<br />
of the Central Azeri field started up in February 2005 and<br />
is expected to expand production by 325 thousand barrels<br />
per day (gross).<br />
ASIA PACIFIC<br />
<strong>ExxonMobil</strong>’s diverse operations<br />
in Asia Pacific contributed about<br />
12 percent of <strong>2004</strong> Upstream<br />
earnings. Production operations<br />
are located in Malaysia, Australia,<br />
Indonesia, Thailand, Japan, and<br />
Papua New Guinea.<br />
<strong>ExxonMobil</strong> is the largest oil producer in Malaysia, with<br />
39 operated platforms in 17 fields, and net production<br />
of over 90 thousand barrels of liquids per day and 510 million<br />
cubic feet of gas per day in <strong>2004</strong>. The Guntong Hub Project<br />
(<strong>ExxonMobil</strong> interest, 50 percent), scheduled for start-up<br />
in 2006, is expected to have peak production of<br />
715 million cubic feet of gas plus associated liquids<br />
per day (gross). Further development is expected to span<br />
the next 15 years.<br />
<strong>2004</strong> net production in Australia totaled about 90 thousand<br />
barrels of oil and 400 million cubic feet of gas per day<br />
primarily from our offshore producing facilities in the<br />
Bass Strait. Efforts to develop the large gas resources<br />
off the Northwest Shelf continue. Development of the<br />
Greater Gorgon/Jansz area (<strong>ExxonMobil</strong> interest subject<br />
to final agreement) is expected to provide 10 million tons<br />
per year (gross) of LNG from two trains, targeted<br />
primarily to markets in Asia Pacific, beginning in 2009.<br />
In <strong>2004</strong>, the partners in the PNG Gas Project (<strong>ExxonMobil</strong><br />
interest, 26 percent) in Papua New Guinea approved a plan<br />
to move to front-end engineering and design. Gas sales<br />
negotiations in support of project development are ongoing.<br />
EXXON MOBIL CORPORATION • <strong>2004</strong> SUMMARY ANNUAL REPORT
DOWNSTREAM<br />
Our award-winning On the Run<br />
convenience stores, such as this site<br />
in Italy, offer quality products and<br />
incorporate leading-edge technology to<br />
provide the best experience for<br />
customers on the move.
Operating and capital discipline positions <strong>ExxonMobil</strong>’s<br />
Downstream as an industry leader, capable of outperforming<br />
the competition under a variety of market conditions.<br />
Refining and Supply, Fuels Marketing, and Lubricants and Specialties<br />
<strong>2004</strong> RESULTS AND HIGHLIGHTS<br />
Continued leadership in safety, reliability, scale, and<br />
technology helped contribute to our best-ever financial<br />
and operating results.<br />
Earnings increased 62 percent to $5.7 billion versus 2003.<br />
More than $1.7 billion of pretax cost efficiencies and<br />
revenue enhancements were achieved. We have delivered<br />
an average of $1.4 billion in pretax savings per year since<br />
2000 through improvements that leverage our industryleading<br />
proprietary technology, scale, and global<br />
functional organization.<br />
Downstream capital expenditures were $2.4 billion in <strong>2004</strong>,<br />
down 14 percent versus 2003, reflecting the completion of<br />
many low-sulfur fuel projects.<br />
Downstream return on average capital employed was<br />
21 percent, up from 13 percent in 2003, aided by stronger<br />
industry margins and ongoing “self-help” improvements.<br />
Refinery throughput, at 5.7 million barrels per day,<br />
was up 4 percent versus 2003, with improved unit<br />
reliability that captured stronger industry margins.<br />
Petroleum product sales were up 3 percent in <strong>2004</strong>,<br />
largely due to stronger industry demand and higher<br />
refinery throughput.<br />
D OWNSTREAM RETURN<br />
ON AVERAGE CAPITAL EMPLOYED<br />
<strong>ExxonMobil</strong> Integrated Oil Competitor Average<br />
(percent)<br />
(1)<br />
2000 2001 2002 2003 <strong>2004</strong><br />
STATISTICAL RECAP <strong>2004</strong> 2003 2002 2001 2000<br />
Earnings (millions of dollars) 5,706 3,516 1,300 4,227 3,418<br />
Refinery throughput (thousands of barrels per day) 5,713 5,510 5,443 5,542 5,642<br />
Petroleum product sales (thousands of barrels per day) 8,210 7,957 7,757 7,971 7,993<br />
Average capital employed (millions of dollars) 27,173 26,965 26,045 26,321 27,732<br />
Return on average capital employed (percent) 21.0 13.0 5.0 16.1 12.3<br />
Capital expenditures (millions of dollars) 2,405 2,781 2,450 2,322 2,618<br />
24<br />
20<br />
16<br />
12<br />
8<br />
4<br />
0<br />
(1) Royal Dutch Shell, BP, and ChevronTexaco values calculated on a consistent basis<br />
with <strong>ExxonMobil</strong>, based on public information. Competitor data estimated for <strong>2004</strong>.<br />
S TRONG D OWNSTREAM EARNINGS CONTRIBUTIONS<br />
(billions of dollars)<br />
7<br />
6<br />
5<br />
4<br />
3<br />
2<br />
1<br />
0<br />
2000 2001 2002 2003 <strong>2004</strong><br />
EXXON MOBIL CORPORATION • <strong>2004</strong> SUMMARY ANNUAL REPORT<br />
19
20<br />
Our Downstream Business<br />
<strong>ExxonMobil</strong> has refining operations in 25 countries,<br />
over 37,000 retail sites in more than 100 countries, and<br />
lubricants marketing in about 200 countries and territories.<br />
We have created sustainable competitive advantages<br />
that enable us to execute a broad array of “self-help”<br />
measures that generate attractive returns and create<br />
value for our shareholders.<br />
<strong>ExxonMobil</strong> utilizes its world-class<br />
scale, along with industry-leading<br />
integration, efficiency, and technology<br />
to maximize shareholder value.<br />
Refining margins were robust in <strong>2004</strong>, although marketing<br />
margins were lower than in 2003. The downstream industry<br />
continues to experience significant margin volatility and<br />
remains intensely competitive. We expect modest industry<br />
growth in mature markets, continued inflationary cost<br />
EXXON MOBIL CORPORATION • <strong>2004</strong> SUMMARY ANNUAL REPORT<br />
OUR DOWNSTREAM STRATEGIES<br />
Our financial objectives in the Downstream can be summarized<br />
into three broad areas: margin enhancement, cost<br />
efficiency, and capital discipline. Delivering on these objectives<br />
enables us to create value for shareholders through<br />
industry-leading return on average capital employed. The<br />
key strategies we pursue to meet these objectives are:<br />
■ Maintain best-in-class operations in all respects;<br />
■ Provide quality, valued products and services<br />
to our customers;<br />
■ Lead industry in efficiency and effectiveness;<br />
■ Capitalize on integration with other<br />
<strong>ExxonMobil</strong> businesses;<br />
■ Selectively invest for resilient, advantaged returns; and,<br />
■ Maximize value from leading-edge technology.<br />
pressure, and ongoing investments to meet regulatory<br />
requirements. In this environment, <strong>ExxonMobil</strong> Downstream<br />
is focused on actions that enhance margin, improve<br />
reliability, increase asset utilization, and reduce costs.<br />
<strong>ExxonMobil</strong> has more conversion capacity than any refiner in the world. Facilities like this delayed coker at our Baytown, Texas, refinery<br />
convert heavy, lower-cost crudes into high-value products.
OUR REFINING AND SUPPLY BUSINESS<br />
<strong>ExxonMobil</strong>’s Refining and Supply business provides quality<br />
products and feedstocks to customers around the world.<br />
We manufacture clean fuels, lubes, and other high-value<br />
products utilizing a highly efficient asset base. Our global<br />
supply organization optimizes supplies of crude and feedstock<br />
to our refineries and places our equity crude production in<br />
its highest-value disposition. As a result, we process about<br />
one-half of our equity crude and purchase nearly 5 million<br />
barrels per day of crude oil and feedstocks to maximize value<br />
from our refining assets. Timely application of technological<br />
advances continues to improve our operations.<br />
Largest Global Refiner<br />
Refinery interests . . . . . . . . . . . . . . . . . . . . . . . . . . . . . . . . . . . . . . . . 45<br />
Distillation capacity (barrels per day) . . . . . . . . . . . . . . . . 6.4 million<br />
Lube basestock capacity (barrels per day) . . . . . . . 145 thousand<br />
Crude oil and product tanker interests (>1kDWT). . . . . . . . . . . . 32<br />
Major petroleum products terminals . . . . . . . . . . . . . . . . . . . . . . 282<br />
Different qualities of crude feedstocks can produce very<br />
different product slates, depending on the type of refinery.<br />
The cost differences between crude grades can vary<br />
significantly, as they did in <strong>2004</strong>. This environment presents<br />
a tremendous opportunity for refiners that are configured<br />
to capture the benefits.<br />
We have made prudent investments over time to install the<br />
right configuration where it counts. Our ability to convert<br />
lower-cost crudes into a higher yield of high-value products<br />
and chemical feedstocks maximizes our refining margin.<br />
With disciplined investment and industry-leading global<br />
scale, we generate better returns than our competition.<br />
Leveraging Global Scale and Integration<br />
Our global diversity, scale, and integration provide<br />
competitive advantages that increase returns and allow<br />
us to prudently manage risk. Overall, our refineries are<br />
70 percent larger than the industry average, which enables<br />
us to reduce unit costs below the industry average.<br />
Integration at many locations with our petrochemical<br />
facilities, combined with our proprietary technology<br />
advantage, enables us to optimize production to the<br />
highest-value outlet on a daily basis.<br />
Increasing Reliability<br />
One of the most straightforward ways to improve profitability<br />
is to increase refinery utilization and raise the overall yield of<br />
higher-value products. In <strong>2004</strong>, we reduced unplanned<br />
D OWNSTREAM 21<br />
An engineer prepares for start-up of <strong>ExxonMobil</strong>’s conversion project<br />
at Port Jerome-Gravenchon, France, which increased the yield of<br />
lower-sulfur motor fuels and high-value chemical feedstocks.<br />
capacity loss by over 20 percent versus 2003, driven by<br />
improvements from the disciplined application of our Reliability<br />
and Maintenance Management System. Since its introduction,<br />
we have reduced maintenance costs by 30 percent.<br />
Delivering Efficiencies<br />
Energy and work force costs comprise two-thirds of total<br />
refining cash costs. A disciplined effort to reduce costs in<br />
these areas delivers results that flow directly to the bottom<br />
line. Since its inception in 1999, our proprietary Global<br />
Energy Management System (GEMS) has enabled us to<br />
identify more than $1 billion in pretax energy savings. Also,<br />
since 1998, Refining and Supply staffing has been reduced<br />
by 25 percent, driven mainly by work force efficiencies.<br />
Growing Selectively<br />
World-class scale and integration, industry-leading efficiency,<br />
leading-edge technology, and globally respected brands<br />
enable <strong>ExxonMobil</strong> to take advantage of attractive emerging<br />
growth opportunities. In <strong>2004</strong>, we signed an agreement<br />
with Sinopec, Saudi Aramco, and Fujian Petrochemical to<br />
progress the design of the first fully integrated Sino-foreign<br />
petroleum and petrochemical project in China.<br />
We also continue to pursue low-cost ways to incrementally<br />
add capacity in our existing facilities. Historically, we have<br />
added 1 to 2 percent per year to our refining capacity –<br />
the equivalent of building a new grassroots refinery every<br />
three years.<br />
EXXON MOBIL CORPORATION • <strong>2004</strong> SUMMARY ANNUAL REPORT
22<br />
OUR FUELS MARKETING BUSINESS<br />
<strong>ExxonMobil</strong> Fuels Marketing helps make life easier<br />
for customers on the move in more than 100 countries<br />
across the globe, creating value with high-quality and<br />
convenient products and services under our three<br />
strong brands: Exxon, Mobil, and Esso. Our business<br />
portfolio leverages globally common, consistently applied<br />
processes, marketing programs, and best practices<br />
to enhance worldwide business performance. The global<br />
Fuels Marketing business includes our retail chain,<br />
industrial and wholesale, aviation, and marine operations.<br />
Diverse Customer Base Provides Global Outlet<br />
Operations . . . . . . . . . . . . . . . . . 100 countries on six continents<br />
Service stations . . . . . . . . . . . . . . . . . . . . . . . . . . . . 37 thousand<br />
Industrial and wholesale customers . . . . . . . . . . . . . . . . 1 million<br />
Aviation operations . . . . . . . . . . . . . . . . . . . . . . . . . . 600 airports<br />
Marine operations. . . . . . . . . . . . . . . . . . . . . . . . . . . . . 300 ports<br />
In <strong>2004</strong>, we continued to improve the underlying structure<br />
of our business through relentless focus on execution in<br />
the areas of safety, cost efficiency, nonfuels income growth,<br />
and retail chain portfolio management.<br />
Best-in-Class Operations Applied Across the Chain<br />
We continuously search for new ways to lower costs<br />
and to increase productivity. We leverage our global scale<br />
to capture operating efficiencies and improve earnings<br />
Our product offerings and marketing programs are designed<br />
to appeal to the needs of customers like these, visiting an<br />
On the Run in New Zealand.<br />
EXXON MOBIL CORPORATION • <strong>2004</strong> SUMMARY ANNUAL REPORT<br />
The Exxon, Mobil, and Esso brands<br />
are respected worldwide for providing<br />
high-quality products, combined with<br />
innovative enhancements that add<br />
value for our customers.<br />
by applying best practices and common systems<br />
through our worldwide functional organization.<br />
In <strong>2004</strong>, our efforts reduced pretax costs by over<br />
$200 million.<br />
In retail, effective category management, car wash<br />
facilities, and strategic alliances with leading food and<br />
grocery marketers increased nonfuels income. The<br />
cumulative benefit of our cost efficiencies and nonfuels<br />
income growth initiatives results in a reduction in<br />
the fuels margin we require to break even. In the<br />
United States, for example, we have reduced this<br />
margin by 15 percent since 2000.<br />
Nonfuels Income Initiatives Drive Margin Enhancement<br />
Our portfolio of retail formats and service offerings is<br />
tailored to meet our customers’ needs. Award-winning<br />
On the Run convenience stores reflect extensive market<br />
research and incorporate leading-edge technology.<br />
In <strong>2004</strong>, we added nearly 300 On the Run convenience<br />
stores worldwide, providing our customers with a fast,<br />
fresh, and friendly experience in over 40 countries<br />
and territories.<br />
In <strong>2004</strong>, we expanded our strategic alliances to over<br />
700 sites around the world. Strategic alliances in selected<br />
markets enhance our offering by leveraging the strength<br />
of a partner’s brand or distribution system. Examples<br />
include our alliances with Tesco in the United Kingdom<br />
and Thailand, Doutor and 7-Eleven in Japan, Tim Hortons<br />
in Canada, and Innscor across Africa.<br />
Marketing programs such as our unique Speedpass<br />
payment system and our participation in the Upromise<br />
program in the United States build customer loyalty.<br />
More than 7 million customers now enjoy the<br />
convenience of paying by Speedpass at over<br />
10,000 sites in the United States, Canada, Japan,<br />
and Singapore.
Above – Allessandro Besa and Davide Ballatori inspect the Gasoil Hydrofiner Unit, which produces ultralow-sulfur diesel, at the Trecate refinery in Italy.<br />
Below – Nearly 1,300 On the Run convenience stores can be found in over 40 countries and territories around the globe.
24<br />
<strong>ExxonMobil</strong> Aviation supplies aviation fuel at more than 600<br />
airports worldwide, delivered through an extensive distribution<br />
network that is monitored for efficiency and quality control<br />
from start to finish.<br />
Discipline Improves Capital Efficiency<br />
We maintain a productive asset base by utilizing a disciplined<br />
strategy to manage capital resources. Using our focused<br />
market approach, we select and prioritize potential markets<br />
through a comprehensive planning process. For each market,<br />
we assess customer preferences, develop detailed market<br />
models, and produce a resilient network plan. In markets<br />
where we have implemented this approach, our resulting retail<br />
chain is significantly more efficient and higher performing.<br />
Market effectiveness, which is the ratio of the percentage<br />
of volume sold to the percentage of industry retail sites in a<br />
given market, is a common measure of asset performance<br />
in the retail business. Our market effectiveness is 50 percent<br />
better than industry in markets where we have seen the full<br />
benefits of a focused market approach, indicating the<br />
success of our retail chain highgrading efforts.<br />
Mobil 1, the official motor oil of NASCAR, is the leading<br />
full-synthetic motor oil in the world.<br />
EXXON MOBIL CORPORATION • <strong>2004</strong> SUMMARY ANNUAL REPORT<br />
OUR LUBRICANTS AND SPECIALTIES BUSINESS<br />
<strong>ExxonMobil</strong> is the world’s largest supplier of lube basestocks<br />
and a leading marketer of finished lubricants and specialty<br />
products. Leveraging three strong global brands, Mobil,<br />
Exxon, and Esso, along with the world’s leading full-synthetic<br />
motor oil, Mobil 1, we are trusted by customers to deliver<br />
technically superior products in a global market. A dedicated<br />
organization and a strong distributor network supply highquality<br />
lubricants and our application expertise to customers<br />
around the world.<br />
Global Lubes Leadership Position<br />
Lube basestock refineries . . . . . . . . . . . . . . . . . . . . . . . . . . . . . . . . 12<br />
Average capacity per site. . . . . . . . . . . . . . . . . . . . . 2 times industry<br />
Blend plants . . . . . . . . . . . . . . . . . . . . . . . . . . . . . . . . . . . . . . . . . . . . 58<br />
Lube basestock market share . . . . . . . . . . . . . . . . . . . . . 18 percent<br />
Finished lubricant market share . . . . . . . . . . . . . . . . . . . . 13 percent<br />
Strategic sponsorships and alliances with<br />
high-performing motorsports teams and<br />
leading original-equipment manufacturers<br />
are a powerful endorsement of <strong>ExxonMobil</strong>’s<br />
superiority in finished lubes.<br />
A successful, industry-leading lubricant business should<br />
have global scale, a well-respected finished lubricant brand,<br />
a strong premium product line, leading-edge technology,<br />
and an efficient and effective supply chain.<br />
<strong>ExxonMobil</strong> has all of these. We produce high-quality<br />
basestocks and lubricants through our interests in 12 lube<br />
refineries and 58 blend plants around the world. We have<br />
three brands recognized for quality products and services,<br />
and we deliver them efficiently to customers around the<br />
world. In total, we supply twice the volume of the next<br />
largest competitor.<br />
We have implemented sophisticated supply-chain planning<br />
tools and simplified our system by consolidating blend plants<br />
and reducing product formulations. This contributed to a<br />
reduction in overall cost to serve customers by 5 percent<br />
in <strong>2004</strong> – a result that flowed directly to the bottom line.
Solid brand recognition is a strength of our lubes business.<br />
<strong>ExxonMobil</strong> is the leading international lubes marketer in the<br />
fast growing Chinese market.<br />
Leveraging Our Brand and Technology<br />
Customers rely on high-quality Mobil, Exxon, and Esso<br />
branded finished lubricants to serve their automotive,<br />
industrial, commercial, aviation, and marine needs. Each<br />
application is supported by tailored marketing programs and<br />
an experienced sales force. Our global approach enables<br />
<strong>ExxonMobil</strong> to deliver consistent global brand messages –<br />
Mobil for the customer who requires high performance, and<br />
Exxon or Esso for customers who value quality and reliability.<br />
Motorsports sponsorships like those with the West McLaren<br />
Mercedes and Toyota teams, plus strategic alliances with<br />
leading original-equipment manufacturers like Caterpillar, are<br />
a powerful endorsement of the technological superiority of<br />
our branded finished lubes. In passenger car lubricants,<br />
technological advancements enabled the introduction of a<br />
new line of Mobil lubricants in the United States that offers<br />
extended engine protection. In basestocks, our proprietary<br />
D OWNSTREAM 25<br />
GROWING FLAGSHIP AND PREMIUM PRODUCTS<br />
As the world’s economies grow, so does the demand<br />
for higher-quality lubricants. <strong>ExxonMobil</strong> continues to<br />
grow market share in this most profitable part of the<br />
finished lubes business.<br />
■ Mobil 1 is the endorsed, recommended, and/or<br />
approved engine oil for more than 50 percent of new<br />
luxury vehicles in the North American market. No other<br />
motor oil holds as many engine specification approvals.<br />
■ The growing list of automotive manufacturers<br />
recommending Mobil 1 for their high-performance<br />
vehicles include the makers of Aston Martin, Bentley,<br />
BMW, Cadillac, Corvette, Chrysler, Dodge, Mercedes<br />
Benz, Porsche, and Saab.<br />
■ In 2005, we introduced new higher mileage, extended<br />
performance Mobil 1 and Mobil product lines in the<br />
United States that will further differentiate these<br />
premium brands.<br />
catalysis research has produced the MSDW-2 catalyst,<br />
which is used in the industry’s leading technology for<br />
making high-quality lube basestocks at lower cost.<br />
Profitable Growth in Emerging Markets<br />
Developing nations, with increasing demand for both<br />
industrial and automotive lubricants, present growth<br />
opportunities for <strong>ExxonMobil</strong> lubricants and specialties.<br />
In Eastern Europe, Russia, and China, sales have grown<br />
at double-digit rates for several consecutive years.<br />
In countries like China, we have leveraged our<br />
well-recognized brands, strong equipment manufacturer<br />
relationships, and technical expertise to develop a leading<br />
market position among foreign marketers. China is now<br />
our fourth largest market for finished lubricants.<br />
Outstanding global brands, proprietary technology, and<br />
a low-cost, efficient supply chain help position us for<br />
continued growth and success in new markets.<br />
EXXON MOBIL CORPORATION • <strong>2004</strong> SUMMARY ANNUAL REPORT
CHEMICAL<br />
Globally advantaged chemical<br />
complexes such as our integrated<br />
Singapore facility are well-positioned<br />
to supply growth in Asia.
Technology differentiates <strong>ExxonMobil</strong> Chemical.<br />
Concentration on our core competencies, as well as selective<br />
investment, produces growth and results that set us apart.<br />
Chemical<br />
<strong>2004</strong> RESULTS AND HIGHLIGHTS<br />
<strong>2004</strong> earnings of $3.4 billion set a record – more than<br />
double those in 2003. Our unique mix of businesses,<br />
broad geographic coverage, and feedstock and integration<br />
advantages ideally positioned <strong>ExxonMobil</strong> to capitalize on<br />
an improved industry environment.<br />
Chemical return on average capital employed reached<br />
23 percent, up from 10 percent in 2003. <strong>ExxonMobil</strong>’s<br />
Chemical returns exceeded the average returns of our major<br />
chemical competitors. Over the last 10 years, our Chemical<br />
segment achieved an average return of 14 percent. During<br />
the same period, we estimate our competitors’ average<br />
return to have been 8 percent.<br />
<strong>2004</strong> prime product sales volume of 27.8 million tons<br />
was a record – 5 percent higher than in 2003. Growth in all<br />
regions was achieved by higher utilization of existing assets,<br />
supported by strong reliability and global supply optimization.<br />
Capital expenditures were $0.7 billion. The Company<br />
continued to invest selectively in high-return efficiency<br />
projects, low-cost debottlenecks, and projects to support<br />
the growth of our specialty businesses.<br />
Capacity is more than 40 percent higher than the<br />
last chemical cycle peak in 1995. Recent advantagedcapacity<br />
additions in Saudi Arabia and Singapore are<br />
contributing significantly to earnings growth. We are<br />
particularly well-positioned to continue to meet growing<br />
demand in Asia, which has been led by an expanding<br />
Chinese economy.<br />
C HEMICAL OUTPERFORMED COMPETITION<br />
A CROSS THE BUSINESS CYCLE<br />
Return on Average Capital Employed<br />
<strong>ExxonMobil</strong><br />
(percent)<br />
Major Chemical Competitors (1)<br />
STATISTICAL RECAP <strong>2004</strong> 2003 2002 2001 2000<br />
Earnings (1) (millions of dollars) 3,428 1,432 830 882 1,161<br />
Prime product sales (2) (thousands of metric tons) 27,788 26,567 26,606 25,780 25,637<br />
Average capital employed (millions of dollars) 14,608 14,099 13,645 13,839 13,814<br />
Return on average capital employed (percent) 23.5 10.2 6.1 6.4 8.4<br />
Capital expenditures (millions of dollars) 690 692 954 872 1,468<br />
(1) Earnings included a $175 million extraordinary gain on asset divestitures in 2001.<br />
(2) Prime product sales include <strong>ExxonMobil</strong>’s share of equity-company volumes and finished-product transfers to the Downstream. Carbon-black oil volumes are excluded.<br />
35<br />
30<br />
25<br />
20<br />
15<br />
10<br />
5<br />
0<br />
1995<br />
1996<br />
1997<br />
1998<br />
1999<br />
2000<br />
2001<br />
2002<br />
2003<br />
<strong>2004</strong><br />
(1) Chemical competitor values calculated on a consistent basis with <strong>ExxonMobil</strong>,<br />
based on public information. Competitor information estimated for <strong>2004</strong>.<br />
B USINESS MIX ENHANCES PROFITABILITY<br />
Segment Earnings<br />
Specialties Commodities<br />
(billions of dollars)<br />
3.5<br />
3.0<br />
2.5<br />
2.0<br />
1.5<br />
1.0<br />
0.5<br />
0<br />
1995<br />
1996<br />
1997<br />
1998<br />
1999<br />
2000<br />
2001<br />
2002<br />
2003<br />
<strong>2004</strong><br />
EXXON MOBIL CORPORATION • <strong>2004</strong> SUMMARY ANNUAL REPORT<br />
27
28<br />
Our Chemical Business<br />
<strong>ExxonMobil</strong>’s unique mix of chemical business lines delivers<br />
superior performance relative to the competition throughout<br />
the business cycle. The Company holds strong positions<br />
in many of the largest-volume and highest-growth petrochemicals.<br />
In fact, over 90 percent of our chemical capacity<br />
is employed in businesses where we rank first or second<br />
in market share by worldwide volume.<br />
Premier Petrochemical Company<br />
Return on average capital employed (10-year) . . . . . . 14 percent<br />
Businesses ranked 1 or 2 by market share . . . . . . . >90 percent<br />
Capital employed (at year end) . . . . . . . . . . . . . . . . . . $15 billion<br />
Prime product sales (tons) . . . . . . . . . . . . . . . . . . . . . . 28 million<br />
Percent integrated capacity . . . . . . . . . . . . . . . . . . . >90 percent<br />
Product marketing diversity . . . . . . . . . . . . . . . . . >150 countries<br />
Our high-volume commodity chemical portfolio, a growth<br />
driver in times when the global economy is expanding,<br />
provided strong earnings in <strong>2004</strong>. We are one of the largest<br />
producers of olefins, a basic petrochemical building block<br />
that is used as a raw material in a variety of consumer<br />
applications including packaging, automotive parts, and<br />
household goods. We are the largest producer of polyolefins,<br />
which include polyethylene, the largest-volume plastic; and<br />
polypropylene, one of the fastest growing polymers.<br />
OUR CHEMICAL STRATEGIES<br />
We derive strong competitive advantages from our<br />
unique combination of low-cost feedstocks, proprietary<br />
technology, lower costs through operational excellence,<br />
product application expertise, and integration synergies.<br />
Our competitors, both chemical companies and other<br />
major oil companies, may benefit from one or more of<br />
these attributes. But none of the competition has been<br />
able to replicate the advantage we gain from the<br />
combination of the parts.<br />
Our strategies capitalize on these advantages and are<br />
highlighted below:<br />
■ Focus on businesses that capitalize on<br />
core competencies;<br />
■ Capture full benefits of integration across all<br />
<strong>ExxonMobil</strong> operations;<br />
■ Continuously reduce costs to achieve<br />
best-in-class performance;<br />
■ Build proprietary technology positions; and,<br />
■ Invest selectively in globally advantaged projects.<br />
EXXON MOBIL CORPORATION • <strong>2004</strong> SUMMARY ANNUAL REPORT<br />
<strong>ExxonMobil</strong> Chemical leads the industry<br />
with innovative applications of complex<br />
catalyst technologies and process<br />
integrations that drive more efficient<br />
production and stronger margins for<br />
our diverse slate of products.<br />
Profitability continued to improve in our aromatics business<br />
in <strong>2004</strong> where industry demand grew by 6 percent. We are<br />
the largest producer of paraxylene, the main raw material in<br />
polyester fibers and polyethylene terephthalate (PET)<br />
recyclable bottles; and benzene, a primary component in a<br />
broad array of products ranging from nylon to polystyrene.<br />
In addition to being a leading supplier of primary<br />
petrochemical products, we also have a premier position<br />
in highly profitable specialty chemicals. Earnings for these<br />
products are less volatile than commodity petrochemicals<br />
and, over the business cycle, provide a significant return<br />
uplift to the entire portfolio. <strong>ExxonMobil</strong> continues to grow<br />
and strengthen these businesses through new product<br />
development and expansion into new markets.<br />
We manufacture our products in 55 wholly owned and<br />
joint-venture facilities around the world. Our sites are<br />
located to benefit from low-cost raw materials and to<br />
optimize supply into the major demand centers.<br />
Key Products Meet Diverse Consumer Needs<br />
■ Commodities ● Specialties<br />
Products ➤ Markets<br />
Polyolefins<br />
Food packaging<br />
Films<br />
Synthetics<br />
Elastomers<br />
Olefins Plasticizer/Oxo<br />
Aromatics<br />
Specialty Fluids<br />
Butyl Rubber<br />
Adhesive Polymers<br />
Solvents<br />
Storage containers<br />
Synthetic fibers<br />
Automotive parts<br />
Lubricants<br />
Inks<br />
Tires<br />
Adhesives<br />
Soda bottles<br />
Diapers<br />
Pesticides
C HEMICAL 29<br />
Above – Integration at many sites, including our Baton Rouge refinery and chemical complex, enables us to optimize production to the highest-value outlet.<br />
Below – We manufacture adhesive polymers – used to make tape, labels, and other adhesive products – in North America, Europe, Japan, and China.
30<br />
Across the breadth of products<br />
<strong>ExxonMobil</strong> Chemical delivers to<br />
customers around the world, each<br />
takes advantage of industry-leading<br />
research aimed at enhancing both<br />
product performance and profitability.<br />
Capturing the Benefits of Integration<br />
More than 90 percent of our owned and operated chemical<br />
capacity is adjacent to and integrated with our large refining<br />
complexes or gas processing plants. At these facilities, more<br />
than 60 products are transferred between the refinery and<br />
the chemical plant. We use this integrated flexibility and the<br />
latest modeling technology to tailor our feedstock sourcing<br />
and products to the mix that maximizes margins and shareholder<br />
value in response to changing market conditions.<br />
Our manufacturing sites are designed and built to maximize<br />
synergies. We save costs through coordinated technology<br />
development, joint facilities planning and maintenance, and<br />
common shared systems and support functions.<br />
The flexibility that comes with feedstock and fuels<br />
integration is a unique competitive advantage in our industry.<br />
The physical co-location of our world-scale refineries and<br />
chemical plants is not easy to replicate.<br />
Focused Where We Are Among the Best<br />
Worldwide Rank<br />
Businesses Based on Market Share<br />
Commodities<br />
Paraxylene . . . . . . . . . . . . . . . . . . . . . . . . . . . . . . . . . . . . . . . . . . . #1<br />
Olefins . . . . . . . . . . . . . . . . . . . . . . . . . . . . . . . . . . . . . . . . . . . . . . #2<br />
Polyethylene . . . . . . . . . . . . . . . . . . . . . . . . . . . . . . . . . . . . . . . . . . #2<br />
Polypropylene. . . . . . . . . . . . . . . . . . . . . . . . . . . . . . . . . . . . . . . . . #4<br />
Specialties<br />
Butyl Polymers . . . . . . . . . . . . . . . . . . . . . . . . . . . . . . . . . . . . . . . . #1<br />
Fluids . . . . . . . . . . . . . . . . . . . . . . . . . . . . . . . . . . . . . . . . . . . . . . . #1<br />
Plasticizers / Oxo. . . . . . . . . . . . . . . . . . . . . . . . . . . . . . . . . . . . . . . #1<br />
Synthetics. . . . . . . . . . . . . . . . . . . . . . . . . . . . . . . . . . . . . . . . . . . . #1<br />
Oriented Polypropylene Films . . . . . . . . . . . . . . . . . . . . . . . . . . . . . #1<br />
Adhesive Polymers . . . . . . . . . . . . . . . . . . . . . . . . . . . . . . . . . . . . . #1<br />
Petroleum Additives . . . . . . . . . . . . . . . . . . . . . . . . . . . . . . . . . . . . #2<br />
Ethylene Elastomers . . . . . . . . . . . . . . . . . . . . . . . . . . . . . . . . . . . . #2<br />
EXXON MOBIL CORPORATION • <strong>2004</strong> SUMMARY ANNUAL REPORT<br />
Reducing Costs to Best-in-Class<br />
The Company’s demonstrated strength of focusing on<br />
safety, productivity, reliability, and quality increases the contribution<br />
of existing assets. These efforts reduced unit costs by<br />
4 percent in <strong>2004</strong>, as we continued to capture efficiencies.<br />
We focus continually on improving efficiency and reducing<br />
the costs of manufacturing, sales, and distribution.<br />
Work force productivity, a key underlying component,<br />
has improved 15 percent since 2001.<br />
Selective Investing for Further Growth<br />
Investment discipline is a cornerstone of <strong>ExxonMobil</strong><br />
Chemical’s strategy. We seek investment opportunities<br />
that offer distinct competitive advantages that will enhance<br />
returns above those generally available to industry.<br />
In <strong>2004</strong>, the Company continued to focus on selective<br />
growth in high-return specialty businesses and on low-cost<br />
debottlenecks of existing capacity.<br />
For example, we started up the Baton Rouge metallocene<br />
ethylene elastomer plant in early <strong>2004</strong>. This one-of-a-kind,<br />
90,000-ton-per-year facility capitalizes on the flexibility of<br />
<strong>ExxonMobil</strong>’s patented Exxpol metallocene catalysts and our<br />
proprietary manufacturing process to make next-generation<br />
elastomers for use in a broad array of products.<br />
The Singapore steam cracker started up in 2001. Its capacity<br />
is being expanded by 75,000 tons per year to more than<br />
900,000 thousand tons per year.
We commenced debottlenecking our world-scale<br />
steam crackers in Singapore and Saudi Arabia in <strong>2004</strong>.<br />
Other debottlenecking projects are scheduled for 2005,<br />
which typically add capacity at half the cost of new<br />
greenfield plants.<br />
Planning is progressing on four major projects that will provide<br />
advantaged growth opportunities toward the end of this decade.<br />
■ In China, development continues on the integrated Fujian<br />
project, including the construction of an 800,000-ton-peryear<br />
ethylene steam cracker, polyethylene and polypropylene<br />
units, and a 700,000-ton-per-year paraxylene unit.<br />
■ A feasibility study for a second steam-cracking train in<br />
Singapore is being progressed. The Singapore Chemical<br />
Plant, <strong>ExxonMobil</strong> Chemical’s single largest investment in<br />
the world, started up in 2001. The additional world-scale<br />
train would be integrated with the existing complex.<br />
■ In Qatar, a joint feasibility study with Qatar Petroleum has<br />
begun for a steam cracker and derivatives complex that<br />
is expected to utilize ethane feedstock from new gas development<br />
projects from the 900-trillion-cubic-foot North Field.<br />
It will competitively supply products to high-growth areas<br />
in Asia.<br />
■ <strong>ExxonMobil</strong> and Pequiven SA are jointly progressing a petrochemical<br />
project in Venezuela that would include a steam<br />
cracker and derivatives units fed with advantaged ethane.<br />
<strong>ExxonMobil</strong> Chemical invests<br />
in globally competitive projects<br />
that offer distinctive competitive<br />
advantages.<br />
C HEMICAL 31<br />
The combination of world-scale manufacturing plants, proprietary catalysts, and product application knowledge is a source of competitive<br />
advantage for <strong>ExxonMobil</strong>’s polypropylene business.<br />
Van Parker, process engineer, takes a sample from the Xylene<br />
Recovery Unit in Baton Rouge, Louisiana.<br />
EXXON MOBIL CORPORATION • <strong>2004</strong> SUMMARY ANNUAL REPORT
32<br />
CITIZENSHIP<br />
Corporate Citizenship<br />
At <strong>ExxonMobil</strong>, corporate citizenship means meeting energy demand in an economically,<br />
environmentally, and socially responsible manner.<br />
<strong>2004</strong> HIGHLIGHTS<br />
“Nobody Gets Hurt.” In <strong>2004</strong>, fatalities, lost-time injuries,<br />
and total reportable injuries for both employees and<br />
contractors were at record low levels. Improved performance<br />
has resulted in a ten-fold reduction in lost-time incidents in<br />
the last decade.<br />
Record energy efficiency achieved at refinery and chemical<br />
facilities, reducing greenhouse gas emissions.<br />
$84 billion in tax payments to support local, state, and<br />
national governments.<br />
$106 million in charitable contributions and community<br />
development investments.<br />
Our approach to corporate citizenship, along with our<br />
guidelines for ensuring understanding and adherence, is<br />
outlined in the <strong>ExxonMobil</strong> Standards of Business Conduct,<br />
and has been in existence for more than 30 years. These<br />
standards form the framework by which we operate<br />
around the globe – providing each of our employees with<br />
principles for managing day-to-day compliance with<br />
company standards.<br />
EXXON MOBIL CORPORATION • <strong>2004</strong> SUMMARY ANNUAL REPORT<br />
PROMOTING SECURITY AWARENESS<br />
To protect our people, assets, information, and<br />
reputation, Exxon Mobil Corporation’s Global Security<br />
Department is spearheading a program to promote the<br />
security awareness of all Company personnel with the<br />
message that “Security Is Everybody’s Business.”<br />
Today’s environment demands vigilance by everyone.<br />
We are working to reinforce everyone’s important role<br />
in our collective security.<br />
ENVIRONMENTAL RESPONSIBILITY<br />
<strong>ExxonMobil</strong> is committed to environmental performance<br />
excellence. We are an industry leader dedicated to<br />
responsible operations everywhere we do business.<br />
Our goal continues to be to drive operational incidents<br />
with environmental impact to zero.<br />
We manage our environmental performance with the<br />
same rigor and discipline that underlie many of our other<br />
investments. One way we do this is through detailed<br />
Environmental Business Plans (EBPs) that integrate<br />
<strong>ExxonMobil</strong> constructed wetlands at<br />
the Baytown, Texas, refinery to provide<br />
a cost-effective and natural way to<br />
treat some refinery wastewater streams.<br />
Bacteria that occur naturally in these<br />
wetlands consume impurities in the<br />
wastewater. Charles Harrison and<br />
Nan Crowther review this new process<br />
to reduce nitrates in wastewater.
The Company’s Operations Integrity Management System (OIMS) requires ongoing evaluation and improvement of management systems<br />
and standards. Training on control of operations is one of the 11 key OIMS elements. All operations undergo regulatory compliance reviews<br />
as part of their OIMS requirements. Jan van Kampen and Marlou Bergboer inspect flow lines at one of 29 production locations in the<br />
Groningen gas field in the Netherlands.<br />
We believe an organization that has a<br />
disciplined approach to safety carries that<br />
discipline into all aspects of its operations.<br />
environmental improvement activities into annual operating<br />
objectives at each of our facilities. Our Operations Integrity<br />
Management System (OIMS) continues to be an effective<br />
framework for driving improvements in environmental<br />
performance.<br />
In <strong>2004</strong>, Lloyd’s Register Quality Assurance (LRQA)<br />
attested that <strong>ExxonMobil</strong> fulfills the intent of the ISO 14001<br />
Environmental Management Systems Standard through its<br />
Operations Integrity Management System.<br />
“Deployment of the Operations Integrity Management System<br />
(OIMS) has contributed toward an overall improvement<br />
in the Corporation’s environmental performance. At the<br />
locations visited, individuals at all levels demonstrated a high<br />
degree of personal commitment to OIMS implementation<br />
and environmental care. The integration of Environmental<br />
Business Plans into the annual planning cycle has<br />
strengthened the process for continual improvement of<br />
the Corporation’s environmental performance... We further<br />
believe <strong>ExxonMobil</strong> to be among the industry leaders in the<br />
extent to which environmental considerations have been<br />
integrated into its business processes for ongoing operations<br />
and for the planning and development of new projects.”<br />
Spills<br />
Since 1996, spills from company-operated marine vessels<br />
have decreased by 90 percent. Nevertheless, we are not<br />
satisfied. Lessons derived from any spill or near-miss are used<br />
to further improve our performance and reduce incidents<br />
throughout the world. Our experiences are also shared<br />
with those who provide chartered marine services to us.<br />
M ARINE SPILLS (OPERATED FLEET)<br />
Spills of More than a Barrel Spills of a Barrel or Less<br />
(number of incidents)<br />
25<br />
20<br />
15<br />
10<br />
5<br />
0<br />
1996 1997 1998 1999 2000 2001 2002 2003 <strong>2004</strong><br />
EXXON MOBIL CORPORATION • <strong>2004</strong> SUMMARY ANNUAL REPORT
34<br />
Energy Efficiency and Emissions Reduction<br />
As we have for many years, <strong>ExxonMobil</strong> continues to<br />
take significant actions to improve energy efficiency and<br />
reduce greenhouse gas (GHG) emissions. These actions<br />
are consistent with our strategy of using research and<br />
technology to innovate and improve our environmental<br />
performance.<br />
Our short-term actions include efforts to improve energy<br />
efficiency, reduce flaring, and increase cogeneration capacity.<br />
Our long-term actions are focused on developing advanced<br />
vehicle and fuels technologies to meet growing energy<br />
demand with reduced emissions.<br />
In <strong>2004</strong>, we achieved record performance in energy<br />
efficiency across our worldwide refining and chemical<br />
businesses, improving by over 3 percent versus 2003.<br />
Cogeneration, the simultaneous production of electricity<br />
and steam, is a key energy-saving practice. <strong>ExxonMobil</strong><br />
currently has interests in over 85 cogeneration facilities at<br />
over 30 locations worldwide. With production capacity of<br />
approximately 3,300 megawatts of electricity – enough to<br />
power 3 million U.S. homes – our cogeneration facilities,<br />
fueled primarily by clean-burning natural gas, have reduced<br />
emissions by 8 million tons per year.<br />
In <strong>2004</strong>, 400 megawatts of new cogeneration capacity<br />
was added at <strong>ExxonMobil</strong> facilities in the United States and<br />
Canada, and we expect to add an additional 400 megawatts<br />
in 2005. The total investment for both years is expected to<br />
be nearly $1 billion.<br />
We also continue to invest in environmental research and<br />
development through partnerships with universities, research<br />
centers, and other organizations. For example, <strong>ExxonMobil</strong><br />
is providing up to $100 million to Stanford University’s Global<br />
Climate and Energy Project (GCEP) – a major long-term<br />
research program designed to accelerate the development<br />
C OGENERATION CAPACITY<br />
(megawatts)<br />
4,000<br />
3,000<br />
2,000<br />
1,000<br />
0<br />
;;<br />
;;;<br />
;;;;<br />
;;;<br />
;;<br />
1970 1980 1990 2000 2005<br />
EXXON MOBIL CORPORATION • <strong>2004</strong> SUMMARY ANNUAL REPORT<br />
Khalid Ashraf and Richard Huntington review the installation<br />
of a cogeneration unit at our Beaumont, Texas, refinery.<br />
With the latest turbine technology, cogeneration is approximately<br />
twice as efficient as traditional methods of producing steam<br />
and purchasing power from the grid.<br />
of commercially viable technologies that can dramatically<br />
lower GHG emissions. Over the past year, GCEP launched<br />
new research targeting fundamental breakthroughs in<br />
technologies, including capture and storage of carbon<br />
dioxide, fuel cells, hydrogen fuels, and renewable energy.<br />
Further information about GCEP and current research<br />
projects is available at gcep.stanford.edu.<br />
In <strong>2004</strong>, <strong>ExxonMobil</strong> continued our partnerships with<br />
Toyota, a global leader in light-duty vehicle technology,<br />
and Caterpillar, a global leader in heavy-duty diesel<br />
technology, to develop advanced engine and fuel<br />
systems that can increase fuel efficiency and reduce<br />
emissions. <strong>ExxonMobil</strong> and Toyota engineers recently<br />
received an award from the Society of Automotive<br />
Engineers recognizing our work on how diesel fuel<br />
properties affect vehicle emissions.<br />
EMPLOYMENT PRACTICES<br />
We conduct business in about 200 countries and territories.<br />
Our work force is both culturally and geographically diverse.<br />
Our success as a business is rooted in the quality of our<br />
employees. Our objective is to hire the most qualified person<br />
available for each job. We are committed to providing a
<strong>ExxonMobil</strong> believes that one of the most<br />
important contributions we can make to a<br />
community is to support its economic growth.<br />
positive work environment that values the wide-ranging<br />
perspectives inherent in our diverse work force. Thus, it is<br />
essential that <strong>ExxonMobil</strong> workplaces be free of all forms<br />
of harassment and discrimination.<br />
<strong>ExxonMobil</strong> is committed to hiring employees from the<br />
communities in which we operate. As projects in areas<br />
such as West Africa, Asia, and Russia progress, we are<br />
implementing a proven strategy for work force nationalization.<br />
Increasing numbers of national employees are being<br />
trained and employed in operational and leadership roles<br />
both in their home country and around the world.<br />
HEALTH AND SAFETY RESPONSIBILITY<br />
In <strong>2004</strong>, we achieved an industry-leading safety and health<br />
record and earned significant global recognition. Lost-time<br />
injuries continue to be reduced by 10 to 15 percent annually.<br />
We learn from all safety incidents and use these learnings to<br />
reinforce our commitment to continued safety improvement.<br />
In addition to our safety efforts, we are committed to the<br />
security of our people, assets, and information. Our security<br />
measures take into account perceived risk, cost, effectiveness,<br />
applicable laws, and social norms. Our Operations<br />
Integrity Management System (OIMS) is our primary tool<br />
to identify, understand, and control risks across our diverse<br />
operations worldwide.<br />
R ECORD LOW LOST–T IME INJURIES AND ILLNESSES<br />
<strong>ExxonMobil</strong> Employees <strong>ExxonMobil</strong> Contractors<br />
U.S. Petroleum Industry Benchmark (1)<br />
(incidents per 200,000 work hours)<br />
0.8<br />
0.6<br />
0.4<br />
0.2<br />
0<br />
1994 1995 1996 1997 1998 1999 2000 2001 2002 2003 <strong>2004</strong><br />
(1) Employee safety data from participating API companies.<br />
C ORPORATE C ITIZENSHIP 35<br />
The OIMS process also allows us to continually improve<br />
and enhance our safety and health performance. For<br />
example, this year, following a comprehensive study of<br />
existing research and a review of current policies,<br />
<strong>ExxonMobil</strong> introduced corporate-wide requirements<br />
prohibiting the use of cellular phones while driving on<br />
company-related business.<br />
Global Health<br />
The world’s health pandemics, namely malaria and<br />
HIV/AIDS, are taking a staggering toll in death and debilitation<br />
in some of the communities where we operate, particularly<br />
in West Africa.<br />
Every year, there are at least 300 million acute malaria<br />
cases, resulting in more than a million deaths. Since 2000,<br />
<strong>ExxonMobil</strong> has given more than $10 million to fund<br />
health organizations and programs to fight malaria.<br />
Our Africa Health Initiative grants include programs to<br />
tackle malaria at the individual community level, to support<br />
the research and development of new medicines, and<br />
to advocate for global commitment and support in the<br />
fight against malaria.<br />
In <strong>2004</strong>, <strong>ExxonMobil</strong> developed a comprehensive African<br />
workplace program known as StopAIDS to help address<br />
HIV/AIDS where we live and work. By mid-2005, our<br />
employees in more than 20 African countries will be<br />
participating in the program. StopAIDS education covers<br />
areas such as understanding HIV/AIDS, assessing personal<br />
risk, protection, the role of counseling, and living positively<br />
with HIV/AIDS. <strong>ExxonMobil</strong> does not test for HIV, and<br />
HIV status itself is not a factor in deciding an employee’s<br />
ability to work.<br />
Women and children gather at Soyo Hospital in Angola to<br />
receive insecticide-treated bednets courtesy of <strong>ExxonMobil</strong>’s<br />
Africa Health Initiative. Malaria is Africa’s leading cause of<br />
mortality among children under five.<br />
EXXON MOBIL CORPORATION • <strong>2004</strong> SUMMARY ANNUAL REPORT
36<br />
SOCIAL RESPONSIBILITY<br />
Our partnerships with communities are dynamic and<br />
take many forms. Conducting operations throughout the<br />
world has taught us that there are unlimited challenges<br />
in meeting society’s complex expectations. Wherever<br />
<strong>ExxonMobil</strong> operates, we strive to support and strengthen<br />
local communities. Because “we live here too,” investing in<br />
community projects and helping to build individual and<br />
organizational capacity through training and development<br />
are important to us.<br />
Economic Capacity Building<br />
<strong>ExxonMobil</strong> believes that one of the most important<br />
contributions we can make to a community is to support<br />
economic growth. We do this through investment, employment,<br />
support for the rule of law, assistance with education<br />
and training, the transfer of knowledge and skills, and the<br />
purchase of certain local goods and services.<br />
In <strong>2004</strong>, for example, <strong>ExxonMobil</strong> launched a new volunteer<br />
program in Nigeria that utilizes employees as tutors and<br />
mentors to secondary school students. The classes emphasize<br />
core science/social science subjects such as math,<br />
chemistry, physics, and civic education. Employees lend<br />
both expertise and encouragement to the students –<br />
enhancing the learning experience for local youth as well<br />
as introducing them to potential career opportunities.<br />
Community Engagement<br />
Before investing in major projects in new areas, <strong>ExxonMobil</strong><br />
prepares comprehensive social needs assessments.<br />
This formal process identifies both potential risks to the<br />
community, as well as local needs and aspirations.<br />
We are committed to ongoing engagement with our<br />
communities. During the life of a project or facility, we<br />
work to meet regularly with community leaders, community<br />
associations and nongovernmental organizations that are<br />
interested in our operations. Two-way dialogue helps us<br />
better understand the viewpoints and concerns of the<br />
diverse communities in which we operate, and provides<br />
us with an opportunity to share information on our operational<br />
processes, environmental safeguards, future plans,<br />
and strategies.<br />
During <strong>2004</strong>, <strong>ExxonMobil</strong> affiliates worldwide provided<br />
$106 million in charitable contributions and communitydevelopment<br />
investments. We directed more than<br />
$40 million of the funding to education, with other priority<br />
areas in health and environmental projects.<br />
EXXON MOBIL CORPORATION • <strong>2004</strong> SUMMARY ANNUAL REPORT<br />
DISASTER RELIEF IN ASIA PACIFIC<br />
Responding to the devastating tsunami in December<br />
<strong>2004</strong>, <strong>ExxonMobil</strong> affiliates worked with governments,<br />
relief organizations, and health institutions to understand<br />
and address the needs of local communities. During the<br />
first week of the crisis, the Company provided immediate<br />
financial assistance as well as air transportation, food<br />
and medical supplies, tarpaulins for refugee shelters, and<br />
other in-kind necessities to some of the affected communities.<br />
The Company announced a $5 million contribution<br />
to the tsunami relief efforts. In addition, the Company is<br />
matching donations worldwide from employees, retirees<br />
and surviving spouses, dealers, and distributors.<br />
CORPORATE GOVERNANCE<br />
At <strong>ExxonMobil</strong>, our straightforward business model, high<br />
standards of integrity and legal compliance, governance<br />
practices, and management control systems are key to<br />
achieving long-term, sustainable performance. In our view,<br />
the methods we employ to attain results are as important<br />
as the results themselves. We are committed to candor,<br />
honesty, and integrity in all aspects of our business,<br />
including the reports we make to investors.<br />
<strong>ExxonMobil</strong> has a long history of corporate governance<br />
leadership. We have: a majority of independent directors;<br />
audit, governance, compensation, public issues, and<br />
contributions committees composed entirely of independent<br />
directors; board resolutions authorizing and directing<br />
committee activities; committee charters; and comprehensive,<br />
documented, and widely distributed Standards of<br />
Business Conduct. <strong>ExxonMobil</strong>’s corporate governance<br />
practices and financial controls meet the requirements of<br />
the Sarbanes-Oxley Act and the New York Stock Exchange<br />
listing standards. For more information on governance,<br />
visit our website at www.exxonmobil.com.<br />
ADDITIONAL INFORMATION<br />
A complete copy of <strong>ExxonMobil</strong>’s Corporate<br />
Citizenship <strong>Report</strong>* is available on the Internet at<br />
www.exxonmobil.com.<br />
*This year, our Corporate Citizenship <strong>Report</strong> is produced<br />
in accordance with the International Petroleum Industry<br />
Environmental Conservation Association (IPIECA) and the<br />
American Petroleum Institute’s (API) recently developed<br />
Guidance on Non-Financial “Sustainability” <strong>Report</strong>ing.<br />
<strong>ExxonMobil</strong> has been an active participant, along with<br />
others in the industry, in developing this guidance.
Financial Information<br />
REPORT OF INDEPENDENT REGISTERED PUBLIC ACCOUNTING FIRM<br />
TO THE SHAREHOLDERS OF EXXON MOBIL CORPORATION:<br />
We have audited, in accordance with the standards of the Public Company Accounting Oversight Board (United States), the consolidated<br />
financial statements of Exxon Mobil Corporation as of December 31, <strong>2004</strong>, and 2003, and for each of the three years in the period ended<br />
December 31, <strong>2004</strong> (not presented herein), management’s assessment of the effectiveness of the Corporation’s internal control over financial<br />
reporting as of December 31, <strong>2004</strong> (not presented herein) and the effectiveness of the Corporation’s internal control over financial reporting as<br />
of December 31, <strong>2004</strong>; and in our report dated February 28, 2005, we expressed unqualified opinions thereon. The consolidated financial<br />
statements and management’s assessment of the effectiveness of internal control over financial reporting referred to above appear in<br />
Appendix A to the Proxy Statement for the 2005 annual meeting of shareholders of the Corporation.<br />
In our opinion, the information set forth in the accompanying condensed consolidated financial statements is fairly stated, in all material<br />
respects, in relation to the consolidated financial statements from which it has been derived.<br />
Dallas, Texas<br />
February 28, 2005<br />
SUMMARY OF ACCOUNTING POLICIES AND PRACTICES<br />
The Corporation’s accounting and financial reporting fairly reflect its straightforward business model involving the extracting, refining, and<br />
marketing of hydrocarbons and hydrocarbon-based products. The preparation of financial statements in conformity with generally accepted<br />
accounting principles requires management to make estimates and judgments that affect the reported amounts of assets, liabilities, revenues,<br />
and expenses, and the disclosure of contingent assets and liabilities. Actual results could differ from these estimates.<br />
The summary financial statements include the accounts of those significant subsidiaries owned directly or indirectly with more than 50 percent<br />
of the voting rights held by the Corporation, and for which other shareholders do not possess the right to participate in significant management<br />
decisions. Also included are certain affiliates owned less than 50 percent, but where the Corporation has a majority economic interest.<br />
Revenues associated with sales of crude oil, natural gas, petroleum and chemical products, and all other items are recorded when title passes<br />
to the customer.<br />
The Corporation makes limited use of derivative instruments to offset its economic exposures associated with interest rates, foreign currency<br />
exchange rates, and hydrocarbon prices. Derivative instruments are recorded at fair value, and gains and losses arising from changes in fair value<br />
of those instruments are recorded in income. All derivatives activity is immaterial.<br />
Inventories of crude oil, products, and merchandise are carried at the lower of current market value or cost (generally determined under the last-in,<br />
first-out method – LIFO). Inventories of materials and supplies are valued at cost or less.<br />
The Corporation’s exploration and production activities are accounted for under the “successful efforts” method. Depreciation, depletion, and<br />
amortization, based on cost less estimated salvage value of the asset, are primarily determined under either the unit-of-production method or the<br />
straight-line method. Unit-of-production rates are based on oil, gas, and other mineral reserves estimated to be recoverable from existing facilities.<br />
The straight-line method is based on estimated asset service life taking obsolescence into consideration.<br />
Asset retirement obligations that may be incurred at the end of the operating life of upstream properties are recorded as liabilities at fair value when<br />
the assets are installed. Over time, the liabilities are accreted for the change in present value. Liabilities for environmental costs are recorded when<br />
it is probable that obligations have been incurred and the amounts can be reasonably estimated.<br />
The “functional currency” for translating the accounts of the majority of downstream and chemical operations outside the United States is the local<br />
currency. Local currency is also used for upstream operations that are relatively self-contained and integrated within a particular country. The U.S.<br />
dollar is used for operations in highly inflationary economies and certain other countries.<br />
Effective January 1, 2003, the fair value of future grants of employee stock-based awards is recorded in compensation expense over the vesting<br />
period. For grants made prior to that date, no expense is recorded for stock option awards, but for awards granted in the form of restricted stock,<br />
compensation expense based on the value of the shares on the date of grant is recorded over the vesting period.<br />
A variety of claims have been made against <strong>ExxonMobil</strong> and certain of its consolidated subsidiaries in a number of pending lawsuits and tax<br />
disputes. For further information on litigation and other contingencies, see note 16 on page A46 of <strong>ExxonMobil</strong>’s 2005 Proxy Statement.<br />
Further information on the Corporation’s accounting policies and practices can be found in <strong>ExxonMobil</strong>’s 2005 Proxy Statement on pages A17 through A23 (Critical Accounting Policies)<br />
and on pages A30 through A32 (note 1 to the Financial Statements).<br />
EXXON MOBIL CORPORATION • <strong>2004</strong> SUMMARY ANNUAL REPORT<br />
37
38<br />
SUMMARY STATEMENT OF INCOME<br />
(millions of dollars) <strong>2004</strong> 2003 2002<br />
___________________________________________________________________________________________________________________________________________________________________________________________________________________________________________________________________________________________________________________________________________________________________________________________________________________________________________________________________________________<br />
Revenues and Other Income<br />
Sales and other operating revenue (1) _<br />
291,252 237,054 200,949<br />
Income from equity affiliates 4,961 4,373 2,066<br />
Other income 1,822 5,311 1,491<br />
Total revenues and other income 298,035 246,738 204,506<br />
Costs and Other Deductions<br />
Crude oil and product purchases 139,224 107,658 90,950<br />
Production and manufacturing expenses 23,225 21,260 17,831<br />
Selling, general, and administrative expenses 13,849 13,396 12,356<br />
Depreciation and depletion 9,767 9,047 8,310<br />
Exploration expenses, including dry holes 1,098 1,010 920<br />
Merger-related expenses – – 410<br />
Interest expense 638 207 398<br />
Excise taxes (1) _<br />
27,263 23,855 22,040<br />
Other taxes and duties 40,954 37,645 33,572<br />
Income applicable to minority and preferred interests 776 694 209<br />
Total costs and other deductions 256,794 214,772 186,996<br />
_<br />
Income before income taxes 41,241 31,966 17,510<br />
Income taxes 15,911 11,006 6,499<br />
Income from continuing operations 25,330 20,960 11,011<br />
Discontinued operations, net of income tax – – 449<br />
Cumulative effect of accounting change, net of income tax – 550 –<br />
Net income 25,330 21,510 11,460<br />
Net Income per Common Share (dollars)<br />
_<br />
Income from continuing operations 3.91 3.16 1.62<br />
Discontinued operations, net of income tax – – 0.07<br />
Cumulative effect of accounting change, net of income tax – 0.08 –<br />
Net income 3.91 3.24 1.69<br />
Net Income per Common Share – Assuming Dilution (dollars)<br />
_<br />
Income from continuing operations 3.89 3.15 1.61<br />
Discontinued operations, net of income tax – – 0.07<br />
Cumulative effect of accounting change, net of income tax – 0.08 –<br />
Net income 3.89 3.23 1.68<br />
(1) Excise taxes included in sales and other operating revenue are $27,263 million for <strong>2004</strong>, $23,855 million for 2003, and $22,040 million for 2002.<br />
The information in the <strong>Summary</strong> Statement of Income, the <strong>Summary</strong> Balance Sheet, and the <strong>Summary</strong> Statement of Cash Flows, shown on pages 38 through 40<br />
is a replication of the information in the Consolidated Statement of Income, Consolidated Balance Sheet, and the Consolidated Statement of Cash Flows in<br />
<strong>ExxonMobil</strong>’s 2005 Proxy Statement. For complete consolidated financial statements, including notes, please refer to pages A26 through A53 of <strong>ExxonMobil</strong>’s 2005<br />
Proxy Statement. See also management’s discussion and analysis of financial condition and results of operations and other information on pages A6 through A23 of<br />
the 2005 Proxy Statement.<br />
EXXON MOBIL CORPORATION • <strong>2004</strong> SUMMARY ANNUAL REPORT<br />
_<br />
_<br />
_<br />
_<br />
_<br />
_
SUMMARY BALANCE SHEET AT YEAR END<br />
F INANCIAL I NFORMATION 39<br />
(millions of dollars) <strong>2004</strong> 2003<br />
___________________________________________________________________________________________________________________________________________________________________________________________________________________________________________________________________________________________________________________________________________________________________________________________________________________________________________________________________________________<br />
Assets<br />
Current assets<br />
Cash and cash equivalents 18,531 10,626<br />
Cash and cash equivalents – restricted 4,604 –<br />
Notes and accounts receivable, less estimated doubtful amounts 25,359 24,309<br />
Inventories<br />
Crude oil, products, and merchandise 8,136 7,665<br />
Materials and supplies 1,351 1,292<br />
Prepaid taxes and expenses 2,396 2,068<br />
_<br />
Total current assets 60,377 45,960<br />
_<br />
Investments and advances 18,404 15,535<br />
Property, plant, and equipment, at cost, less accumulated depreciation and depletion 108,639 104,965<br />
Other assets, including intangibles – net 7,836 7,818<br />
_<br />
Total assets 195,256 174,278<br />
_<br />
Liabilities<br />
Current liabilities<br />
Notes and loans payable 3,280 4,789<br />
Accounts payable and accrued liabilities 31,763 28,445<br />
Income taxes payable 7,938 5,152<br />
_<br />
Total current liabilities 42,981 38,386<br />
_<br />
Long-term debt 5,013 4,756<br />
Annuity reserves 10,850 9,609<br />
Accrued liabilities 6,279 5,283<br />
Deferred income tax liabilities 21,092 20,118<br />
Deferred credits and other long-term obligations 3,333 2,829<br />
Equity of minority and preferred shareholders in affiliated companies 3,952 3,382<br />
_<br />
Total liabilities 93,500 84,363<br />
_<br />
Commitments and Contingencies<br />
Shareholders’ Equity<br />
Benefit-plan-related balances (1,014) (634)<br />
Common stock without par value (9,000 million shares authorized) 5,067 4,468<br />
Earnings reinvested 134,390 115,956<br />
Accumulated other non-owner changes in equity<br />
Cumulative foreign exchange translation adjustment 3,598 1,421<br />
Minimum pension liability adjustment (2,499) (2,446)<br />
Unrealized gains/(losses) on stock investments 428 511<br />
Common stock held in treasury (1,618 million shares in <strong>2004</strong> and 1,451 million shares in 2003) (38,214) (29,361)<br />
_<br />
Total shareholders’ equity 101,756 89,915<br />
Total liabilities and shareholders’ equity 195,256 174,278<br />
The information in the <strong>Summary</strong> Statement of Income, the <strong>Summary</strong> Balance Sheet, and the <strong>Summary</strong> Statement of Cash Flows, shown on pages 38 through 40<br />
is a replication of the information in the Consolidated Statement of Income, Consolidated Balance Sheet, and the Consolidated Statement of Cash Flows in<br />
<strong>ExxonMobil</strong>’s 2005 Proxy Statement. For complete consolidated financial statements, including notes, please refer to pages A26 through A53 of <strong>ExxonMobil</strong>’s 2005<br />
Proxy Statement. See also management’s discussion and analysis of financial condition and results of operations and other information on pages A6 through A23 of<br />
the 2005 Proxy Statement.<br />
EXXON MOBIL CORPORATION • <strong>2004</strong> SUMMARY ANNUAL REPORT<br />
_
40<br />
SUMMARY STATEMENT OF CASH FLOWS<br />
(millions of dollars) <strong>2004</strong> 2003 2002<br />
___________________________________________________________________________________________________________________________________________________________________________________________________________________________________________________________________________________________________________________________________________________________________________________________________________________________________________________________________________________<br />
Cash Flows from Operating Activities<br />
Net income<br />
Accruing to <strong>ExxonMobil</strong> shareholders 25,330 21,510 11,460<br />
Accruing to minority and preferred interests 776 694 209<br />
Cumulative effect of accounting change, net of income tax – (550) –<br />
Adjustments for noncash transactions<br />
Depreciation and depletion 9,767 9,047 8,310<br />
Deferred income tax charges/(credits) (1,134) 1,827 297<br />
Annuity provisions 886 (1,489) (500)<br />
Accrued liability provisions 806 264 (90)<br />
Dividends received greater than/(less than) equity in current earnings of equity companies (1,643) (402) (170)<br />
Changes in operational working capital, excluding cash and debt<br />
Reduction/(increase) – Notes and accounts receivable (472) (1,286) (305)<br />
– Inventories (223) (100) 353<br />
– Prepaid taxes and expenses 11 42 32<br />
Increase/(reduction) – Accounts and other payables 6,333 1,130 365<br />
Ruhrgas transaction – (2,240) 1,466<br />
All other items – net 114 51 (159)<br />
_<br />
Net cash provided by operating activities 40,551 28,498 21,268<br />
_<br />
Cash Flows from Investing Activities<br />
Additions to property, plant, and equipment (11,986) (12,859) (11,437)<br />
Sales of subsidiaries, investments, and property, plant, and equipment 2,754 2,290 2,793<br />
Increase in restricted cash and cash equivalents (4,604) – –<br />
Additional investments and advances (2,287) (809) (2,012)<br />
Collection of advances 1,213 536 898<br />
_<br />
Net cash used in investing activities (14,910) (10,842) (9,758)<br />
_<br />
Cash Flows from Financing Activities<br />
Additions to long-term debt 470 127 396<br />
Reductions in long-term debt (562) (914) (246)<br />
Additions to short-term debt 450 715 751<br />
Reductions in short-term debt (2,243) (1,730) (927)<br />
Additions/(reductions) in debt with less than 90-day maturity (66) (322) (281)<br />
Cash dividends to <strong>ExxonMobil</strong> shareholders (6,896) (6,515) (6,217)<br />
Cash dividends to minority interests (215) (430) (169)<br />
Changes in minority interests and sales/(purchases) of affiliate stock (215) (247) (161)<br />
Common stock acquired (9,951) (5,881) (4,798)<br />
Common stock sold 960 434 299<br />
_<br />
Net cash used in financing activities (18,268) (14,763) (11,353)<br />
_<br />
Effects of exchange rate changes on cash 532 504 525<br />
_<br />
Increase/(decrease) in cash and cash equivalents 7,905 3,397 682<br />
Cash and cash equivalents at beginning of year 10,626 7,229 6,547<br />
_<br />
Cash and cash equivalents at end of year 18,531 10,626 7,229<br />
_<br />
The information in the <strong>Summary</strong> Statement of Income, the <strong>Summary</strong> Balance Sheet, and the <strong>Summary</strong> Statement of Cash Flows, shown on pages 38 through 40<br />
is a replication of the information in the Consolidated Statement of Income, Consolidated Balance Sheet, and the Consolidated Statement of Cash Flows in<br />
<strong>ExxonMobil</strong>’s 2005 Proxy Statement. For complete consolidated financial statements, including notes, please refer to pages A26 through A53 of <strong>ExxonMobil</strong>’s 2005<br />
Proxy Statement. See also management’s discussion and analysis of financial condition and results of operations and other information on pages A6 through A23 of<br />
the 2005 Proxy Statement.<br />
EXXON MOBIL CORPORATION • <strong>2004</strong> SUMMARY ANNUAL REPORT
DIVIDEND AND SHAREHOLDER RETURN INFORMATION<br />
F INANCIAL I NFORMATION 41<br />
<strong>2004</strong> 2003 2002 2001 2000<br />
___________________________________________________________________________________________________________________________________________________________________________________________________________________________________________________________________________________________________________________________________________________________________________________________________________________________________________________________________________________<br />
Net income per common share (dollars) 3.91 3.24 1.69 2.23 2.55<br />
Net income per common share – assuming dilution (dollars) 3.89 3.23 1.68 2.21 2.52<br />
Dividends per common share (dollars)<br />
First quarter 0.25 0.23 0.23 0.22 0.22<br />
Second quarter 0.27 0.25 0.23 0.23 0.22<br />
Third quarter 0.27 0.25 0.23 0.23 0.22<br />
__________________________________________________________________________________________________________________________________________________________________________________________________________________________________________________________________________________________________________________________________________________________________________________________________________________________________________________________________________________<br />
Fourth quarter 0.27 0.25 0.23 0.23 0.22<br />
Total 1.06 0.98 0.92 0.91 0.88<br />
<strong>Annual</strong> dividend per share growth (percent) 8.2 6.5 1.1 3.4 4.3<br />
Number of common shares outstanding (millions)<br />
Average 6,482 6,634 6,753 6,868 6,953<br />
Average – assuming dilution 6,519 6,662 6,803 6,941 7,033<br />
Year end 6,401 6,568 6,700 6,809 6,930<br />
Cash dividends paid on common stock (millions of dollars) 6,896 6,515 6,217 6,254 6,123<br />
Cash dividends paid to net income (percent) 27 30 54 41 35<br />
Cash dividends paid to cash flow (1) (percent) 17 23 29 27 27<br />
<strong>Annual</strong> total return to shareholders (2) (percent) 27.9 20.5 (8.9) (7.6) 10.2<br />
Market quotations for common stock (dollars)<br />
High 52.05 41.13 44.58 45.84 47.72<br />
Low 39.91 31.58 29.75 35.01 34.94<br />
Average daily close 45.29 36.14 37.70 41.29 41.42<br />
Year-end close 51.26 41.00 34.94 39.30 43.47<br />
(1) Cash flow from operating activities.<br />
(2) Total return to shareholders is the appreciation of the stock price over a year plus the value of the dividends, with dividend reinvestment, and excluding trading<br />
commissions and taxes.<br />
C UMULATIVE DISTRIBUTIONS TO SHAREHOLDERS<br />
Dividends Share Purchases Net of Anti-Dilutive Purchases<br />
(billions of dollars)<br />
60<br />
50<br />
40<br />
30<br />
20<br />
10<br />
0<br />
2000 2001 2002 2003 <strong>2004</strong><br />
L ONG-T ERM TOTAL S HAREHOLDER R ETURN<br />
Value of $1,000 Invested with Dividends Reinvested<br />
<strong>ExxonMobil</strong> S&P 500<br />
(dollars)<br />
20,000<br />
15,000<br />
10,000<br />
5,000<br />
1,000<br />
84 86 88 90 92 94 96 98 00 02 04<br />
EXXON MOBIL CORPORATION • <strong>2004</strong> SUMMARY ANNUAL REPORT<br />
_<br />
_<br />
_<br />
_<br />
_
42<br />
RESERVES SUMMARY – Net Proved Developed and Undeveloped Reserves (1)<br />
<strong>2004</strong> 2003 2002 2001 2000<br />
___________________________________________________________________________________________________________________________________________________________________________________________________________________________________________________________________________________________________________________________________________________________________________________________________________________________________________________________________________________<br />
Liquids, Including Tar Sands and Non-Consolidated Reserves (1) (millions of barrels at year end)<br />
Net proved developed and undeveloped reserves<br />
United States 2,894 3,218 3,352 3,494 3,480<br />
Canada (1) 1,848 1,975 2,085 2,098 1,940<br />
Europe 1,029 1,204 1,359 1,503 1,591<br />
Asia Pacific 613 684 691 622 690<br />
Africa 2,654 2,742 2,626 2,461 2,384<br />
Middle East 1,216 833 803 788 756<br />
Other 2,259 2,200 1,707 1,346 1,330<br />
Total worldwide excluding year-end price/cost revisions 12,513 12,856 12,623 12,312 12,171<br />
_<br />
Year-end price/cost revisions (862) – – – –<br />
Total worldwide 11,651 12,856 12,623 12,312 12,171<br />
_<br />
Natural Gas, Including Non-Consolidated Reserves (billions of cubic feet at year end)<br />
Net proved developed and undeveloped reserves<br />
United States 10,578 11,424 12,239 12,924 13,296<br />
Canada 1,979 2,341 2,882 3,183 3,516<br />
Europe 21,916 23,849 24,336 25,252 26,017<br />
Asia Pacific 6,029 7,285 7,958 8,301 8,546<br />
Africa 771 583 436 379 375<br />
Middle East 14,122 6,921 5,722 4,275 2,595<br />
Other 2,545 2,366 2,145 1,632 1,521<br />
Total worldwide excluding year-end price/cost revisions 57,940 54,769 55,718 55,946 55,866<br />
_<br />
Year-end price/cost revisions 2,422 – – – –<br />
Total worldwide 60,362 54,769 55,718 55,946 55,866<br />
_<br />
Reserves replacement ratio, excluding asset sales (2) (percent) 125 107 118 111 112<br />
Reserves replacement ratio, including asset sales (2) (percent) 112 105 117 110 111<br />
Reserves replacement ratio, including asset sales<br />
and year-end price/cost revisions (percent) 83 NA NA NA NA<br />
(1) <strong>ExxonMobil</strong> has significant interest in proven tar sands reserves in Canada. Please see Frequently Used Terms on pages 44 and 45 for the definition of reserves.<br />
(2) Excluding year-end revisions associated with using December 31, <strong>2004</strong>, prices and costs.<br />
LEADING RESERVES BASE<br />
Excluding sales and year-end price/cost revisions, the<br />
Company has added 19 billion oil-equivalent barrels to<br />
proved reserves over the last 10 years, more than replacing<br />
production. <strong>ExxonMobil</strong>’s proved reserve base of 22 billion<br />
oil-equivalent barrels equates to a reserve life, at current<br />
production rates, of 14 years.<br />
P ROVED RESERVE REPLACEMENT (1)<br />
Liquids Additions Gas Additions Production<br />
(billions of oil-equivalent barrels)<br />
2.5<br />
2.0<br />
1.5<br />
1.0<br />
0.5<br />
0<br />
94<br />
95<br />
96<br />
(1) Excludes sales and <strong>2004</strong> year-end price/cost revisions.<br />
97<br />
98<br />
EXXON MOBIL CORPORATION • <strong>2004</strong> SUMMARY ANNUAL REPORT<br />
99<br />
00<br />
01<br />
02<br />
03<br />
04<br />
GLOBAL SCALE – GEOGRAPHIC DIVERSITY<br />
The Company’s global reach, scale, and functional and geographic<br />
diversity are core strengths. The colored bars below<br />
represent the percentage of <strong>ExxonMobil</strong>’s liquids production,<br />
natural gas production, petroleum product sales, and<br />
chemical prime product sales in each of the regions shown.<br />
F UNCTIONAL AND GEOGRAPHIC DIVERSITY—<br />
A CORE STRENGTH OF EXXONM OBIL<br />
Relative Contribution in <strong>2004</strong> by Functional and Geographic Area<br />
Crude and Natural Gas Liquids Production<br />
Natural Gas Production Available for Sale<br />
Petroleum Product Sales Volumes<br />
Chemical Prime Product Sales Volumes<br />
(percent)<br />
37 31<br />
49 46<br />
Americas<br />
32<br />
23<br />
47<br />
Europe<br />
7 5 3<br />
Africa / Other<br />
26 24<br />
27<br />
20<br />
15<br />
8<br />
Asia Pacific
BUSINESS PROFILE (1)<br />
VOLUMES SUMMARY<br />
F INANCIAL I NFORMATION 43<br />
<strong>2004</strong> 2003 2002 2001 2000<br />
___________________________________________________________________________________________________________________________________________________________________________________________________________________________________________________________________________________________________________________________________________________________________________________________________________________________________________________________________________________<br />
Net production of crude oil and natural gas liquids (thousands of barrels daily)<br />
United States 557 610 681 712 733<br />
Non-U.S. 2,014 1,906 1,815 1,830 1,820<br />
__________________________________________________________________________________________________________________________________________________________________________________________________________________________________________________________________________________________________________________________________________________________________________________________________________________________________________________________________________________<br />
Total worldwide 2,571 2,516 2,496 2,542 2,553<br />
Net natural gas production available for sale (millions of cubic feet daily)<br />
United States 1,947 2,246 2,375 2,598 2,856<br />
Non-U.S. 7,917 7,873 8,077 7,681 7,487<br />
__________________________________________________________________________________________________________________________________________________________________________________________________________________________________________________________________________________________________________________________________________________________________________________________________________________________________________________________________________________<br />
Total worldwide 9,864 10,119 10,452 10,279 10,343<br />
(thousands of oil-equivalent barrels daily)<br />
Oil-equivalent production* 4,215 4,203 4,238 4,255 4,277<br />
Refinery throughput (thousands of barrels daily)<br />
United States 1,850 1,806 1,834 1,811 1,862<br />
Non-U.S. 3,863 3,704 3,609 3,731 3,780<br />
__________________________________________________________________________________________________________________________________________________________________________________________________________________________________________________________________________________________________________________________________________________________________________________________________________________________________________________________________________________<br />
Total worldwide 5,713 5,510 5,443 5,542 5,642<br />
Petroleum product sales<br />
United States 2,872 2,729 2,731 2,751 2,669<br />
Non-U.S. 5,338 5,228 5,026 5,220 5,324<br />
__________________________________________________________________________________________________________________________________________________________________________________________________________________________________________________________________________________________________________________________________________________________________________________________________________________________________________________________________________________<br />
Total worldwide 8,210 7,957 7,757 7,971 7,993<br />
Gasoline, naphthas 3,301 3,238 3,176 3,165 3,122<br />
Heating oils, kerosene, diesel 2,517 2,432 2,292 2,389 2,373<br />
Aviation fuels 698 662 691 721 749<br />
Heavy fuels 659 638 604 668 694<br />
Specialty products 1,035 987 994 1,028 1,055<br />
__________________________________________________________________________________________________________________________________________________________________________________________________________________________________________________________________________________________________________________________________________________________________________________________________________________________________________________________________________________<br />
Total worldwide 8,210 7,957 7,757 7,971 7,993<br />
Chemical prime product sales (thousands of metric tons)<br />
United States 11,521 10,740 11,386 11,078 11,736<br />
Non-U.S. 16,267 15,827 15,220 14,702 13,901<br />
__________________________________________________________________________________________________________________________________________________________________________________________________________________________________________________________________________________________________________________________________________________________________________________________________________________________________________________________________________________<br />
Total worldwide 27,788 26,567 26,606 25,780 25,637<br />
*Gas converted to oil-equivalent at 6 million cubic feet = 1 thousand barrels.<br />
Earnings After Capital and Average Capital Return on Average<br />
Income Taxes Exploration Expenditures Employed Capital Employed<br />
<strong>2004</strong> 2003 2002 <strong>2004</strong> 2003 2002 <strong>2004</strong> 2003 2002 <strong>2004</strong> 2003 2002<br />
___________________________________________________________________________________________________________________________________________________________________________________________________________________________________________________________________________________________________________________________________________________________________________________________________________________________________________________________________________________<br />
(millions of dollars, except as noted) (percent)<br />
Upstream<br />
United States 4,948 3,905 2,524 1,922 2,125 2,357 13,355 13,508 13,264 37.0 28.9 19.0<br />
Non-U.S. 11,727 10,597 7,074 9,793 9,863 8,037 37,287 34,164 29,800 31.5 31.0 23.7<br />
Total 16,675 14,502 9,598 11,715 11,988 10,394 50,642 47,672 43,064 32.9 30.4 22.3<br />
Downstream<br />
United States 2,186 1,348 693 775 1,244 980 7,632 8,090 8,060 28.6 16.7 8.6<br />
Non-U.S. 3,520 2,168 607 1,630 1,537 1,470 19,541 18,875 17,985 18.0 11.5 3.4<br />
Total 5,706 3,516 1,300 2,405 2,781 2,450 27,173 26,965 26,045 21.0 13.0 5.0<br />
Chemical<br />
United States 1,020 381 384 262 333 575 5,246 5,194 5,235 19.4 7.3 7.3<br />
Non-U.S. 2,408 1,051 446 428 359 379 9,362 8,905 8,410 25.7 11.8 5.3<br />
Total 3,428 1,432 830 690 692 954 14,608 14,099 13,645 23.5 10.2 6.1<br />
__________________________________________________________________________________________________________________________________________________________________________________________________________________________________________________________________________________________________________________________________________________________________________________________________________________________________________________________________________________<br />
Corporate and financing (479) 1,510 (442) 75 64 77 14,916 6,637 4,878 – – –<br />
Merger-related expenses – – (275) – – – – – – – – –<br />
Discontinued operations – – 449 – – 80 – – 710 – – 63.2<br />
Accounting change – 550 – – – – – – – – – –<br />
__________________________________________________________________________________________________________________________________________________________________________________________________________________________________________________________________________________________________________________________________________________________________________________________________________________________________________________________________________________<br />
<strong>ExxonMobil</strong> total 25,330 21,510 11,460 14,885 15,525 13,955 107,339 95,373 88,342 23.8 20.9 13.5<br />
(1) For definitions of selected financial performance measures, see Frequently Used Terms on pages 44 and 45.<br />
EXXON MOBIL CORPORATION • <strong>2004</strong> SUMMARY ANNUAL REPORT
44<br />
Frequently Used Terms<br />
Listed below are definitions of several of <strong>ExxonMobil</strong>’s key business and financial performance measures and other terms.<br />
These definitions are provided to facilitate understanding of the terms and their calculation.<br />
C ASH FLOW FROM OPERATIONS AND ASSET SALES<br />
Cash flow from operations and asset sales is the sum of the net cash provided by operating activities and proceeds from sales of subsidiaries,<br />
investments, and property, plant, and equipment from the <strong>Summary</strong> Statement of Cash Flows. This cash flow is the total sources of cash from<br />
both operating the Corporation’s assets and from the divesting of assets. The Corporation employs a long-standing and regular disciplined<br />
review process to ensure that all assets are contributing to the Corporation’s strategic and financial objectives. Assets are divested when they<br />
are no longer meeting these objectives, or are worth considerably more to others. Because of the regular nature of this activity, we believe<br />
it is useful for investors to consider sales proceeds together with cash provided by operating activities when evaluating cash available for<br />
investment in the business and financing activities, including shareholder distributions.<br />
(millions of dollars) <strong>2004</strong> 2003 2002<br />
_<br />
Net cash provided by operating activities 40,551 28,498 21,268<br />
Sales of subsidiaries, investments and property, plant, and equipment 2,754 2,290 2,793<br />
__________________________________________________________________________________________________________________________________________________________________________________________________________________________________________________________________________________________________________________________________________________________________________________________________________________________________________________________________________________________________________________________________<br />
Cash flow from operations and asset sales 43,305 30,788 24,061<br />
_<br />
C APITAL EMPLOYED<br />
Capital employed is a measure of net investment. When viewed from the perspective of how the capital is used by the businesses, it includes<br />
<strong>ExxonMobil</strong>’s net share of property, plant, and equipment, and other assets less liabilities, excluding both short-term and long-term debt.<br />
When viewed from the perspective of the sources of capital employed in total for the Corporation, it includes <strong>ExxonMobil</strong>’s share of total debt<br />
and shareholders’ equity. Both of these views include <strong>ExxonMobil</strong>’s share of amounts applicable to equity companies, which the Corporation<br />
believes should be included to provide a more comprehensive measure of capital employed.<br />
(millions of dollars) <strong>2004</strong> 2003 2002<br />
_<br />
Business uses: asset and liability perspective<br />
Total assets 195,256 174,278 152,644<br />
Less liabilities and minority share of assets and liabilities<br />
Total current liabilities excluding notes and loans payable (39,701) (33,597) (29,082)<br />
Total long-term liabilities excluding long-term debt and equity of minority<br />
and preferred shareholders in affiliated companies (41,554) (37,839) (35,449)<br />
Minority share of assets and liabilities (5,285) (4,945) (4,210)<br />
Add <strong>ExxonMobil</strong> share of debt-financed equity-company net assets 3,914 4,151 4,795<br />
__________________________________________________________________________________________________________________________________________________________________________________________________________________________________________________________________________________________________________________________________________________________________________________________________________________________________________________________________________________________________________________________________<br />
Total capital employed 112,630 102,048 88,698<br />
_<br />
Total corporate sources: debt and equity perspective<br />
Notes and loans payable 3,280 4,789 4,093<br />
Long-term debt 5,013 4,756 6,655<br />
Shareholders’ equity 101,756 89,915 74,597<br />
Less minority share of total debt (1,333) (1,563) (1,442)<br />
Add <strong>ExxonMobil</strong> share of equity-company debt 3,914 4,151 4,795<br />
__________________________________________________________________________________________________________________________________________________________________________________________________________________________________________________________________________________________________________________________________________________________________________________________________________________________________________________________________________________________________________________________________<br />
Total capital employed 112,630 102,048 88,698<br />
_<br />
C APITAL AND EXPLORATION EXPENDITURES (Capex)<br />
Capital and exploration expenditures are the combined total of additions at cost to property, plant, and equipment, and exploration expenses<br />
on a before-tax basis from the Consolidated Statement of Income. <strong>ExxonMobil</strong>’s capex includes its share of similar costs for equity companies.<br />
Capex excludes depreciation on the cost of exploration support equipment and facilities recorded to property, plant, and equipment when<br />
acquired. While <strong>ExxonMobil</strong>’s management is responsible for all investments and elements of net income, particular focus is placed on<br />
managing the controllable aspects of this group of expenditures.<br />
RETURN ON AVERAGE CAPITAL EMPLOYED (ROCE)<br />
Return on average capital employed is a performance measure ratio. From the perspective of the business segments, ROCE is annual<br />
business segment earnings divided by average business segment capital employed (average of beginning and end-of-year amounts). These<br />
segment earnings include <strong>ExxonMobil</strong>’s share of segment earnings of equity companies, consistent with our capital employed definition, and<br />
EXXON MOBIL CORPORATION • <strong>2004</strong> SUMMARY ANNUAL REPORT
F REQUENTLY U SED T ERMS 45<br />
exclude the cost of financing. The Corporation’s total ROCE is net income excluding the after-tax cost of financing, divided by total corporate<br />
average capital employed. The Corporation has consistently applied its ROCE definition for many years, and views it as the best measure of<br />
historical capital productivity in our capital-intensive, long-term industry, both to evaluate management’s performance and to demonstrate to<br />
shareholders that capital has been used wisely over the long term. Additional measures, which tend to be more cash-flow based, are used for<br />
future investment decisions.<br />
(millions of dollars) <strong>2004</strong> 2003 2002<br />
_<br />
Net income 25,330 21,510 11,460<br />
Financing costs (after tax)<br />
Third-party debt (137) (69) (81)<br />
<strong>ExxonMobil</strong> share of equity companies (185) (172) (227)<br />
All other financing costs – net (1) 54 1,775 (127)<br />
__________________________________________________________________________________________________________________________________________________________________________________________________________________________________________________________________________________________________________________________________________________________________________________________________________________________________________________________________________________________________________________________________<br />
Total financing costs (268) 1,534 (435)<br />
__________________________________________________________________________________________________________________________________________________________________________________________________________________________________________________________________________________________________________________________________________________________________________________________________________________________________________________________________________________________________________________________________<br />
Earnings excluding financing costs 25,598 19,976 11,895<br />
__________________________________________________________________________________________________________________________________________________________________________________________________________________________________________________________________________________________________________________________________________________________________________________________________________________________________________________________________________________________________________________________________<br />
Average capital employed 107,339 95,373 88,342<br />
Return on average capital employed – corporate total 23.8% 20.9% 13.5%<br />
(1) “All other financing costs – net” in 2003 includes interest income (after tax) associated with the settlement of a U.S. tax dispute.<br />
LIQUIDS AND NATURAL GAS RESERVES<br />
In this report, we use the term “reserves” to mean quantities of oil and gas that <strong>ExxonMobil</strong> has determined to be reasonably certain of<br />
recovery under existing economic and operating conditions on the basis of our long-standing, rigorous management review process. We only<br />
book reserves when we have made significant funding commitments for the related projects. In this report, we aggregate reserves of consolidated<br />
and equity companies, excluding royalties and quantities due others, since <strong>ExxonMobil</strong> does not view these reserves differently from a<br />
management perspective. To reflect management’s view of <strong>ExxonMobil</strong>’s total liquids reserves, oil and gas reserves in this report also include<br />
tar sands reserves from Canadian Syncrude operations, which are reported separately as mining reserves in our SEC filings. Tar sands reserves<br />
included in this report totaled 757 million barrels at year-end <strong>2004</strong>, 781 million barrels at year-end 2003, 800 million barrels at year-end 2002,<br />
821 million barrels at year-end 2001, and 610 million barrels at year-end 2000. We determine reserves based on our long-term view of future<br />
price levels consistent with our investment decisions. Based on Securities and Exchange Commission guidance, <strong>ExxonMobil</strong> is also stating,<br />
for the first time, our results to reflect the impacts to the proved reserve base utilizing December 31 liquids and natural gas prices (“year-end<br />
price/cost revisions”). On this basis, year-end reserves, including year-end price/cost revisions, totaled 21.7 billion oil-equivalent barrels.<br />
Excluding year-end price/cost revisions, reserves totaled 22.2 billion oil-equivalent barrels.<br />
RESOURCES, RESOURCE BASE, AND RECOVERABLE RESOURCES<br />
Resources, resource base, recoverable oil, recoverable hydrocarbons, recoverable resources, and similar terms used in this report include<br />
quantities of oil and gas that are not yet classified as proved reserves, but which <strong>ExxonMobil</strong> believes will likely be moved into the proved<br />
reserves category and produced in the future.<br />
RESERVES REPLACEMENT RATIO<br />
Reserves replacement ratio is a performance measure that is calculated using proved oil-equivalent reserves additions divided by oil-equivalent<br />
production. Both proved reserves additions and production include amounts applicable to equity companies. The ratio usually reported by<br />
<strong>ExxonMobil</strong> excludes sales and year-end price/cost revisions, and includes Canadian tar sands operations in both additions and production<br />
volumes. See the definition of “liquids and natural gas reserves” above. When reporting the ratio, the inclusions and exclusions are listed, as<br />
shown on page 42.<br />
FINDING COSTS<br />
Finding costs per oil-equivalent barrel is a performance measure which is calculated using the Exploration portion of Upstream capital and<br />
exploration expenditures divided by new field resource additions (in oil-equivalent barrels). <strong>ExxonMobil</strong> refers to new discoveries and acquisitions<br />
of discovered, but undeveloped, resources as new field resource additions. It includes quantities of oil and gas that are not yet classified<br />
as proved reserves, but which <strong>ExxonMobil</strong> believes will likely be moved into the proved reserves category and produced in the future.<br />
<strong>2004</strong> 2003 2002<br />
_<br />
Exploration portion of Upstream capital & exploration expenditures (millions of dollars) 1,283 1,215 1,310<br />
New field resource additions (millions of oil-equivalent barrels) 2,940 2,110 2,150<br />
Finding cost per oil-equivalent barrel (dollars) 0.44 0.58 0.61<br />
EXXON MOBIL CORPORATION • <strong>2004</strong> SUMMARY ANNUAL REPORT
46<br />
Directors, Officers, and Affiliated Companies<br />
BOARD OF DIRECTORS<br />
Michael J. Boskin . . . . . T.M. Friedman Professor of Economics<br />
and Senior Fellow, Hoover Institution,<br />
Stanford University<br />
James R. Houghton . . . Chairman of the Board and Chief<br />
Executive Officer, Corning Incorporated<br />
(communications, advanced materials<br />
and display products)<br />
William R. Howell . . . . . Chairman Emeritus, J.C. Penney<br />
Company, Inc. (department store and<br />
catalog chain)<br />
Reatha Clark King . . . . . Former Chairman of the Board of<br />
Trustees, General Mills Foundation,<br />
the philanthropic foundation of General<br />
Mills, Inc. (manufacturer and marketer<br />
of consumer food products)<br />
Philip E. Lippincott . . . . Retired Chairman and Chief Executive<br />
Officer, Scott Paper Company (sanitary<br />
paper, printing and publishing papers,<br />
and forestry operations); Retired<br />
Chairman of the Board, Campbell Soup<br />
Company (manufacturer and marketer<br />
of branded convenience food products)<br />
EXXON MOBIL CORPORATION • <strong>2004</strong> SUMMARY ANNUAL REPORT<br />
Board of Directors, from left to right: James R. Houghton,<br />
Walter V. Shipley, Philip E. Lippincott, Reatha Clark King,<br />
Lee R. Raymond, Rex W. Tillerson, Marilyn Carlson Nelson,<br />
Michael J. Boskin, Henry A. McKinnell, Jr., William R. Howell<br />
Henry A. McKinnell, Jr. . . . Chairman of the Board and<br />
Chief Executive Officer, Pfizer Inc<br />
(pharmaceuticals)<br />
Marilyn Carlson Nelson . . . Chairman and Chief Executive<br />
Officer, Carlson Companies, Inc.<br />
(travel, hotel, restaurant, cruise,<br />
and marketing services)<br />
Lee R. Raymond . . . . . . . . . Chairman and<br />
Chief Executive Officer<br />
Walter V. Shipley . . . . . . . . . Retired Chairman of the Board,<br />
The Chase Manhattan Corporation<br />
and The Chase Manhattan Bank<br />
(banking and finance)<br />
Rex W. Tillerson . . . . . . . . . . President
STANDING COMMITTEES OF THE BOARD<br />
* Required to file reports under Section 16 of the Securities Exchange Act of 1934.<br />
D IRECTORS AND O FFICERS 47<br />
Audit Committee . . . . . . . . . . . . . . . . . . . . . . . . . . . . . . . . . . . . J.R. Houghton (Chair), W.R. Howell, R.C. King, H.A. McKinnell, Jr.<br />
Board Advisory Committee on Contributions . . . . . . . . . . M.C. Nelson (Chair), W.R. Howell, R.C. King, P.E. Lippincott<br />
Board Affairs Committee . . . . . . . . . . . . . . . . . . . . . . . . . . . . . W.V. Shipley (Chair), M.J. Boskin, P.E. Lippincott, H.A. McKinnell, Jr.<br />
Compensation Committee . . . . . . . . . . . . . . . . . . . . . . . . . . . W.R. Howell (Chair), J.R. Houghton, R.C. King, W.V. Shipley<br />
Finance Committee . . . . . . . . . . . . . . . . . . . . . . . . . . . . . . . . . . L.R. Raymond (Chair), M.J. Boskin, J.R. Houghton, P.E. Lippincott, M.C. Nelson<br />
Public Issues Committee. . . . . . . . . . . . . . . . . . . . . . . . . . . . . M.J. Boskin (Chair), H.A. McKinnell, Jr., M.C. Nelson, W.V. Shipley<br />
Executive Committee . . . . . . . . . . . . . . . . . . . . . . . . . . . . . . . . L.R. Raymond (Chair), J.R. Houghton, W.R. Howell, P.E. Lippincott, M.C. Nelson<br />
OFFICERS FUNCTIONAL AND SERVICE ORGANIZATIONS<br />
L.R. Raymond . . . . . . . . . . . Chairman of the Board*<br />
R.W. Tillerson . . . . . . . . . . . President*<br />
E.G. Galante . . . . . . . . . . . . Senior Vice President*<br />
S.R. McGill . . . . . . . . . . . . . . Senior Vice President*<br />
J.S. Simon . . . . . . . . . . . . . . Senior Vice President*<br />
L.J. Cavanaugh . . . . . . . . . Vice President – Human Resources<br />
A.T. Cejka . . . . . . . . . . . . . . . Vice President*<br />
K.P. Cohen . . . . . . . . . . . . . . Vice President – Public Affairs<br />
H.R. Cramer . . . . . . . . . . . . Vice President*<br />
P.J. Dingle . . . . . . . . . . . . . . . Vice President*<br />
M.J. Dolan . . . . . . . . . . . . . . Vice President*<br />
M.E. Foster . . . . . . . . . . . . . Vice President*<br />
H.H. Hubble . . . . . . . . . . . . . Vice President – Investor Relations<br />
and Secretary*<br />
D.D. Humphreys . . . . . . . . . Vice President and Treasurer*<br />
G.L. Kohlenberger . . . . . . . Vice President*<br />
C.W. Matthews . . . . . . . . . . Vice President and General Counsel*<br />
P.T. Mulva . . . . . . . . . . . . . . . Vice President and Controller*<br />
R.D. Nelson . . . . . . . . . . . . . Vice President – Washington Office<br />
S.D. Pryor . . . . . . . . . . . . . . . Vice President*<br />
J.M. Spellings . . . . . . . . . . . General Manager – Corporate Planning<br />
S.K. Stuewer . . . . . . . . . . . . Vice President – Safety, Health<br />
and Environment<br />
P.E. Sullivan . . . . . . . . . . . . . Vice President and General Tax Counsel*<br />
Upstream<br />
A.T. Cejka . . . . . . . . . . President, <strong>ExxonMobil</strong> Exploration Company*<br />
M.W. Albers . . . . . . . . President, <strong>ExxonMobil</strong> Development Company*<br />
M.E. Foster . . . . . . . . . President, <strong>ExxonMobil</strong> Production Company*<br />
P.J. Dingle . . . . . . . . . . President, <strong>ExxonMobil</strong> Gas &<br />
Power Marketing Company*<br />
S.M. Cassiani . . . . . . . President, <strong>ExxonMobil</strong> Upstream Research<br />
Company; President, <strong>ExxonMobil</strong> Upstream<br />
Technical Computing Company<br />
Downstream<br />
S.D. Pryor . . . . . . . . . . President, <strong>ExxonMobil</strong> Refining<br />
& Supply Company*<br />
H.R. Cramer . . . . . . . . President, <strong>ExxonMobil</strong><br />
Fuels Marketing Company*<br />
G.L. Kohlenberger . . . President, <strong>ExxonMobil</strong> Lubricants<br />
& Petroleum Specialties Company*<br />
W.R.K. Innes . . . . . . . . President, <strong>ExxonMobil</strong> Research<br />
and Engineering Company<br />
Chemical<br />
M.J. Dolan . . . . . . . . . . President, <strong>ExxonMobil</strong> Chemical Company*<br />
Other<br />
T.J. Hearn . . . . . . . . . . Chairman of the Board, Imperial Oil Limited<br />
S.J. Glass, Jr. . . . . . . . President, <strong>ExxonMobil</strong> Global Services<br />
Company<br />
EXXON MOBIL CORPORATION • <strong>2004</strong> SUMMARY ANNUAL REPORT
48<br />
Investor Information<br />
<strong>ExxonMobil</strong> offers its shareholders a wide<br />
range of services and several ways to access<br />
important company information.<br />
SHAREHOLDER SERVICES<br />
Shareholder inquiries should be addressed to <strong>ExxonMobil</strong><br />
Shareholder Services at EquiServe Trust Company, N.A.,<br />
<strong>ExxonMobil</strong>’s transfer agent:<br />
<strong>ExxonMobil</strong> Shareholder Services<br />
P.O. Box 43008<br />
Providence, RI 02940-3008<br />
1-800-252-1800<br />
(Within the continental U.S. and Canada)<br />
1-781-575-2058<br />
(Outside the continental U.S. and Canada)<br />
An automated voice-response system is available 24 hours<br />
a day, 7 days a week. Service representatives are available<br />
during normal business hours.<br />
Registered shareholders can access information about<br />
their <strong>ExxonMobil</strong> stock accounts via the Internet at<br />
www.exxonmobil.equiserve.com.<br />
STOCK PURCHASE AND DIVIDEND REINVESTMENT PLAN<br />
EquiServe Trust Company, N.A. sponsors a stock purchase<br />
and dividend reinvestment plan, the EquiServe Investment<br />
Plan for Exxon Mobil Corporation Common Stock, in which<br />
participants can purchase <strong>ExxonMobil</strong> stock and reinvest<br />
dividends without contacting a broker. You do not have to<br />
be a shareholder to enroll. For more information and plan<br />
materials, go to www.exxonmobil.equiserve.com and<br />
select Shareholder Services or call or write <strong>ExxonMobil</strong><br />
Shareholder Services.<br />
DIVIDEND DIRECT DEPOSIT<br />
Shareholders may have their dividends deposited directly<br />
into their bank accounts. If you’d like to elect this option,<br />
go to www.exxonmobil.equiserve.com or call or write<br />
<strong>ExxonMobil</strong> Shareholder Services for an authorization form.<br />
ELECTRONIC DELIVERY OF DOCUMENTS<br />
Registered shareholders can receive the following<br />
online, instead of by mail:<br />
■ <strong>Summary</strong> <strong>Annual</strong> <strong>Report</strong><br />
■ Proxy Statement<br />
■ Tax Documents<br />
■ Dividend Reinvestment Statements<br />
EXXON MOBIL CORPORATION • <strong>2004</strong> SUMMARY ANNUAL REPORT<br />
EXXONMOBIL ON THE INTERNET<br />
A Quick, Easy Way to Get Information About <strong>ExxonMobil</strong><br />
<strong>ExxonMobil</strong> publications and important shareholder<br />
information are available on the Internet at:<br />
www.exxonmobil.com<br />
■ Shareholder Publications<br />
■ Current Stock Price<br />
■ Dividend Information<br />
■ Contact Information<br />
■ Stock Purchase and Dividend Reinvestment Plan<br />
■ Press Releases<br />
■ Management Presentations<br />
■ Economic and Energy Outlook<br />
■ Corporate Governance Guidelines<br />
EXXONMOBIL PUBLICATIONS<br />
The publications listed below, all of which can be found on<br />
the Internet at www.exxonmobil.com, are available without<br />
charge to shareholders. Requests for printed copies should<br />
be directed to <strong>ExxonMobil</strong> Shareholder Services.<br />
■ <strong>2004</strong> <strong>Summary</strong> <strong>Annual</strong> <strong>Report</strong><br />
■ <strong>2004</strong> <strong>Annual</strong> <strong>Report</strong> on Form 10-K<br />
■ <strong>2004</strong> Financial and Operating Review, a report on<br />
<strong>ExxonMobil</strong>’s businesses, strategies, and results<br />
■ <strong>2004</strong> Corporate Citizenship <strong>Report</strong><br />
■ The Lamp, a quarterly shareholder magazine with news<br />
and features about <strong>ExxonMobil</strong>’s worldwide activities<br />
■ A <strong>Report</strong> of Energy Trends, Greenhouse Gas Emissions<br />
and Alternative Energy<br />
DUPLICATE ANNUAL REPORTS<br />
Shareholders may eliminate duplicate report mailings by<br />
marking their proxy card, or by writing or calling <strong>ExxonMobil</strong><br />
Shareholder Services.<br />
CORPORATE GOVERNANCE<br />
Our Corporate Governance Guidelines are available<br />
by selecting Investor Information on our website at<br />
www.exxonmobil.com.<br />
EXECUTIVE CERTIFICATIONS<br />
<strong>ExxonMobil</strong> has included as Exhibit 31 to its <strong>2004</strong> <strong>Annual</strong> <strong>Report</strong><br />
on Form 10-K filed with the Securities and Exchange Commission<br />
certificates of the chief executive officer, principal accounting<br />
officer, and principal financial officer of the Company regarding<br />
the quality of the Company’s public disclosure. The Company has<br />
also submitted to the New York Stock Exchange (NYSE) a certificate<br />
of the CEO certifying that he is not aware of any violation by<br />
the Company of NYSE corporate governance listing standards.
WHETSTONE DESIGN LAB / RBMM ©2005 EXXON MOBIL CORPORATION PRINTED IN U.S.A.<br />
General Information<br />
Corporate Headquarters<br />
Exxon Mobil Corporation<br />
5959 Las Colinas Boulevard<br />
Irving, TX 75039-2298<br />
Additional copies may be<br />
obtained by writing or phoning:<br />
Phone: 972-444-1000<br />
Fax: 972-444-1505<br />
Shareholder Relations<br />
Exxon Mobil Corporation<br />
P.O. Box 140369<br />
Irving, TX 75014-0369<br />
Market Information<br />
The New York Stock Exchange is the principal exchange<br />
on which Exxon Mobil Corporation common stock<br />
(symbol XOM) is traded.<br />
<strong>Annual</strong> Meeting<br />
The 2005 <strong>Annual</strong> Meeting of Shareholders will be held<br />
at 9:00 a.m. Central Time on Wednesday, May 25, at:<br />
The Morton H. Meyerson Symphony Center<br />
2301 Flora Street<br />
Dallas, Texas 75201<br />
The meeting will be audiocast live on the Internet.<br />
Instructions for listening to this audiocast will be<br />
available on the Internet at www.exxonmobil.com<br />
approximately one week prior to the event.<br />
Included in this <strong>Summary</strong> <strong>Annual</strong> <strong>Report</strong> are financial and operating highlights and summary financial statements. For complete financial statements, including notes,<br />
please refer to the Proxy Statement for <strong>ExxonMobil</strong>’s 2005 <strong>Annual</strong> Meeting. The Proxy Statement also includes management’s discussion and analysis of financial<br />
condition and results of operations. The <strong>ExxonMobil</strong> website, www.exxonmobil.com, contains the Proxy Statement and other company publications, including<br />
<strong>ExxonMobil</strong>’s Financial and Operating Review, which provides additional detail about the Company’s global operations.<br />
Exxon Mobil Corporation has numerous affiliates, many with names that include <strong>ExxonMobil</strong>, Exxon, Mobil, and Esso. For convenience and simplicity, those terms and<br />
terms such as Corporation, company, our, we, and its are sometimes used as abbreviated references to specific affiliates or affiliate groups. Abbreviated references<br />
describing global or regional operational organizations, and global or regional business lines are also sometimes used for convenience and simplicity. Similarly, <strong>ExxonMobil</strong><br />
has business relationships with thousands of customers, suppliers, governments, and others. For convenience and simplicity, words such as venture, joint venture,<br />
partnership, co-venturer, and partner are used to indicate business relationships involving common activities and interests, and those words may not indicate precise<br />
legal relationships. The following are trademarks, service marks, or proprietary process names of Exxon Mobil Corporation or one of its subsidiaries: Esso, Exxon,<br />
Exxpol, Mobil, Mobil 1, MSDW-2, On the Run, and Speedpass. Aston Martin, Bentley, BMW, Cadillac, Chrysler, Corvette, Dodge, Doutor, Innscor, McLaren, Mercedes,<br />
NASCAR, Nebula-20, Porsche, Saab, 7-Eleven, Tesco, Tim Hortons, Toyota, Upromise, and West are trademarks of third-party companies.
5959 Las Colinas Boulevard<br />
Irving, Texas 75039-2298<br />
www.exxonmobil.com<br />
Printed entirely on recycled paper<br />
3300-AR-05