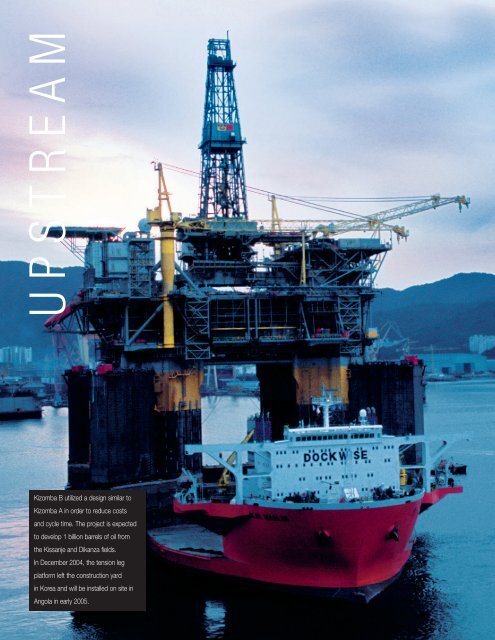
UPSTREAM Kizomba B utilized a design similar to Kizomba A in order to reduce costs and cycle time. The project is expected to develop 1 billion barrels of oil from the Kissanje and Dikanza fields. In December <strong>2004</strong>, the tension leg platform left the construction yard in Korea and will be installed on site in Angola in early 2005.
Consistency is key to leading results. <strong>ExxonMobil</strong>’s Upstream sets benchmarks as an industry leader in project execution and operating performance. Exploration, Development, Production, and Gas & Power Marketing <strong>2004</strong> RESULTS AND HIGHLIGHTS Earnings were $16.7 billion, up 15 percent and a record, primarily due to strong oil and natural gas prices. Upstream return on average capital employed was 33 percent in <strong>2004</strong> and averaged 29 percent over the past five years. Net income per oil-equivalent barrel was $10.81. Total liquids and gas production available for sale was 4.2 million oil-equivalent barrels per day, exceeding all competitors. Strong liquids production growth of 2.2 percent was offset by lower gas production, which declined 2.5 percent. Proved oil and gas reserve additions totaled 1.8 billion oil-equivalent barrels, excluding asset sales and year-end price/cost revisions. The Corporation replaced 112 percent of production including asset sales, and 125 percent excluding asset sales. This is the 11th year in a row that <strong>ExxonMobil</strong> has more than replaced reserves produced. At 22 billion oil-equivalent barrels, <strong>ExxonMobil</strong>’s proved reserves are the highest among nongovernmental producers. New field resource additions totaled 2.9 billion oil-equivalent barrels in <strong>2004</strong>. <strong>ExxonMobil</strong>’s resource base now stands at 73 billion oil-equivalent barrels. Finding costs were $0.44 per oil-equivalent barrel. Upstream capital and exploration spending remained robust at $11.7 billion, driven by a strong portfolio of development projects. U PSTREAM RETURN ON AVERAGE CAPITAL EMPLOYED <strong>ExxonMobil</strong> Integrated Oil Competitor Average (percent) (1) 35 30 25 20 15 10 5 0 U PSTREAM NET INCOME PER BARREL <strong>ExxonMobil</strong> Integrated Oil Competitor Average (dollars per oil-equivalent barrel) (1) 12 10 8 6 4 2 0 2000 2001 2002 2003 <strong>2004</strong> 2000 2001 2002 2003 <strong>2004</strong> (1) Royal Dutch Shell, BP, and ChevronTexaco values calculated on a consistent basis with <strong>ExxonMobil</strong>, based on public information. Competitor data estimated for <strong>2004</strong>. STATISTICAL RECAP <strong>2004</strong> 2003 2002 2001 2000 Earnings (millions of dollars) 16,675 14,502 9,598 10,736 12,685 Liquids production (thousands of barrels per day) 2,571 2,516 2,496 2,542 2,553 Natural gas production available for sale (millions of cubic feet per day) 9,864 10,119 10,452 10,279 10,343 Oil-equivalent production (thousands of barrels per day) 4,215 4,203 4,238 4,255 4,277 Proved reserves replacement (1) (percent) 125 107 118 111 112 New field resource additions (millions of oil-equivalent barrels) 2,940 2,110 2,150 2,490 2,120 Average capital employed (millions of dollars) 50,642 47,672 43,064 40,029 41,218 Return on average capital employed (percent) 32.9 30.4 22.3 26.8 30.8 Capital and exploration expenditures (millions of dollars) 11,715 11,988 10,394 8,816 6,933 (1) Excluding asset sales and year-end price/cost revisions. EXXON MOBIL CORPORATION • <strong>2004</strong> SUMMARY ANNUAL REPORT 9