2004 Summary Annual Report - ExxonMobil
2004 Summary Annual Report - ExxonMobil
2004 Summary Annual Report - ExxonMobil

Create successful ePaper yourself
Turn your PDF publications into a flip-book with our unique Google optimized e-Paper software.
Technology differentiates <strong>ExxonMobil</strong> Chemical.<br />
Concentration on our core competencies, as well as selective<br />
investment, produces growth and results that set us apart.<br />
Chemical<br />
<strong>2004</strong> RESULTS AND HIGHLIGHTS<br />
<strong>2004</strong> earnings of $3.4 billion set a record – more than<br />
double those in 2003. Our unique mix of businesses,<br />
broad geographic coverage, and feedstock and integration<br />
advantages ideally positioned <strong>ExxonMobil</strong> to capitalize on<br />
an improved industry environment.<br />
Chemical return on average capital employed reached<br />
23 percent, up from 10 percent in 2003. <strong>ExxonMobil</strong>’s<br />
Chemical returns exceeded the average returns of our major<br />
chemical competitors. Over the last 10 years, our Chemical<br />
segment achieved an average return of 14 percent. During<br />
the same period, we estimate our competitors’ average<br />
return to have been 8 percent.<br />
<strong>2004</strong> prime product sales volume of 27.8 million tons<br />
was a record – 5 percent higher than in 2003. Growth in all<br />
regions was achieved by higher utilization of existing assets,<br />
supported by strong reliability and global supply optimization.<br />
Capital expenditures were $0.7 billion. The Company<br />
continued to invest selectively in high-return efficiency<br />
projects, low-cost debottlenecks, and projects to support<br />
the growth of our specialty businesses.<br />
Capacity is more than 40 percent higher than the<br />
last chemical cycle peak in 1995. Recent advantagedcapacity<br />
additions in Saudi Arabia and Singapore are<br />
contributing significantly to earnings growth. We are<br />
particularly well-positioned to continue to meet growing<br />
demand in Asia, which has been led by an expanding<br />
Chinese economy.<br />
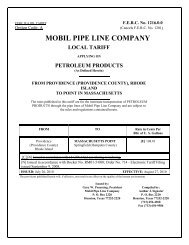
C HEMICAL OUTPERFORMED COMPETITION<br />
A CROSS THE BUSINESS CYCLE<br />
Return on Average Capital Employed<br />
<strong>ExxonMobil</strong><br />
(percent)<br />
Major Chemical Competitors (1)<br />
STATISTICAL RECAP <strong>2004</strong> 2003 2002 2001 2000<br />
Earnings (1) (millions of dollars) 3,428 1,432 830 882 1,161<br />
Prime product sales (2) (thousands of metric tons) 27,788 26,567 26,606 25,780 25,637<br />
Average capital employed (millions of dollars) 14,608 14,099 13,645 13,839 13,814<br />
Return on average capital employed (percent) 23.5 10.2 6.1 6.4 8.4<br />
Capital expenditures (millions of dollars) 690 692 954 872 1,468<br />
(1) Earnings included a $175 million extraordinary gain on asset divestitures in 2001.<br />
(2) Prime product sales include <strong>ExxonMobil</strong>’s share of equity-company volumes and finished-product transfers to the Downstream. Carbon-black oil volumes are excluded.<br />
35<br />
30<br />
25<br />
20<br />
15<br />
10<br />
5<br />
0<br />
1995<br />
1996<br />
1997<br />
1998<br />
1999<br />
2000<br />
2001<br />
2002<br />
2003<br />
<strong>2004</strong><br />
(1) Chemical competitor values calculated on a consistent basis with <strong>ExxonMobil</strong>,<br />
based on public information. Competitor information estimated for <strong>2004</strong>.<br />
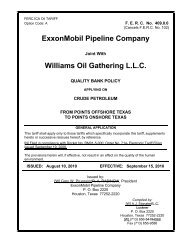
B USINESS MIX ENHANCES PROFITABILITY<br />
Segment Earnings<br />
Specialties Commodities<br />
(billions of dollars)<br />
3.5<br />
3.0<br />
2.5<br />
2.0<br />
1.5<br />
1.0<br />
0.5<br />
0<br />
1995<br />
1996<br />
1997<br />
1998<br />
1999<br />
2000<br />
2001<br />
2002<br />
2003<br />
<strong>2004</strong><br />
EXXON MOBIL CORPORATION • <strong>2004</strong> SUMMARY ANNUAL REPORT<br />
27