2004 Summary Annual Report - ExxonMobil
2004 Summary Annual Report - ExxonMobil
2004 Summary Annual Report - ExxonMobil

Create successful ePaper yourself
Turn your PDF publications into a flip-book with our unique Google optimized e-Paper software.
F REQUENTLY U SED T ERMS 45<br />
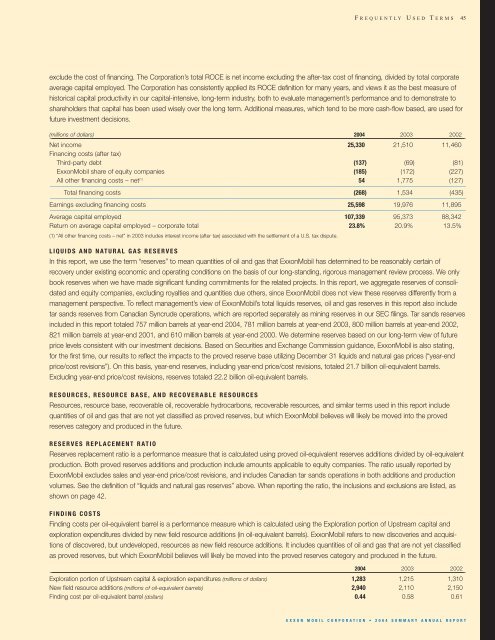
exclude the cost of financing. The Corporation’s total ROCE is net income excluding the after-tax cost of financing, divided by total corporate<br />
average capital employed. The Corporation has consistently applied its ROCE definition for many years, and views it as the best measure of<br />
historical capital productivity in our capital-intensive, long-term industry, both to evaluate management’s performance and to demonstrate to<br />
shareholders that capital has been used wisely over the long term. Additional measures, which tend to be more cash-flow based, are used for<br />
future investment decisions.<br />
(millions of dollars) <strong>2004</strong> 2003 2002<br />
_<br />
Net income 25,330 21,510 11,460<br />
Financing costs (after tax)<br />
Third-party debt (137) (69) (81)<br />
<strong>ExxonMobil</strong> share of equity companies (185) (172) (227)<br />
All other financing costs – net (1) 54 1,775 (127)<br />
__________________________________________________________________________________________________________________________________________________________________________________________________________________________________________________________________________________________________________________________________________________________________________________________________________________________________________________________________________________________________________________________________<br />
Total financing costs (268) 1,534 (435)<br />
__________________________________________________________________________________________________________________________________________________________________________________________________________________________________________________________________________________________________________________________________________________________________________________________________________________________________________________________________________________________________________________________________<br />
Earnings excluding financing costs 25,598 19,976 11,895<br />
__________________________________________________________________________________________________________________________________________________________________________________________________________________________________________________________________________________________________________________________________________________________________________________________________________________________________________________________________________________________________________________________________<br />
Average capital employed 107,339 95,373 88,342<br />
Return on average capital employed – corporate total 23.8% 20.9% 13.5%<br />
(1) “All other financing costs – net” in 2003 includes interest income (after tax) associated with the settlement of a U.S. tax dispute.<br />
LIQUIDS AND NATURAL GAS RESERVES<br />
In this report, we use the term “reserves” to mean quantities of oil and gas that <strong>ExxonMobil</strong> has determined to be reasonably certain of<br />
recovery under existing economic and operating conditions on the basis of our long-standing, rigorous management review process. We only<br />
book reserves when we have made significant funding commitments for the related projects. In this report, we aggregate reserves of consolidated<br />
and equity companies, excluding royalties and quantities due others, since <strong>ExxonMobil</strong> does not view these reserves differently from a<br />
management perspective. To reflect management’s view of <strong>ExxonMobil</strong>’s total liquids reserves, oil and gas reserves in this report also include<br />
tar sands reserves from Canadian Syncrude operations, which are reported separately as mining reserves in our SEC filings. Tar sands reserves<br />
included in this report totaled 757 million barrels at year-end <strong>2004</strong>, 781 million barrels at year-end 2003, 800 million barrels at year-end 2002,<br />
821 million barrels at year-end 2001, and 610 million barrels at year-end 2000. We determine reserves based on our long-term view of future<br />
price levels consistent with our investment decisions. Based on Securities and Exchange Commission guidance, <strong>ExxonMobil</strong> is also stating,<br />
for the first time, our results to reflect the impacts to the proved reserve base utilizing December 31 liquids and natural gas prices (“year-end<br />
price/cost revisions”). On this basis, year-end reserves, including year-end price/cost revisions, totaled 21.7 billion oil-equivalent barrels.<br />
Excluding year-end price/cost revisions, reserves totaled 22.2 billion oil-equivalent barrels.<br />
RESOURCES, RESOURCE BASE, AND RECOVERABLE RESOURCES<br />
Resources, resource base, recoverable oil, recoverable hydrocarbons, recoverable resources, and similar terms used in this report include<br />
quantities of oil and gas that are not yet classified as proved reserves, but which <strong>ExxonMobil</strong> believes will likely be moved into the proved<br />
reserves category and produced in the future.<br />
RESERVES REPLACEMENT RATIO<br />
Reserves replacement ratio is a performance measure that is calculated using proved oil-equivalent reserves additions divided by oil-equivalent<br />
production. Both proved reserves additions and production include amounts applicable to equity companies. The ratio usually reported by<br />
<strong>ExxonMobil</strong> excludes sales and year-end price/cost revisions, and includes Canadian tar sands operations in both additions and production<br />
volumes. See the definition of “liquids and natural gas reserves” above. When reporting the ratio, the inclusions and exclusions are listed, as<br />
shown on page 42.<br />
FINDING COSTS<br />
Finding costs per oil-equivalent barrel is a performance measure which is calculated using the Exploration portion of Upstream capital and<br />
exploration expenditures divided by new field resource additions (in oil-equivalent barrels). <strong>ExxonMobil</strong> refers to new discoveries and acquisitions<br />
of discovered, but undeveloped, resources as new field resource additions. It includes quantities of oil and gas that are not yet classified<br />
as proved reserves, but which <strong>ExxonMobil</strong> believes will likely be moved into the proved reserves category and produced in the future.<br />
<strong>2004</strong> 2003 2002<br />
_<br />
Exploration portion of Upstream capital & exploration expenditures (millions of dollars) 1,283 1,215 1,310<br />
New field resource additions (millions of oil-equivalent barrels) 2,940 2,110 2,150<br />
Finding cost per oil-equivalent barrel (dollars) 0.44 0.58 0.61<br />
EXXON MOBIL CORPORATION • <strong>2004</strong> SUMMARY ANNUAL REPORT