2004 Summary Annual Report - ExxonMobil
2004 Summary Annual Report - ExxonMobil
2004 Summary Annual Report - ExxonMobil

Create successful ePaper yourself
Turn your PDF publications into a flip-book with our unique Google optimized e-Paper software.
42<br />
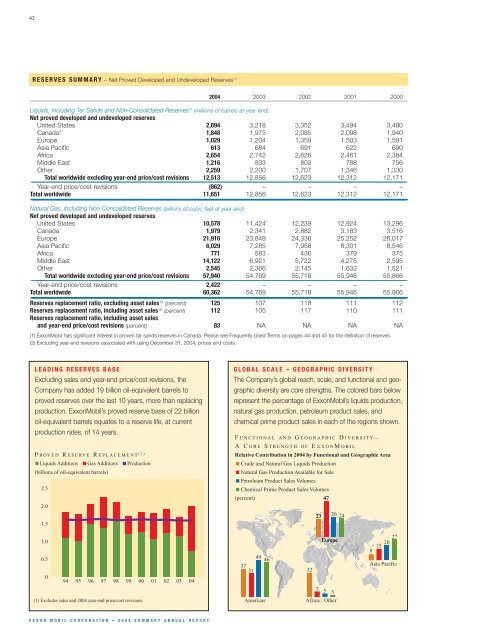
RESERVES SUMMARY – Net Proved Developed and Undeveloped Reserves (1)<br />
<strong>2004</strong> 2003 2002 2001 2000<br />
___________________________________________________________________________________________________________________________________________________________________________________________________________________________________________________________________________________________________________________________________________________________________________________________________________________________________________________________________________________<br />
Liquids, Including Tar Sands and Non-Consolidated Reserves (1) (millions of barrels at year end)<br />
Net proved developed and undeveloped reserves<br />
United States 2,894 3,218 3,352 3,494 3,480<br />
Canada (1) 1,848 1,975 2,085 2,098 1,940<br />
Europe 1,029 1,204 1,359 1,503 1,591<br />
Asia Pacific 613 684 691 622 690<br />
Africa 2,654 2,742 2,626 2,461 2,384<br />
Middle East 1,216 833 803 788 756<br />
Other 2,259 2,200 1,707 1,346 1,330<br />
Total worldwide excluding year-end price/cost revisions 12,513 12,856 12,623 12,312 12,171<br />
_<br />
Year-end price/cost revisions (862) – – – –<br />
Total worldwide 11,651 12,856 12,623 12,312 12,171<br />
_<br />
Natural Gas, Including Non-Consolidated Reserves (billions of cubic feet at year end)<br />
Net proved developed and undeveloped reserves<br />
United States 10,578 11,424 12,239 12,924 13,296<br />
Canada 1,979 2,341 2,882 3,183 3,516<br />
Europe 21,916 23,849 24,336 25,252 26,017<br />
Asia Pacific 6,029 7,285 7,958 8,301 8,546<br />
Africa 771 583 436 379 375<br />
Middle East 14,122 6,921 5,722 4,275 2,595<br />
Other 2,545 2,366 2,145 1,632 1,521<br />
Total worldwide excluding year-end price/cost revisions 57,940 54,769 55,718 55,946 55,866<br />
_<br />
Year-end price/cost revisions 2,422 – – – –<br />
Total worldwide 60,362 54,769 55,718 55,946 55,866<br />
_<br />
Reserves replacement ratio, excluding asset sales (2) (percent) 125 107 118 111 112<br />
Reserves replacement ratio, including asset sales (2) (percent) 112 105 117 110 111<br />
Reserves replacement ratio, including asset sales<br />
and year-end price/cost revisions (percent) 83 NA NA NA NA<br />
(1) <strong>ExxonMobil</strong> has significant interest in proven tar sands reserves in Canada. Please see Frequently Used Terms on pages 44 and 45 for the definition of reserves.<br />
(2) Excluding year-end revisions associated with using December 31, <strong>2004</strong>, prices and costs.<br />
LEADING RESERVES BASE<br />
Excluding sales and year-end price/cost revisions, the<br />
Company has added 19 billion oil-equivalent barrels to<br />
proved reserves over the last 10 years, more than replacing<br />
production. <strong>ExxonMobil</strong>’s proved reserve base of 22 billion<br />
oil-equivalent barrels equates to a reserve life, at current<br />
production rates, of 14 years.<br />
P ROVED RESERVE REPLACEMENT (1)<br />
Liquids Additions Gas Additions Production<br />
(billions of oil-equivalent barrels)<br />
2.5<br />
2.0<br />
1.5<br />
1.0<br />
0.5<br />
0<br />
94<br />
95<br />
96<br />
(1) Excludes sales and <strong>2004</strong> year-end price/cost revisions.<br />
97<br />
98<br />
EXXON MOBIL CORPORATION • <strong>2004</strong> SUMMARY ANNUAL REPORT<br />
99<br />
00<br />
01<br />
02<br />
03<br />
04<br />
GLOBAL SCALE – GEOGRAPHIC DIVERSITY<br />
The Company’s global reach, scale, and functional and geographic<br />
diversity are core strengths. The colored bars below<br />
represent the percentage of <strong>ExxonMobil</strong>’s liquids production,<br />
natural gas production, petroleum product sales, and<br />
chemical prime product sales in each of the regions shown.<br />
F UNCTIONAL AND GEOGRAPHIC DIVERSITY—<br />
A CORE STRENGTH OF EXXONM OBIL<br />
Relative Contribution in <strong>2004</strong> by Functional and Geographic Area<br />
Crude and Natural Gas Liquids Production<br />
Natural Gas Production Available for Sale<br />
Petroleum Product Sales Volumes<br />
Chemical Prime Product Sales Volumes<br />
(percent)<br />
37 31<br />
49 46<br />
Americas<br />
32<br />
23<br />
47<br />
Europe<br />
7 5 3<br />
Africa / Other<br />
26 24<br />
27<br />
20<br />
15<br />
8<br />
Asia Pacific