Poverty & Inequalities Profile - Falkirk 2010 - Falkirk Council
Poverty & Inequalities Profile - Falkirk 2010 - Falkirk Council
Poverty & Inequalities Profile - Falkirk 2010 - Falkirk Council

You also want an ePaper? Increase the reach of your titles
YUMPU automatically turns print PDFs into web optimized ePapers that Google loves.
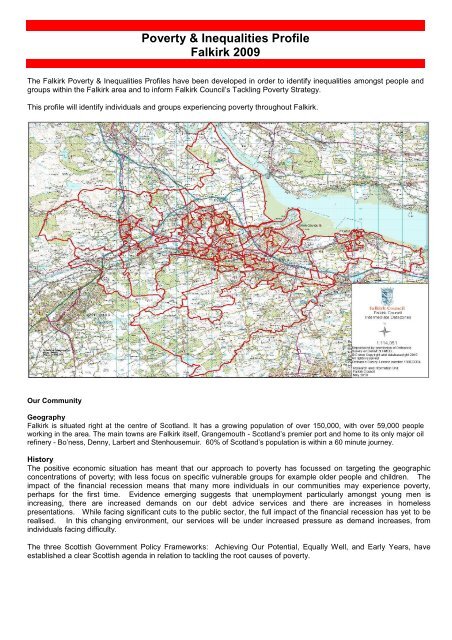
<strong>Poverty</strong> & <strong>Inequalities</strong> <strong>Profile</strong><br />
<strong>Falkirk</strong> 2009<br />
The <strong>Falkirk</strong> <strong>Poverty</strong> & <strong>Inequalities</strong> <strong>Profile</strong>s have been developed in order to identify inequalities amongst people and<br />
groups within the <strong>Falkirk</strong> area and to inform <strong>Falkirk</strong> <strong>Council</strong>’s Tackling <strong>Poverty</strong> Strategy.<br />
This profile will identify individuals and groups experiencing poverty throughout <strong>Falkirk</strong>.<br />
Our Community<br />
Geography<br />
<strong>Falkirk</strong> is situated right at the centre of Scotland. It has a growing population of over 150,000, with over 59,000 people<br />
working in the area. The main towns are <strong>Falkirk</strong> itself, Grangemouth - Scotland’s premier port and home to its only major oil<br />
refinery - Bo’ness, Denny, Larbert and Stenhousemuir. 60% of Scotland’s population is within a 60 minute journey.<br />
History<br />
The positive economic situation has meant that our approach to poverty has focussed on targeting the geographic<br />
concentrations of poverty; with less focus on specific vulnerable groups for example older people and children. The<br />
impact of the financial recession means that many more individuals in our communities may experience poverty,<br />
perhaps for the first time. Evidence emerging suggests that unemployment particularly amongst young men is<br />
increasing, there are increased demands on our debt advice services and there are increases in homeless<br />
presentations. While facing significant cuts to the public sector, the full impact of the financial recession has yet to be<br />
realised. In this changing environment, our services will be under increased pressure as demand increases, from<br />
individuals facing difficulty.<br />
The three Scottish Government Policy Frameworks: Achieving Our Potential, Equally Well, and Early Years, have<br />
established a clear Scottish agenda in relation to tackling the root causes of poverty.
<strong>Poverty</strong> & <strong>Inequalities</strong> <strong>Profile</strong><br />
<strong>Falkirk</strong> 2009<br />
Indicator <strong>Falkirk</strong> Scotland<br />
Earnings<br />
Average Weekly Earning £463 £472<br />
Average Weekly Earnings - Male £514 *<br />
Average Weekly Earnings - Female £400 *<br />
% of Population experiencing Income Deprivation 2008 14.0 14.0<br />
% of Population experiencing Employment Deprivation 2008 12.0 12.0<br />
Benefits<br />
Working Age Benefit: Claimant Rate (working age population) 17.6% 17.6%<br />
Job Seekers Allowance Claimant Rate (working age population) 4.3% 3.9%<br />
Income Support Claimant Rate (working age population) 5.1% 5.8%<br />
Pension Credit Claimant Rate (pensionable age population) 27.1% 28.0%<br />
IB/SDA Claimant Rate (population aged 16+) 5.8% 5.%<br />
Disability Living Allowance (total population) 6.8% 6.6%<br />
Carer’s Allowance (total population) 1.0% 0.9%<br />
% of Households in <strong>Falkirk</strong> receiving Housing Benefit 21.9% *<br />
% of Households in <strong>Falkirk</strong> receiving <strong>Council</strong> Tax Benefit 23.5%<br />
Housing & Households<br />
Average House Price £112,500<br />
Housing Tenure – Owner Occupied 67.4%<br />
Housing Affordability – Lower Quartile Earnings/Price Ratio 4.62 *<br />
Number of Homelessness Applications 2651 *<br />
% of homelessness applicants aged under 25 39% 37%<br />
Debt<br />
Total amount of debt dealt with by Debt Advice Services & CABx £169.3m *<br />
% of total debt as Mortgage 43.8%<br />
% of total debt as Mortgage or Rent Arrears 3.7%<br />
% of total debt as Loans & Credit Cards 39.3%<br />
Children & Young People<br />
% First time mothers aged
<strong>Poverty</strong> & <strong>Inequalities</strong> <strong>Profile</strong><br />
<strong>Falkirk</strong> 2009<br />
Our Community Population<br />
The tables below provide details of <strong>Falkirk</strong>’s population in terms of age groups. Table 1 shows the age structure of<br />
<strong>Falkirk</strong>’s population in comparison to Scotland, which is similar to Scotland’s population. The population of the <strong>Falkirk</strong><br />
<strong>Council</strong> area has been growing since mid 1990’s, up 6.1% since 1994 to 152,480 in 2009. This increase will continue,<br />
the latest projections showing 157,600 by 2015 an increase of 3.3%. In 2020 the population is anticipated to increase<br />
by 6.2% up to 162,000. These increases will impact on all services bringing greater demands for service.<br />
Table 1: Population Estimates 2009<br />
Males Females<br />
Age Group <strong>Falkirk</strong> % Scotland % <strong>Falkirk</strong> % Scotland %<br />
Aged 0-15 14,330 19.4% 467,017 18.6% 13,829 17.6% 445,323 16.8%<br />
Working Age 49,014 66.3% 1,679,890 66.8% 45,841 58.3% 1,568,925 58.6%<br />
Pensionable Age 10,563 14.3% 368,381 14.6% 18,903 24.1% 664,464 24.8%<br />
Total 73,907 100.0% 2,515,288 100.0% 78,573 100.0% 2,678,712 100%<br />
Source GROS 2009 Mid Year Estimates<br />
An aging population is an issue that will affect <strong>Falkirk</strong>, Scotland, UK and Europe. The number of people aged over 65<br />
will increase by almost 3,900 by 2015, by 6,700 by 2020 and by almost 17,000 by 2033. For the very elderly, aged 85+,<br />
there will be an increase of 15% by 2015, 42% by 2020 and 157% by 2033.<br />
This will have a significant impact on demand for services with a consequent financial impact especially for Social Work<br />
and health services.<br />
Ethnicity<br />
The number of people in the <strong>Falkirk</strong> <strong>Council</strong> area population from an ethnic minority is very small – only 1,491 people<br />
in the 2001 Census which is the only reliable source. This represents 1% of the total population and is about half the<br />
Scottish total of 2%. 8.7% of the England & Wales’s population is of ethnic minority origin. Within Scotland, 5.5% of<br />
Glasgow’s population was from an ethnic minority and 4% of Edinburgh’s population.<br />
This does not mean that ethnicity is not an issue in our communities; our ethnic minority populations may be more<br />
isolated. It also means that it is difficult to obtain accurate statistical information on the impact of any discrimination<br />
they experience, for example in relation to educational attainment, income levels or employment status.<br />
The largest ethnic community in <strong>Falkirk</strong> is the Pakistani population which makes up 48% of the total. This followed<br />
by the mixed, Chinese and Indian populations.<br />
Migrant Workers<br />
Information on the numbers of immigrants is not comprehensive. The most inclusive survey is the Census, however,<br />
the last Census was carried out in 2001 and this predates the accession of the A8 states. Research has found that<br />
most migrant workers from the A8 nations only intend to stay for less than a year. It is therefore difficult to ascertain<br />
accurate figures.<br />
Table 2: Number NiNo Registrations<br />
<strong>Falkirk</strong> Forth Valley Scotland UK<br />
2002/03 140 380 14,750 343,230<br />
2003/04 140 410 15,980 373,500<br />
2004/05 180 540 23,400 435,350<br />
2005/06 460 1,300 41,410 663,060<br />
2006/07 610 1,620 51,880 705,840<br />
2007/08 560 15,60 52,410 733,090<br />
2008/09 440 1,360 4,624 686,110<br />
Total 2,530 5,610 204,454 3,940,180<br />
Source: Department for Work & Pensions<br />
National Insurance Number applications provide<br />
details on the numbers of overseas nationals<br />
intending to work in the UK. This captures those<br />
who seek employment, are self-employed and<br />
students who work part-time. However, records<br />
are not kept on those who leave the UK.<br />
Table 2 shows the number of migrant workers<br />
who have registered for a National Insurance<br />
Number in the <strong>Falkirk</strong> area in the last few years,<br />
together with comparative information for the<br />
Forth Valley area, Scotland and the UK.<br />
The average migrant worker in <strong>Falkirk</strong> is male, aged between 18-34, works 35-40 hours per week. 70% earn between<br />
£4.50-£5.99 per hour. This shows that most migrant workers are on the minimum wage, which is currently £5.73 per<br />
hour for adults aged 22+ and £4.77 for those aged 18-21.They are likely to work in Sector Based Training Schemes,<br />
transport, manufacturing, hospitality & catering or administration & business services. 53% of migrant workers intend<br />
to stay for a period of 3 months or less.
Income<br />
<strong>Poverty</strong> & <strong>Inequalities</strong> <strong>Profile</strong><br />
<strong>Falkirk</strong> 2009<br />
Figure 1: Median Weekly Earning Figure 2: Weekly Earnings by Gender, <strong>Falkirk</strong><br />
Gross Weekly Earnings<br />
600<br />
500<br />
400<br />
300<br />
200<br />
100<br />
0<br />
2002<br />
2003<br />
2004<br />
2005<br />
2006<br />
Year<br />
2007<br />
2008<br />
2009<br />
Source: Nomis Annual Survey of Hours and Earnings<br />
UK<br />
Scotland<br />
<strong>Falkirk</strong><br />
The average weekly earnings have been increasing steadily over the past 7 years.<br />
Weekly Earnings<br />
600.0<br />
500.0<br />
400.0<br />
300.0<br />
200.0<br />
100.0<br />
0.0<br />
2002 2003 2004 2005 2006 2007 2008 2009<br />
Figure 1 shows that the average weekly earnings of those living in <strong>Falkirk</strong> were £463 in 2009. This was slightly below<br />
the equivalent figure for Scotland (£472) and further below the UK average of £489. These figures are for earnings of<br />
those who are living in the area.<br />
When looking at the earnings of those working in <strong>Falkirk</strong>, the figure is lower. The average for <strong>Falkirk</strong> is £460<br />
compared to Scotland £474. This suggests that many residents commute to higher paying jobs located outwith<br />
<strong>Falkirk</strong>.<br />
Figure 2 illustrates how the median weekly pay of both males and females has increased year on year since 2002.<br />
The weekly female pay level was £311 in 2002 (75% of the male figure). In 2008 the female figure reached £400<br />
(78% of the weekly pay for males). This would appear to suggest that the gender gap is narrowing in terms of median<br />
pay levels in <strong>Falkirk</strong> but significant room for progress remains.<br />
Since 2008, the Joseph Rowntree Foundation has produced the Minimum Income Standard (MIS). This research is<br />
based on public views of living expenses and living standards to set the minimum income required to meet a minimum<br />
socially acceptable standard of living. This includes, shelter, food and clothes, but also telephones, transport and a<br />
certain amount of social and cultural participation. This is not a poverty threshold or definition, but can be used to<br />
identify those that are unable to achieve an acceptable standard of living.<br />
In <strong>2010</strong> the Minimum Income Standard for a single adult is £14,400 before tax. A couple with 2 children are said to<br />
require an income of £29,200 in order to achieve a socially acceptable standard of living.<br />
Table 3: Household Type <strong>Falkirk</strong> 2008 %<br />
1 adult 34.5%<br />
1 adult with 1 or more children 7.4%<br />
2 or more adults 37.8%<br />
2 or more adults with 1 or more children 20.3%<br />
The report also considers the current economic climate, commenting on the fact that prices for food and fuel have<br />
recently increased, so that whilst salaries have remained the same year on year, people are less well off as<br />
expenditure has increased. Furthermore, the gap between the Minimum Income Standard and benefit levels is<br />
highlighted. It is noted that basic out of work benefits are half the minimum for a single adult and about two thirds the<br />
minimum for a couple with children. The National Minimum Wage also falls short of the MIS. More information can<br />
be found at http://www.jrf.org.uk/sites/files/jrf/MIS-<strong>2010</strong>-report_0.pdf.<br />
Year<br />
Male<br />
Female
<strong>Poverty</strong> & <strong>Inequalities</strong> <strong>Profile</strong><br />
<strong>Falkirk</strong> 2009<br />
SIMD 2009<br />
The Scottish Index of Multiple Deprivation measures deprivation in all 6505 datazones in Scotland. <strong>Falkirk</strong> has 197<br />
datazones, and of these, 17 were within the SIMD 2009 worst 15%. This represents 7.9% of <strong>Falkirk</strong>’s population<br />
living in deprivation.<br />
The table below lists the areas that are within the worst 15% SIMD 2009.<br />
Table 4: SIMD Worst 15% - <strong>Falkirk</strong> 2009<br />
Data Zone Name<br />
SIMD 2009<br />
Rank<br />
S01002520 Langlees Seaforth Road 180 146<br />
S01002483 Grangemouth Kingseat/Craigleith 292 440<br />
S01002543 Denny Bridge Crescent 311 449<br />
S01002519 Dawson Carronside Street 362 344<br />
S01002536 Langlees Lomond Drive 395 558<br />
S01002414 Westquarter Langton Rd/Westquarter Ave 467 489<br />
S01002472 Grangemouth Torwood Avenue 474 598<br />
S01002540 Denny Church Walk 487 858<br />
S01002488 Camelon North 504 770<br />
S01002444 Camelon Carmuirs Ave East 597 584<br />
S01002460 Camelon Carmuirs Avenue West 614 579<br />
S01002482 Grangemouth Avonbank Ave 715 703<br />
S01002429 <strong>Falkirk</strong> Callendar Park flats 742 426<br />
S01002382 Maddiston Windsor Cres/Simpson Drive 762 707<br />
S01002533 Stenhousemuir The Valley 825 1180<br />
S01002502 Bo'ness Deanfield Dr/Rd 829 807<br />
S01002529 Dawson Haugh St/Cobblebrae 885 442<br />
Relative <strong>Poverty</strong><br />
SIMD 2006<br />
Rank<br />
Relative <strong>Poverty</strong> counts the number of individuals living in households with an equivalised income below 60% of the<br />
UK median income.<br />
Table 5: Percentage of Households in relative poverty in Scottish Local Authorities 2002-2008<br />
Local Authority 2002-2005 2003-2006 2004-2007 2005-2008<br />
Clackmannanshire 19 17 18 18<br />
<strong>Falkirk</strong> 17 19 20 20<br />
Stirling 15 17 18 18<br />
Scotland 18 19 19 19<br />
Table 5 provides information from the Scottish Governments report “Relative poverty across Scottish Local<br />
Authorities” <strong>2010</strong>. This report has used data from the Scottish Household Survey and the UK wide Family Resources<br />
Survey. These are small sample surveys and therefore, the accuracy is compromised. For example, in the 2008<br />
SHS survey 637 people in <strong>Falkirk</strong> were surveyed, which is less than 1% of the population.<br />
Nevertheless, when we compare the results for the Forth Valley area and Scotland, it is apparent that <strong>Falkirk</strong> has a<br />
higher rate of relative poverty, and this has gradually risen since 2002.<br />
Absolute <strong>Poverty</strong><br />
Absolute <strong>Poverty</strong> is a measure of individuals living in households whose equivalised income is below 60% of the GB<br />
median income in 1998/1999. This measure seeks to identify those with the lowest income and how they rise in terms<br />
of inflation. In 2008/09, there were 11% of Scottish households living in absolute poverty. The threshold states that a<br />
couple with no children are experiencing absolute poverty if the have an income of £209 per week. This is an annual<br />
income of £10,868.
<strong>Poverty</strong> & <strong>Inequalities</strong> <strong>Profile</strong><br />
<strong>Falkirk</strong> 2009<br />
Financial Security<br />
The Scottish Household Survey is carried out by the Scottish Government biannually for local authorities. There are 3<br />
questions that ask respondents about financial situation such as bank and building society accounts, how they are<br />
coping and savings. People in poverty are less likely to have bank accounts for various reasons. The Banking Code<br />
2005 states that if a bank has a basic bank account option, they should be opened to those who require one or<br />
specifically ask. However, not all banks have this option and they are not usually advertised.<br />
Opening a bank account can be difficult for a number of reasons, for example, due to a previous bank account being<br />
frozen, overdrawn or if the individual is bankrupt, bad credit history or even a lack of credit history. There are also<br />
problems in terms of providing the normal acceptable forms of identification such as a passport or a driving licence<br />
and issues around proof of address and differences in surnames amongst family members.<br />
Table 6:% of households where respondent has a Table 7:% of households describing themselves as<br />
bank, building society or credit union account coping well or very well financially<br />
2003-2004 2005-2006 2007-2008<br />
99-00 01-02 03-04 05-06 07-08<br />
<strong>Falkirk</strong> 92.9 91.5 90.9 <strong>Falkirk</strong> 41.6 50.1 55.3 40.9 53.6<br />
Scotland 89.6 91.3 91.0 Scotland 40.3 46.8 46.8 47.2 51.4<br />
Source: Scottish Household Survey Source: Scottish Household Survey<br />
In <strong>Falkirk</strong>, the number of people without a bank or building society account in 2007/08 was 90.9%; this is slightly lower<br />
than previous years. This shows that people may be experiencing financial difficulties. This is slightly lower than the<br />
Scottish figure, however, where the number of people in <strong>Falkirk</strong> with bank or building society accounts has decreased;<br />
the Scottish figures have increased from 2003/04 to 2007/08.<br />
Table 7 shows that in 2007/08 53.6% of <strong>Falkirk</strong> stated that they were coping well or very well financially. This is<br />
higher than the Scottish rate of 51.4%. While Scotland’s rates have increased over the years, <strong>Falkirk</strong> has fluctuated.<br />
This may reflect the economy, but could also be due to the survey sample of the Scottish Household Survey. It is<br />
important to note that this is before the economic recession and that this figure may have changed considerably.<br />
Table 8: % of households that have some savings<br />
1999-2000 2001-2002 2003-2004 2005-2006 2007-2008<br />
<strong>Falkirk</strong> 55.7 58.1 59.2 46.1 50.9<br />
Scotland 53.3 53.4 53.3 50.8 49.5<br />
Source: Scottish Household Survey<br />
Being able to save increases an individual’s resilience to debt and poverty. Savings can help in times of being made<br />
unemployed, illness and also for emergencies. However, there are many low income individuals and families that are<br />
unable to save, and this leaves them vulnerable to debt and stress and can also lead to loans from doorstep lenders.<br />
It also affects the ability to plan ahead. The table above shows that <strong>Falkirk</strong> had a higher level of savers than Scotland<br />
in 2007/08, with 50.9% saving. However, with the economic recession, this may have changed significantly while<br />
more people fall into debt.<br />
Fuel <strong>Poverty</strong><br />
Fuel <strong>Poverty</strong> is the inability to afford adequate warmth in the home. It is defined as having to spend 10% or more of<br />
income to meet recognized heating standards. Extreme poverty is defined as having to spend 20% or more of annual<br />
income on fuel. An adequate temperature is taken to be the World Health Organisation standard of 21°C in living<br />
rooms and 18°C in other rooms.<br />
Figure 3: Fuel <strong>Poverty</strong> in <strong>Falkirk</strong><br />
% of households<br />
30<br />
25<br />
20<br />
15<br />
10<br />
5<br />
0<br />
Fuel <strong>Poverty</strong> in <strong>Falkirk</strong><br />
Fuel <strong>Poverty</strong> Extreme Fuel <strong>Poverty</strong><br />
<strong>Falkirk</strong><br />
Scotland<br />
For those living in fuel poverty the consequences are<br />
misery, discomfort, ill health and debt. The Scottish<br />
House Condition Survey for 2003-2006 estimates<br />
that 14% of those who were surveyed in this period<br />
were fuel poor in the <strong>Falkirk</strong> <strong>Council</strong> area. This is<br />
lower than the Scottish average of 19%.<br />
<strong>Falkirk</strong> <strong>Council</strong>’s All Tenure House Condition Survey<br />
2009 estimates that 28.2% of households in <strong>Falkirk</strong><br />
are in fuel poverty, whilst 5.1% are considered to be<br />
in extreme fuel poverty, spending in excess of 20% of<br />
annual income on fuel.
Working Age Benefit<br />
Table 9: Working Age Benefits - Distribution<br />
thoughout <strong>Falkirk</strong><br />
Area Number %<br />
Bainsford & Langlees 810 35.8%<br />
Camelon East 575 33.2%<br />
Camelon West 540 31.5%<br />
Hallglen & Glen Village 580 28.7%<br />
Bowhouse 585 26.2%<br />
Newtown 435 26.0%<br />
Stenhousemuir West 490 24.7%<br />
Middlefield 645 24.0%<br />
Kersiebank 635 23.6%<br />
Grahamston 560 23.2%<br />
Newlands 635 23.2%<br />
Laurieston & Westquarter 425 22.5%<br />
Bonnybridge 530 21.1%<br />
Braes Villages 610 20.9%<br />
Dunipace 425 20.6%<br />
Fankerton, Stoneywood & Denny Town 465 20.5%<br />
Banknock & Haggs 460 20.5%<br />
Carronshore 345 20.2%<br />
Tamfourhill 335 20.2%<br />
<strong>Falkirk</strong> Town Centre & Callendar Park 340 20.0%<br />
Nethermains 495 19.7%<br />
Grangemouth Town Centre 340 17.4%<br />
Maddiston & Rumford 440 16.5%<br />
Blackness, Carriden & Grahamsdyke 335 16.3%<br />
Redding 340 16.2%<br />
Douglas 445 15.2%<br />
Kinneil 420 14.8%<br />
Carse & Grangemouth Old Town 330 14.8%<br />
High Bonnybridge & Greenhill 450 14.1%<br />
North Broomage & Inches 365 14.0%<br />
Stenhousemuir East 305 13.4%<br />
Bantaskin 275 13.1%<br />
Merchiston & New Carron Village 310 12.4%<br />
Shieldhill 190 11.2%<br />
Head of Muir & Dennyloanhead 215 11.1%<br />
Carron 185 9.7%<br />
Antonshill 210 9.4%<br />
Larbert Village & South Broomage 190 8.8%<br />
Polmont 220 7.9%<br />
Brightons Reddingmuirhead & Wallacestone 325 7.5%<br />
Lochgreen Lionthorn & Prospecthill 100 4.3%<br />
<strong>Falkirk</strong> 16,910 17.6%<br />
Scotland 572,400 17.6%<br />
<strong>Poverty</strong> & <strong>Inequalities</strong> <strong>Profile</strong><br />
<strong>Falkirk</strong> 2009<br />
Benefits<br />
Table 10: Working Age Benefits Claimant Rates<br />
<strong>Falkirk</strong> Scotland<br />
Total Claimant Rate 17.6% 17.6%<br />
Male 53.1% 53.6%<br />
Female 46.9% 46.4%<br />
% Aged under 25 14.8% 14.5%<br />
% Aged 35-54 45.6% 46.4%<br />
Out of Work Benefits 84.7% 85.5%<br />
% in receipt of ESA/IB 49.7% 50.2%<br />
% in receipt of JSA 23.9% 22.7%<br />
% who are lone parents 8.7% 9.7%<br />
Duration - Up to 6 months 24.8% 23.2%<br />
Duration - 2-5 years 13.2% 14.4%<br />
Duration - 5 or more years 42.8% 43.2%<br />
Source: Nomis 2009<br />
Working age benefits is a count of people who are claiming<br />
one or more benefits that are of working age (16-59 for<br />
women and 16-64 for men). This provides the total number<br />
of people in receipt of working age benefits rather than the<br />
number of claims.<br />
Working age benefits include Job Seekers Allowance,<br />
Income Support, Incapacity Benefit and Employment<br />
Support Allowance, Disability Living Allowance, Severe<br />
Disablement Allowance and Carer’s Allowance. This data<br />
gives information on people who are out of work and<br />
unable to work.<br />
Table 9 shows the distribution of claimants of working age<br />
benefits throughout the <strong>Falkirk</strong> intermediate area zones.<br />
Those highlighted in red are the eleven areas with the<br />
highest level of claimants. Those above the line are above<br />
the <strong>Falkirk</strong> and Scottish average of 17.6%. In Bainsford<br />
and Langlees 35.8% of its working age population are in<br />
receipt of benefits, whilst Lochgreen, Lionthorn &<br />
Prospecthill has as little as 4.3%. This difference<br />
demonstrates the level of inequality throughout <strong>Falkirk</strong>.<br />
Table 10 shows more detailed information on the people in<br />
receipt of working age benefits. Almost half are aged<br />
between 35-54 and in receipt of Employment Support<br />
Allowance or Incapacity Benefit. The rate of people<br />
claiming for over 5 years is high at 42.8%.<br />
Almost a quarter of the working age population are in<br />
receipt of Job Seekers Allowance, and this corresponds<br />
with the number of claimants who are in receipt of benefits<br />
up to 6 months.
<strong>Poverty</strong> & <strong>Inequalities</strong> <strong>Profile</strong><br />
<strong>Falkirk</strong> 2009<br />
Economic Activity Benefits<br />
Job Seekers Allowance<br />
Table 11: JSA Claimants by Age Group<br />
<strong>Falkirk</strong> Scotland<br />
Claimant Rate 4.3% 3.9%<br />
aged under 18 2.3% 1.4%<br />
aged 18-24 27.8% 28.1%<br />
aged 25-34 23.3% 24.2%<br />
Male 75.9% 75.6%<br />
Female 24.1% 24.4%<br />
No Dependants 88.5% 89.7%<br />
With dependants 11.5% 10.3%<br />
Source: Nomis 2009<br />
Income Support<br />
Table 12: Income Support Claimants<br />
<strong>Falkirk</strong> Scotland<br />
Number of Claimants 5.1% 5.8%<br />
Male 35.6% 37.3%<br />
Female 64.4% 62.7%<br />
% With Partner 13.9% 10.8%<br />
% Single 86.1% 89.2%<br />
Incapacity Benefits 60.3% 61.2%<br />
Lone Parent 30.1% 29.5%<br />
Carer 6.0% 5.6%<br />
Other Income Related benefit 3.5% 3.7%<br />
2 years and up to 5 years 22.0% 22.5%<br />
5 years and over 49.5% 50.3%<br />
Males - No Dependants 84.8% 87.4%<br />
Females - No Dependants 42.4% 42.7%<br />
Males – With Dependants 14.6% 12.6%<br />
Females – With Dependants 57.6% 57.3%<br />
Source: Nomis 2009<br />
Pension Credit<br />
Table 13: Pension Credit Claimants<br />
<strong>Falkirk</strong> Scotland<br />
% of Pensioners on Pension<br />
Credit 27.1% 28.0%<br />
Male 37.6% 37.6%<br />
Female 62.4% 62.4%<br />
Single 78.8% 79.8%<br />
With Partner 21.2% 20.2%<br />
Source: Nomis 2009<br />
Job Seekers Allowance is paid to those who are<br />
unemployed. <strong>Falkirk</strong> has a higher rate of JSA claimants<br />
than Scotland.<br />
Table 11 shows that the percentage of JSA aged under 18<br />
is considerably higher than the Scottish rate. This is<br />
evidence of school leavers not in a positive destination.<br />
The majority of claimants (51.1%) are aged between 18-34<br />
and are male with no dependants. 92.2% are white, with<br />
only 0.75% from ethnic minorities. This information is<br />
voluntary and the remainder preferred not to give details.<br />
This information shows that worklessness amongst young<br />
males is an issue in <strong>Falkirk</strong> and Scotland.<br />
Table 12 provides details of income support claimants in<br />
the <strong>Falkirk</strong> area. The rates are similar to the Scottish rates.<br />
64.4% of Income Support claimants are female, of these<br />
92.3% are single. 57.6% of female claimants have 1 or<br />
more dependants. The evidence from the table shows that<br />
more single women are on Income Support than males,<br />
and more than half of these have children.<br />
Another area of concern is the number of people in receipt<br />
of Income Support and Incapacity Benefit. The high<br />
percentage of those in receipt of Income Support, whilst on<br />
Incapacity Benefits shows that this is an area of income<br />
deprivation.<br />
49.5% of claimants have been in receipt of Income Support<br />
for 5 or more years. This shows that this is a long term<br />
benefit that people find hard to move on from.<br />
Pension Credit is a benefit for people of pensionable age<br />
on low incomes. The Pension Credit acts as a top up to<br />
supplement the state pension.<br />
Table 13 shows that <strong>Falkirk</strong> has a slightly lower rate of<br />
Pension Credit Claimants than Scotland with 27.1% of the<br />
pensionable population in receipt of Pension Credit.<br />
Almost 80% of claimants are single and 62.4% of all<br />
claimants are female. This is in line with the Scottish rate<br />
and is to be expected due to the longer life expectancy of<br />
women.
Incapacity Benefit/Severe Disablement Allowance<br />
Table 14: IB/SDA Claimant Rates<br />
<strong>Falkirk</strong> Scotland<br />
Claimant Rate<br />
% of claimants of working<br />
5.8% 5.8%<br />
age<br />
% of claimants of<br />
98.2% 98.3%<br />
pensionable age 1.8% 1.7%<br />
Male 53.2% 55.6%<br />
Female 46.8% 44.4%<br />
Duration of claim - 2-5 yrs 18.9% 20.3%<br />
Duration of claim - 5 yrs + 71.0% 68.7%<br />
Source: Nomis 2009<br />
Disability Living Allowance<br />
Table 15: DLA Claimant Rates<br />
Carer’s Allowance<br />
Table 16: Carer's Allowance Claimant Rates<br />
<strong>Falkirk</strong> Scotland<br />
Claimant Rate 1.0% 0.9%<br />
Male 28.6% 29.5%<br />
Female 70.7% 70.5%<br />
Aged under 18 0.7% 0.3%<br />
Working Age 95.2% 94.7%<br />
Pensionable Age 4.1% 5.0%<br />
Duration 2-5 years 24.7% 26.9%<br />
Duration 5+ years 41.1% 40.6%<br />
Source: Nomis 2009<br />
<strong>Falkirk</strong> Scotland<br />
Claimant Rate 6.8% 6.6%<br />
Male 48.4% 48.6%<br />
Female 51.6% 51.4%<br />
Aged 0-15 8.9% 8.0%<br />
% of Working Age 56.5% 58.3%<br />
% of Pensionable Age 34.6% 33.7%<br />
Duration 2-5 years 15.2% 16.2%<br />
Duration 5+ years 70.3% 70.7%<br />
Source: Nomis 2009<br />
<strong>Poverty</strong> & <strong>Inequalities</strong> <strong>Profile</strong><br />
<strong>Falkirk</strong> 2009<br />
Benefits<br />
Incapacity Benefit/Severe Disablement Allowance is paid to<br />
people who are unable to work due to disability or sickness.<br />
The claimant rate of <strong>Falkirk</strong> is the same as the Scotland<br />
rate of 5.8%. Almost all claimants are of working age at<br />
98.2%.<br />
Slightly more males (53.2%) than females (46.8%) are<br />
claimants.<br />
71% of claimants have been in receipt of Incapacity<br />
Benefit/Severe Disablement Allowance for 5 years or more.<br />
Disability Living Allowance is paid to people who are<br />
disabled and need assistance with personal care and/or<br />
mobility.<br />
Table 15 shows that the claimant rate in <strong>Falkirk</strong> is slightly<br />
higher than the Scottish rate. 56.5% of all claimants are of<br />
working age, and 70.3% have been in receipt of DLA for 5<br />
years or more. This is due to the conditions suffered by<br />
claimants.<br />
This is not an area we can aim to decrease, but more be<br />
aware that this is a group that are at risk of poverty and<br />
inequality.<br />
Carer’s Allowance is paid to people who look after a<br />
severely disabled person for more than 35 hours per week.<br />
The current rate for claimants within <strong>Falkirk</strong> is 1% of the<br />
population.<br />
70.7% of claimants are female, with 95.2% of all claimants<br />
of working age. Again, the majority of claimants are long<br />
term, as they are often caring for family members or<br />
partners who are disabled.<br />
This is a group that are at risk of poverty as they are often<br />
unable to work but there are small numbers.
Housing Benefit & <strong>Council</strong> Tax Benefit<br />
<strong>Poverty</strong> & <strong>Inequalities</strong> <strong>Profile</strong><br />
<strong>Falkirk</strong> 2009<br />
Housing Benefit is available to tenants liable to pay rent who have a low level of income and savings. This is<br />
available to people living in Local Authority housing or housing association housing. Local Housing Allowance was<br />
introduced in 2008 and is available to people living in Private Rented accommodation that have low income and<br />
savings. These tables show those receiving Housing Benefit and <strong>Council</strong> Tax Benefit who are also on low income<br />
benefits.<br />
<strong>Council</strong> Tax Benefit is offered to those liable to pay <strong>Council</strong> Tax but have low income and savings level. This benefit<br />
is available to those who rent and owner occupiers. In 2008/09 57.1% of <strong>Council</strong> tenants received Housing Benefit,<br />
whilst 56.2% of Registered Social Landlord (RSL) tenants and 36.2% of those living in private rented accommodation<br />
received Housing Benefit.<br />
Table 17: Tenure Type of Housing Benefit Claimants<br />
Year Local Authority Registered Social Landlord Private Landlord Total<br />
2003/04 7,276 80.8% 1,024 11.4% 700 7.8% 9,001<br />
2004/05 7,432 81.0% 1,104 12.0% 635 6.9% 9,172<br />
2005/06 7,217 80.9% 1,068 12.0% 625 7.0% 8,911<br />
2006/07 7,059 80.5% 1,092 12.5% 617 7.0% 8,769<br />
2007/08 6,838 79.9% 1,224 14.3% 492 5.8% 8,555<br />
2008/09 6,752 79.1% 1,218 14.3% 563 6.6% 8,534<br />
2009/10 6,980 76.4% 1,297 14.2% 859 9.4% 9,137<br />
The table above shows that the majority of Housing Benefit claimants live in <strong>Council</strong> housing. It also shows that the<br />
number of those living in Local Authority housing claiming Housing Benefit has decreased from 2003/04 to 2009/10<br />
whilst the number of people living in RSL accommodation has gradually increased during the same period.<br />
The number of people living in Private Landlord accommodation was decreasing from 2003/04 to 2007/08, however,<br />
in 2008/09 and 2009/10 there has been significant increases; this may be due to the limited stock of Local Authority<br />
and RSL housing and higher availability of Private Landlord accommodation.<br />
Table 18: Benefit<br />
Housing Benefit & <strong>Council</strong> Tax<br />
Year Benefit Housing Benefit Only <strong>Council</strong> Tax Benefit Only Total<br />
2003/04 8,513 82.0% 487 4.7% 1,382 13.3% 10,382<br />
2004/05 8,661 80.1% 510 4.7% 1,636 15.1% 10,807<br />
2005/06 8,367 78.5% 543 5.1% 1,749 16.4% 10,659<br />
2006/07 8,246 77.7% 522 4.9% 1,843 17.4% 10,611<br />
2007/08 8,009 76.7% 545 5.2% 1,886 18.1% 10,440<br />
2008/09 8,019 76.9% 514 4.9% 1,891 18.1% 10,424<br />
2009/10 8,579 77.0% 557 5.0% 2,012 18.0% 11,148<br />
<strong>2010</strong>/11 8,698 77.3% 548 4.9% 2,006 17.8% 11,252<br />
Table 18 shows that the majority of claimants received both Housing Benefit and <strong>Council</strong> Tax Benefit. The increase in<br />
the number of <strong>Council</strong> Tax Benefit only is a reflection of the increase in rates of owner occupation.
Housing in <strong>Falkirk</strong><br />
<strong>Poverty</strong> & <strong>Inequalities</strong> <strong>Profile</strong><br />
<strong>Falkirk</strong> 2009<br />
Housing & Households<br />
Current population changes have led to household changes. The number of households is increasing whilst the size<br />
of households is decreasing as more young and elderly people live alone, families are smaller, as couple chose to not<br />
to have children or to have fewer, and relationship breakdowns.<br />
The number of households in the council area has grown from 56,780 in 1991 to 68,223 in 2009, an increase of<br />
20.2% while the population has only increased by 6.5% within the same period. By 2033 it is predicted that there will<br />
be 86,410 households within the <strong>Council</strong> area.<br />
While the number of households will increase, there will also be a significant change in the household types. The<br />
number and percentage of single person households will increase substantially; by 2033 nearly 45% of all households<br />
will consist of a single person, a total of 38,050 households. There will be a consequential reduction in the number of<br />
households of two or more adults with children with a 26% decrease from 2008 to 2033.<br />
As a result of the change in the types of households, average household size will continue to fall from 2.21 persons<br />
per households in 2008 to 1.95 people per household in 2033. The Scottish average will decrease from 2.18 to 1.93 in<br />
the same period.<br />
Housing Tenure<br />
The impact of the Right to Buy on the distribution of tenure has been significant. In 1981 69.3% of <strong>Falkirk</strong> households<br />
were living in local authority housing and only 26.3% owner occupied. Right to Buy has widened access to owner<br />
occupation significantly. 67.4% of <strong>Falkirk</strong> households are now owner occupied which is more than double the<br />
proportion of owner occupation prior to the Right to Buy and only 23.3% are local authority housing.<br />
80.00%<br />
70.00%<br />
60.00%<br />
50.00%<br />
40.00%<br />
30.00%<br />
20.00%<br />
10.00%<br />
0.00%<br />
67.40%<br />
Figure 4: Housing Tenure <strong>Falkirk</strong> 2008<br />
23.30%<br />
4.40% 4.90%<br />
Owner Occupier <strong>Falkirk</strong> <strong>Council</strong> Housing Association Private Rented<br />
Tenure Type
Housing Affordability<br />
<strong>Poverty</strong> & <strong>Inequalities</strong> <strong>Profile</strong><br />
<strong>Falkirk</strong> 2009<br />
Over the past decade the availability of social rented housing has been decreasing and house prices have been rising<br />
steadily. The average price of a house sold in 1999 in <strong>Falkirk</strong> was £57,271. <strong>Falkirk</strong> reached over the £100,000 mark<br />
in early 2004, the Scottish average reached this in 2005. House prices have continued to rise substantially over the<br />
subsequent years and the average house sale price in 2009 was £124,247 for the <strong>Falkirk</strong> area. The Scottish average<br />
was slightly lower than this at £123,398.<br />
For those on lower incomes looking to buy, using the lowest house price quartile can be applied in order to measure<br />
housing market affordability. The lower quartile house price has been increasing from 2003 to 2008 from £42,063 to<br />
£83,000, an increase of 97%. The lowest quartile house price for 2009 was £78,500. This is decrease from the 2008<br />
average and the last time the lower quartile house price figure was at this level was in 2006.<br />
£<br />
£150,000<br />
£130,000<br />
£110,000<br />
£90,000<br />
£70,000<br />
£50,000<br />
£30,000<br />
£10,000<br />
Figure 5: Year Analysis of lower quartiles, <strong>Falkirk</strong> average and Scottish average<br />
House Prices<br />
1999 2000 2001 2002 2003 2004 2005 2006 2007 2008 2009<br />
Source: Register of Sasines and HBOS housing market research, <strong>2010</strong><br />
Table 19: Housing Affordability 2009<br />
Mean Income £ 27,274<br />
Median Income £ 24,232<br />
Lower Quartile Earnings £ 17,962<br />
Lower Quartile house price £ 78,500<br />
Mean income/price ratio 3.04<br />
Median income/price ratio 3.43<br />
Lower Quartile earnings/price ratio 4.62<br />
Income Levels of <strong>Council</strong> Housing List Applicants<br />
Table 20: Income Levels<br />
Income Band (per year) Percentage<br />
Under £10,000 45%<br />
£10,000-£15,000 25%<br />
£15,000-£20,000 13%<br />
£20,000-£25,000 8%<br />
£25,000-£30,000 5%<br />
£30,000-£40,000 3%<br />
Over £40,000 1%<br />
Total 100%<br />
Year<br />
<strong>Falkirk</strong> Average<br />
Falkrik Lower Quartile<br />
Scotland Average<br />
Using the house prices to income ratios to measure<br />
affordability gives a general indication of whether house<br />
prices are affordable in relation to incomes. In 2009, the<br />
lower quartile house price to lower quartile earnings ratio was<br />
4.6. This illustrates housing is less affordable with lower<br />
quartile house prices being more than 4.6 times the lower<br />
quartile earnings, compared to 3.04 times the mean income<br />
and 3.43 times the median income. Unfortunately, a<br />
comparison to Scotland is unavailable.<br />
Table 20 shows the figures for income levels for applicants on<br />
the council housing list. The table shows 45% of applicants<br />
have an income under £10,000. These applicants within this<br />
income band would include those who have been made<br />
unemployed, retired and people who earn under £10,000 and<br />
may not be able to apply for private renting due to their low<br />
income. This gives an indication of the relative poverty of<br />
people on the waiting list for social renting housing.
Homelessness<br />
<strong>Poverty</strong> & <strong>Inequalities</strong> <strong>Profile</strong><br />
<strong>Falkirk</strong> 2009<br />
Clearly not having a home or being at risk of homelessness is a situation that puts individuals and families at risk of<br />
creating barriers and causing problems, for example with employment, schooling may become disrupted; access to<br />
health, benefits, childcare and other services becomes difficult. It is therefore, vital in terms of reducing barriers and<br />
problems to ensure that all our residents have safe and secure homes. Applications under The Homelessness etc<br />
(Scotland) Act 2003 have been increasing, with a 76% increase in homeless applications in the <strong>Falkirk</strong> area since<br />
2002. Significant increases of over 25% from 2004-05 to 2005-06 and 2006-09 to 2007-08 took place.<br />
Number of Applications<br />
3,000<br />
2,500<br />
2,000<br />
1,500<br />
1,000<br />
500<br />
0<br />
Figure 6: Number of Homeless Applications under the Homeless Persons Legislation<br />
1996-97 1997-98 1998-99 1999-00 2000-01 2001-02 2002-03 2003-04 2004-05 2005-06 2006-07 2007-08 2008-09<br />
The chart illustrates the percentage of applicants who are assessed as being in priority need for accommodation<br />
under the homeless person’s legislation. A number of criteria have to be met. These include dependent children,<br />
pregnancy, age, vulnerability and risk of abuse or harassment. The figure illustrates the rising percentage of<br />
applicants assessed as being in priority need of housing compared to applicants who have been assessed as<br />
homeless. Out of the 2,651 applicants in 2008/2009 63.9% were assessed as a priority need, this is an increase of<br />
17.2% since 2002/2003 when 46.7% of applicants were in priority need.<br />
Figure 7: Percentage of Applicants Assessed as Homeless and Percent of Applicants Assessed as being in<br />
Priority Need<br />
80.0%<br />
70.0%<br />
60.0%<br />
50.0%<br />
% 40.0%<br />
30.0%<br />
20.0%<br />
10.0%<br />
0.0%<br />
2002-03 2003-04 2004-05 2005-06 2006-07 2007-08 2008-09<br />
Year<br />
Applications assessed as homeless<br />
Applications assessed as being in priority need<br />
Year
Homelessness (continued)<br />
<strong>Poverty</strong> & <strong>Inequalities</strong> <strong>Profile</strong><br />
<strong>Falkirk</strong> 2009<br />
Homelessness is an issue which predominantly affects young people under the age of 25. Nationally, 37% of<br />
applicants are under the age of 25 whereas the comparative figure for <strong>Falkirk</strong> is 39%.<br />
Table 21: Applicants Applying for Assistance in Obtaining Accommodation 2007/2008<br />
Applicant %<br />
Single Male 32.6%<br />
Single Female 19.8%<br />
Single Parent Male 8.9%<br />
Single Parent Female 17.7%<br />
Couple no children 8.1%<br />
Couple with children 6.3%<br />
Other without children 3.5%<br />
Other with children 3.2%<br />
This table breaks down the applicants applying for accommodation during the period 2008/2009. Over 50% were<br />
single persons, with 32.6% being a single male and 19.8% single female. There were 26.6% of applicants within the<br />
single parent group of which 17.7% were a single parent female.<br />
Table 22: Main Reason for Applying for Assistance in Obtaining Accommodation 2008/2009<br />
Reason %<br />
Termination of tenancy/mortgage due to arrears or default on payments 9.8%<br />
Other action by landlord resulting in the termination of tenancy 5.0%<br />
Applicant terminated secure accommodation 2.0%<br />
Loss of services/tied accommodation 0.4%<br />
Discharge from prison/hospital/care/other 2.8%<br />
Emergency (fire, flood, storm, closing order etc) 0.5%<br />
Forced division and sale of matrimonial home 1.2%<br />
Other reason for loss of accommodation 1.7%<br />
Dispute within household: violent or abusive 22.2%<br />
Dispute within household/relationship breakdown: non violent 16.4%<br />
Fleeing non-domestic violence 2.6%<br />
Harassment 1.7%<br />
Overcrowding 2.5%<br />
Asked to leave 23.7%<br />
Other reason for leaving accommodation/household 7.5%<br />
In 2008/2009 the main reason for applying for assistance, given by nearly a quarter of all applicants (629 out of 2,651<br />
applicants), was that they were asked to leave their accommodation. Other specific reasons include: a violent or<br />
abusive disputes within the households given by 588 (22.2%) of the applicants; non violent dispute/relationship<br />
breakdown within the household 436 applicants (16.4%). 9.8% of applicants were due to the termination of tenancy/<br />
mortgage due to rent arrears or default on payment.<br />
In comparison to the Scottish averages, <strong>Falkirk</strong> had twice the rate of applicants who were applying because of a<br />
violent or abusive dispute, the Scottish rate for 2008/08 was 10.8%, and the Scottish rate for termination of tenancy<br />
and mortgage due to arrears or default was 5.5%.
Debt<br />
<strong>Poverty</strong> & <strong>Inequalities</strong> <strong>Profile</strong><br />
<strong>Falkirk</strong> 2009<br />
Information has been obtained from the three Citizens Advice Bureaux (CABx) in the <strong>Falkirk</strong> <strong>Council</strong> area (Denny,<br />
Grangemouth and <strong>Falkirk</strong>) and from the <strong>Council</strong>’s own debt advice services on the numbers of cases which they have<br />
dealt with of different kinds of debt, and the amount of debt, for the four years from April 2006 to March <strong>2010</strong>.<br />
Overall in the period April 2006 to March <strong>2010</strong> debt amounting to over £169.3m was dealt with by the three CABx and<br />
the <strong>Council</strong>. This amounts to some 5,660 new cases over the four year period. <strong>Falkirk</strong> <strong>Council</strong> Debt Advice Services<br />
dealt with 47% of all cases, whist the CABx dealt with 53%. The <strong>Falkirk</strong> branch saw 29% of clients, whilst<br />
Grangemouth saw 14% and Denny 10%.<br />
Thirty one different types of debt are categorised. These are listed in Table 23 with the total amount of debt in each<br />
category 2006-<strong>2010</strong> shown in descending order. While all 31 categories were dealt with by the CABx and the<br />
<strong>Council</strong>, the importance of each varied considerably.<br />
Table 23: Total debt dealt with by category 2006-<strong>2010</strong><br />
Category of debt Total debt % Category of debt Total debt %<br />
Mortgage £74,099,511 43.8% Benefits/tax credits OP £1,090,567 0.6%<br />
Credit card £22,004,186 13.0% Other loan £1,001,364 0.6%<br />
Bank loan £16,809,697 9.9% Student debt £409,878 0.2%<br />
Personal loan £16,079,722 9.5% Electricity £369,743 0.2%<br />
Secured loan £9,087,313 5.4% Mobile phone £306,569 0.2%<br />
Mortgage arrears £4,348,683 2.6% Maintenance/child support £237,884 0.1%<br />
Bank overdraft £4,038,884 2.4% Gas £199,942 0.1%<br />
<strong>Council</strong> tax & water £3,579,637 2.1% Other housing costs £195,553 0.1%<br />
HP/conditional sale £3,193,423 1.9% Telephone (land line) £179,402 0.1%<br />
Other £2,694,395 1.6% Cable or satellite TV £78,199 0.0%<br />
Rent £1,881,034 1.1% Other utilities £63,160 0.0%<br />
Catalogue £1,709,187 1.0% Social fund loan £55,282 0.0%<br />
Store card £1,599,139 0.9% Housing repairs £42,920 0.0%<br />
Doorstep credit £1,464,770 0.9% Fines £28,501 0.0%<br />
Income tax £1,319,335 0.8% Credit union loan £15,122 0.0%<br />
Secured loan arrears £1,124,163 0.7% Total £169,307,180 100%<br />
By far the largest amount of debt related to mortgage payments – almost 44% of all debt fell into this category<br />
amounting to over £74m, with a further 2.6% on mortgage arrears (£4.35m). As might have been expected during a<br />
recession, the amount of mortgage debt dealt with has increased substantially since 2006/07. From just under £7m in<br />
that year, only 26% of all debt, the figure had more than tripled to £22.5m by 2008/09 and at over £31m in 2009/10<br />
this represents over four and a half times the level of mortgage debt dealt with in 2006/07, while it has increased to<br />
43.8% of all debt dealt with.<br />
The second highest level of debt was on credit cards which represented 13% of all debt and over £22m, followed by<br />
bank loans at 9.9% (almost £17m), personal loans 9.5% (£16.1m) with secured loans (5.4%) the only other type of<br />
debt which exceeded 5% of the total. While all these forms of debt showed some increase, particularly in 2009/10,<br />
the amount of increase was small; nor was there any noticeable difference in the pattern in the debt dealt with by the<br />
four different offices.<br />
Seven other categories of debt made up between 1% and 5% of all debt. These were: bank overdrafts, <strong>Council</strong> Tax<br />
and water bills, mortgage arrears, HP/conditional sale, rent, catalogue debts, and the catchall “other” category. It<br />
should be noted however, that although the remaining 19 categories each contributed less than 1% to the total<br />
amount of debt dealt with, any one of these could be a very difficult problem for the individual(s) concerned with the<br />
debt.<br />
While each of these types of debt is given separately, many clients will have multiple debts across several of the<br />
categories listed.
Debt<br />
Breakdown on Type of clients<br />
<strong>Poverty</strong> & <strong>Inequalities</strong> <strong>Profile</strong><br />
<strong>Falkirk</strong> 2009<br />
Gender: Over the period and across all offices the pattern remained very similar with just over 40% of clients being<br />
female, 32.8% of clients were male, with couples making up 25.8% of all clients.<br />
Age: Around 75% of clients were aged 21-50 with roughly the same proportion in each of the age groups 21-30,<br />
31-40 and 41-50. A further 15% were aged 51-60. There were very few aged under 20 or over 70. This age<br />
distribution of clients is not particularly surprising as debt is less common among older people and very young<br />
adults.<br />
Household type:<br />
50% of clients lived in single person households and 20% were single parents. Both figures are significantly higher<br />
than the <strong>Council</strong> average which shows 35% of households as single persons and only 7% as single parent<br />
households. Given that almost half of all single adult households are pensioners 1 but pensioners make up only a<br />
small proportion of debt clients, this suggests that single adult households are almost three times more likely to<br />
approach debt counsellors than their representation in the population would suggest. Single parent households were<br />
also almost three times more likely to be receiving support for debt problems than others<br />
It is perhaps not surprising that non-pensioner single adults and single parents are more likely than average to have<br />
debt problems since they have only one income, whether from earnings or benefits, coming into the household. Table<br />
24 shows the proportion of single adult households and single parents who are on low incomes compared with the<br />
average. These figures are taken from the Scottish Household Survey and refer to Scotland as a whole.<br />
Table 24: Household income by household type<br />
Household type<br />
Net annual income Single non-pensioner adult Single parent All<br />
< £10,000 30% 19% 20%<br />
£10,001-£20,000 45% 59% 34%<br />
£20,000 + 25% 22% 46%<br />
100% 100% 100%<br />
Source: Scottish Household Survey 2007/08 http://www.scotland.gov.uk/Resource/Doc/933/0092736.xls#Table_6_1_1<br />
This shows that these two types of households have lower incomes than average. 30% of single non-pensioner adult<br />
households have net incomes of under £10,000 compared to 20% of all households and 78% of single parents have<br />
incomes of less than £20,000 compared to 54% of all households.<br />
Economic activity:<br />
The following graph shows the economic activity of the debt clients. Looking over time, there is some evidence that<br />
there has been an increase in the proportion of clients who are unemployed. <strong>Falkirk</strong> <strong>Council</strong> clients were significantly<br />
more likely to be unable to work due to ill health and less likely to be in full time employment.<br />
Figure 8: Economic Activity of Debt Clients<br />
Retired 6%<br />
Unable to work due<br />
to ill health 23%<br />
Other 10%<br />
Unemployed 15%<br />
Economic activity of debt clients<br />
Full time employment<br />
35%<br />
Part time employment 11%<br />
1 Source Scottish Household Survey 2007/08 http://www.scotland.gov.uk/Resource/Doc/933/0092732.xls#Table_2_4_2
Debt<br />
<strong>Poverty</strong> & <strong>Inequalities</strong> <strong>Profile</strong><br />
<strong>Falkirk</strong> 2009<br />
It is difficult to find a direct comparison to these proportions, but figures from the Scottish Household Survey 2007/08<br />
on the economic activity profile of the population aged 16+ show that:<br />
• 21% of the population were retired compared to 6% of debt clients;<br />
• 3% of the population were unemployed compared to 15% of debt clients;<br />
• 6% of the population were unable to work due to ill health compared to 23% of debt clients.<br />
Housing tenure:<br />
In spite of the high proportion of mortgage debt, only 25.6% of debt clients were owner occupiers while 47.8% rented<br />
from the <strong>Council</strong>. This compares with 67% of all households who are owner occupiers in <strong>Falkirk</strong> and 23% who are<br />
<strong>Council</strong> tenants. However, the proportion of clients who are owner occupiers increased over the period 2006-<strong>2010</strong><br />
from 21.3% in 2006/07 to 30.6% in 2009/10. This is almost certainly due to the increase in mortgage debt dealt with.<br />
The proportion of clients renting from other social landlords and privately is about twice the proportion within the<br />
population as a whole, although in both cases the percentage of all clients is around 7%. Perhaps not surprisingly,<br />
<strong>Falkirk</strong> <strong>Council</strong>’s clients were more likely to be <strong>Council</strong> tenants than the CABx clients, while non-householders and<br />
private rented tenants were more likely to have been dealt with by <strong>Falkirk</strong> and Grangemouth CABx.<br />
Ethnicity:<br />
97.5% of clients were white which is in line with the likely ethnicity breakdown of the population as a whole (the most<br />
recent ethnicity figures for the <strong>Council</strong> area are from the 2001 Census which showed just over 1% of the population<br />
from an ethnic minority). However, while half the ethnic population in 2001 was Pakistani in origin, only 0.3% of all<br />
clients were Pakistani.<br />
Disability:<br />
The figures on economic activity show that a very high proportion of debt clients are unable to work due to ill health.<br />
This is reflected in the figures on disability where 38.3% of clients had some form of long term illness or disability.<br />
This compares with 16% of the working age population in the 2001 Census who had a limiting long term illness or<br />
disability.<br />
Information is also provided on the type of disability. 17.8% of debt clients had a learning disability or a mental health<br />
problem and 9.1% a physical disability. <strong>Falkirk</strong> <strong>Council</strong> clients were more likely than CABx clients to have a disability<br />
of any type.<br />
Income:<br />
As might be expected of those with debt problems, income levels of debt clients tend to be low. Figure 9 shows that<br />
almost 30% of debt clients had an income of less than £6,000 per year. 89% of all clients had an income of less than<br />
£20,000.<br />
Figure 9: Income of Debt Clients<br />
35%<br />
30%<br />
25%<br />
20%<br />
15%<br />
10%<br />
5%<br />
0%<br />
Income of debt clients<br />
< £6,000 £6-10,000 £10-15,000 £15-20,000 £20-25,000 £25-3,0000 £30-40,000 £40,000 +<br />
Income band
Children & Young People<br />
<strong>Poverty</strong> & <strong>Inequalities</strong> <strong>Profile</strong><br />
<strong>Falkirk</strong> 2009<br />
Table 25: Children & Young People <strong>Falkirk</strong> Average Scottish Average<br />
Birth<br />
Low weight live singleton birth rate per 1000 live singleton births 23.31 24.13<br />
% of children breastfeeding at the First Visit review 35.50% 44.90%<br />
% of children exclusively breastfeeding at the First Visit review 30.10% 36.90%<br />
% of first time mothers aged 16 and under 2005-07 9.60% 7.80%<br />
% first time mothers aged 19 and under 2005-2007 13.90% 14.20%<br />
% of mothers smoking at booking 2005-2007 22.90% 20.80%<br />
Low Income Families<br />
% of Children Living in a low income household (GROS 2007/08) 43% 45%<br />
% of children living in out of work households 16.9% 18.5%<br />
Table 25 above provides information on children and young people in <strong>Falkirk</strong>. The early years of a child has a<br />
significant effect on their future. In <strong>Falkirk</strong>, we have a higher rate of smoking during pregnancy, and a higher rate of<br />
teenage mothers under the age of 16 than the Scottish average. Further to this we have considerably lower rates of<br />
breastfeeding than the Scottish average.<br />
In 2007/08, <strong>Falkirk</strong> has 15,330 (43%) children living in low income households; this is 2% lower than the Scottish rate.<br />
Table 26: Free School Meals and Clothing Grants<br />
Secondary Schools<br />
Free School Footwear/Clothing<br />
School Name meals (2009) Grant (2007/08)<br />
Bo'ness Academy 14% 22%<br />
Braes High 11% 17%<br />
Denny High 14% 23%<br />
<strong>Falkirk</strong> High 17% 25%<br />
Graeme High 14% 22%<br />
Grangemouth High 15% 29%<br />
Larbert High 8% 15%<br />
St Mungo's High 9% 20%<br />
Source: <strong>Falkirk</strong> <strong>Council</strong> Education Services<br />
Table 27: Child Tax Credits & Working Tax Credits<br />
<strong>Falkirk</strong> Scotland<br />
Children in families receiving Tax<br />
Credits 24,865 800,200<br />
In Work 79% 76%<br />
Out of Work 21% 24%<br />
% of In Work - Lone Parent 25% 21%<br />
% of Out of Work - Lone Parent 75% 77%<br />
% of In Work receiving WTC 34% 38%<br />
Source: DWP<br />
Table 26 provides information on free school meals<br />
and clothing grants in the <strong>Falkirk</strong> area.<br />
Parents/Guardians can apply for free school meals<br />
and/or footwear and clothing grants for their<br />
children provided they are in receipt of child benefit,<br />
and either Income Support, Job Seekers Allowance<br />
(Income Based) or in some cases Child Tax Credit<br />
(depending on annual income).<br />
Comparing the proportion of each school roll that is<br />
in receipt of these awards can provide an indication<br />
of deprivation and potential exclusion.<br />
Table 27 shows the number of children living in<br />
households in receipt of Child Tax Credits and<br />
Working Tax Credits. Child Tax Credits are paid to<br />
most people for having 1 or more children.<br />
Working Tax Credits are a top up for those on low<br />
incomes.<br />
The percentage of in work families in receipt of Tax<br />
Credits is higher than the Scottish average; this is<br />
evidence of lower wages in the area. 75% of out of<br />
work recipients are lone parents.
<strong>Poverty</strong> & <strong>Inequalities</strong> <strong>Profile</strong><br />
<strong>Falkirk</strong> 2009<br />
Primary Schools<br />
Children in <strong>Falkirk</strong> primary schools continue to attain well, with most achieving the expected level or better in literacy<br />
and mathematics. Information on 5-14 levels is no longer collected nationally.<br />
Table 28: Attainment at Primary Schools 2006 2007 2008 2009 <strong>2010</strong><br />
Expected level or better in reading 84% 85% 85% 85% 86%<br />
Expected level or better in writing 81% 81% 81% 82% 82%<br />
Expected level or better in maths 87% 88% 87% 88% 88%<br />
Figure 10: Attendance Rates in Primary Schools<br />
95.8<br />
95.6<br />
95.4<br />
95.2<br />
95.0<br />
94.8<br />
94.6<br />
Source: Education Services<br />
Secondary Schools<br />
SQA Exam results for <strong>Falkirk</strong> secondary schools are showing steady improvement year-on year. In some of the<br />
exam measures of performance, <strong>Falkirk</strong> is now exceeding the national average or doing better than similar<br />
authorities. This positive picture of improvement results partly from the improvements in teaching described below,<br />
and partly from the benefits of low exclusion and good attendance.<br />
Table 29: Attainment at Secondary Schools 2007 2008 2009 <strong>2010</strong><br />
Five or more awards at Foundation or better by S4 89% 89% 92% 93%<br />
Five or more awards at General or better by S4 73% 72% 77% 78%<br />
Five or more awards at Credit or better by S4 30% 33% 35% 34%<br />
Five or more Awards at Higher or better by S5 6% 7% 8% 12%<br />
Figure 11: Attendance Rates in Secondary Schools<br />
92.0<br />
91.0<br />
90.0<br />
89.0<br />
88.0<br />
87.0<br />
86.0<br />
Source: Education Services<br />
% Attendance (primary)<br />
2004/05 2005/06 2006/07 2007/08 2008/09 2009/10<br />
% Attendance (Secondary)<br />
2004/05 2005/06 2006/07 2007/08 2008/09 2009/10<br />
Authority<br />
Scotland<br />
Authority<br />
Scotland<br />
Primary school attendance has increased<br />
over the last five years in <strong>Falkirk</strong> and across<br />
Scotland. During this period, with the<br />
exception of 2005/06, attendance in <strong>Falkirk</strong>’s<br />
primary schools has been consistently<br />
above the Scottish average. <strong>Falkirk</strong> has<br />
increased the gap in the last year for which<br />
statistics have been published (2008/09).<br />
Levels of attendance in primary schools<br />
remain high, and in conjunction with the low<br />
levels of exclusion, contribute to the<br />
promotion of children’s achievement and<br />
learning.<br />
Attendance of pupils similarly shows a<br />
positive pattern of improvement in recent<br />
years.<br />
In the secondary sector <strong>Falkirk</strong>’s secondary<br />
schools have made great progress in the<br />
last five years. From a position of being 2%<br />
poorer, in terms of attendance, than the<br />
Scottish average in 2004/05, <strong>Falkirk</strong>’s<br />
attendance rate in the last year for which<br />
statistics have been published (2008/09)<br />
was 0.6% above the Scottish average.
Health<br />
Table 30: Health<br />
<strong>Poverty</strong> & <strong>Inequalities</strong> <strong>Profile</strong><br />
<strong>Falkirk</strong> 2009<br />
Life Expectancy & Mortality Number <strong>Falkirk</strong> Scotland<br />
Life Expectancy Males (years) - 74.6 74.5<br />
Life Expectancy Females (years) - 79.2 79.5<br />
Deaths, All Ages (per 100,000 population) 4,706 713.9 707.8<br />
Deaths from Heart Disease aged