Poverty & Inequalities Profile - Falkirk 2010 - Falkirk Council
Poverty & Inequalities Profile - Falkirk 2010 - Falkirk Council
Poverty & Inequalities Profile - Falkirk 2010 - Falkirk Council

You also want an ePaper? Increase the reach of your titles
YUMPU automatically turns print PDFs into web optimized ePapers that Google loves.
Debt<br />
Breakdown on Type of clients<br />
<strong>Poverty</strong> & <strong>Inequalities</strong> <strong>Profile</strong><br />
<strong>Falkirk</strong> 2009<br />
Gender: Over the period and across all offices the pattern remained very similar with just over 40% of clients being<br />
female, 32.8% of clients were male, with couples making up 25.8% of all clients.<br />
Age: Around 75% of clients were aged 21-50 with roughly the same proportion in each of the age groups 21-30,<br />
31-40 and 41-50. A further 15% were aged 51-60. There were very few aged under 20 or over 70. This age<br />
distribution of clients is not particularly surprising as debt is less common among older people and very young<br />
adults.<br />
Household type:<br />
50% of clients lived in single person households and 20% were single parents. Both figures are significantly higher<br />
than the <strong>Council</strong> average which shows 35% of households as single persons and only 7% as single parent<br />
households. Given that almost half of all single adult households are pensioners 1 but pensioners make up only a<br />
small proportion of debt clients, this suggests that single adult households are almost three times more likely to<br />
approach debt counsellors than their representation in the population would suggest. Single parent households were<br />
also almost three times more likely to be receiving support for debt problems than others<br />
It is perhaps not surprising that non-pensioner single adults and single parents are more likely than average to have<br />
debt problems since they have only one income, whether from earnings or benefits, coming into the household. Table<br />
24 shows the proportion of single adult households and single parents who are on low incomes compared with the<br />
average. These figures are taken from the Scottish Household Survey and refer to Scotland as a whole.<br />
Table 24: Household income by household type<br />
Household type<br />
Net annual income Single non-pensioner adult Single parent All<br />
< £10,000 30% 19% 20%<br />
£10,001-£20,000 45% 59% 34%<br />
£20,000 + 25% 22% 46%<br />
100% 100% 100%<br />
Source: Scottish Household Survey 2007/08 http://www.scotland.gov.uk/Resource/Doc/933/0092736.xls#Table_6_1_1<br />
This shows that these two types of households have lower incomes than average. 30% of single non-pensioner adult<br />
households have net incomes of under £10,000 compared to 20% of all households and 78% of single parents have<br />
incomes of less than £20,000 compared to 54% of all households.<br />
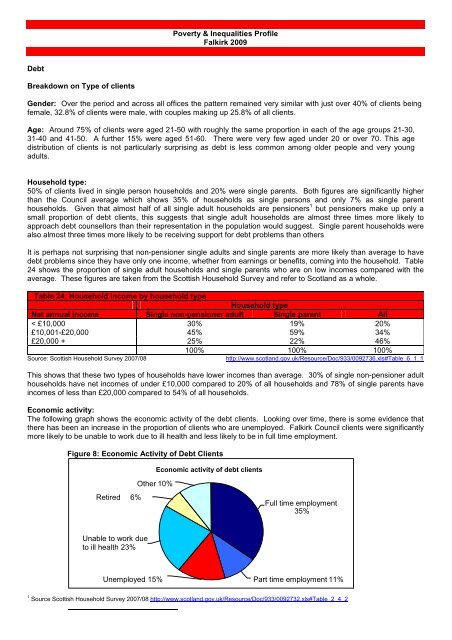
Economic activity:<br />
The following graph shows the economic activity of the debt clients. Looking over time, there is some evidence that<br />
there has been an increase in the proportion of clients who are unemployed. <strong>Falkirk</strong> <strong>Council</strong> clients were significantly<br />
more likely to be unable to work due to ill health and less likely to be in full time employment.<br />
Figure 8: Economic Activity of Debt Clients<br />
Retired 6%<br />
Unable to work due<br />
to ill health 23%<br />
Other 10%<br />
Unemployed 15%<br />
Economic activity of debt clients<br />
Full time employment<br />
35%<br />
Part time employment 11%<br />
1 Source Scottish Household Survey 2007/08 http://www.scotland.gov.uk/Resource/Doc/933/0092732.xls#Table_2_4_2